. 2021 Dec 10;12(1):7186.
doi: 10.1038/s41467-021-27319-z.

Ciliary Hedgehog signaling patterns the digestive system to generate mechanical forces driving elongation

Affiliations

Ciliary Hedgehog signaling patterns the digestive system to generate mechanical forces driving elongation

Ying Yang et al. Nat Commun. .

Abstract

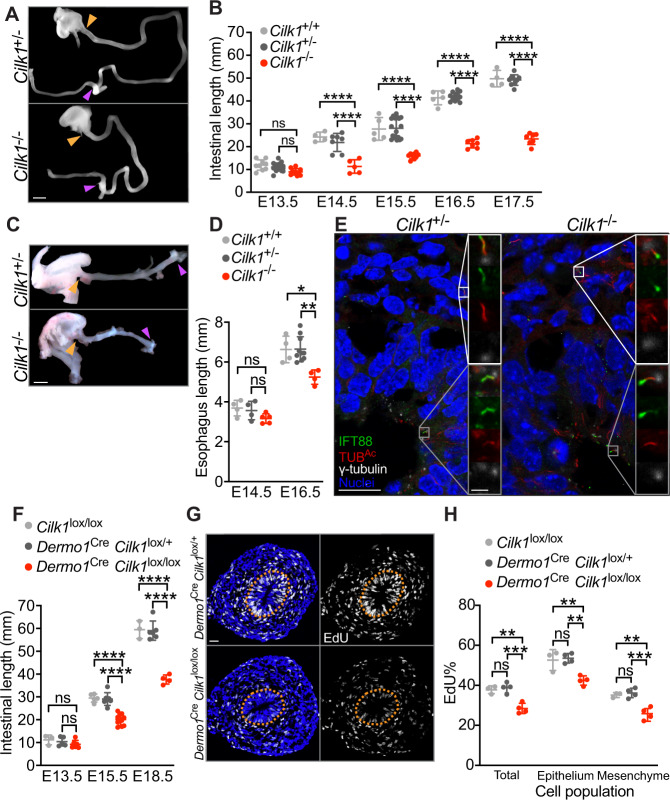
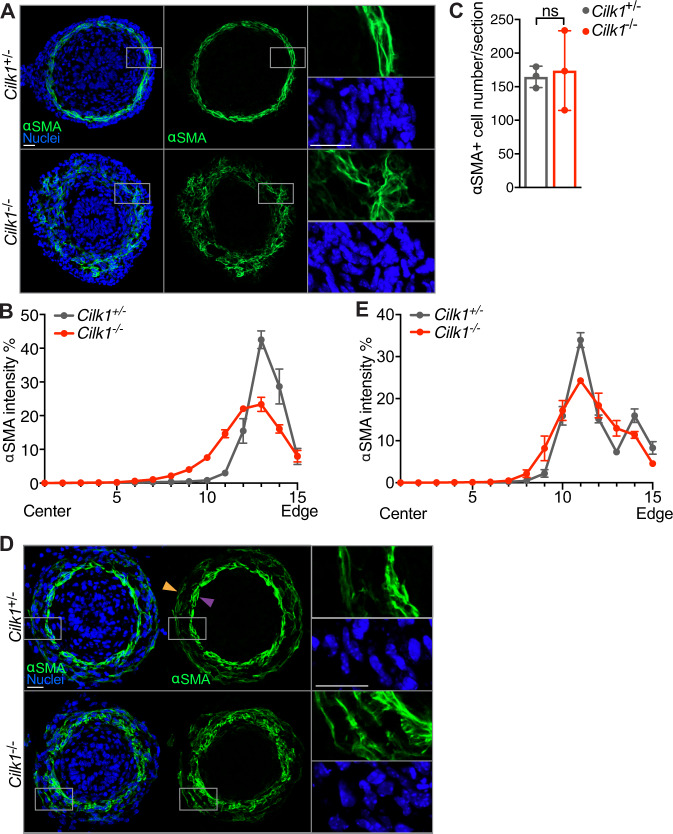
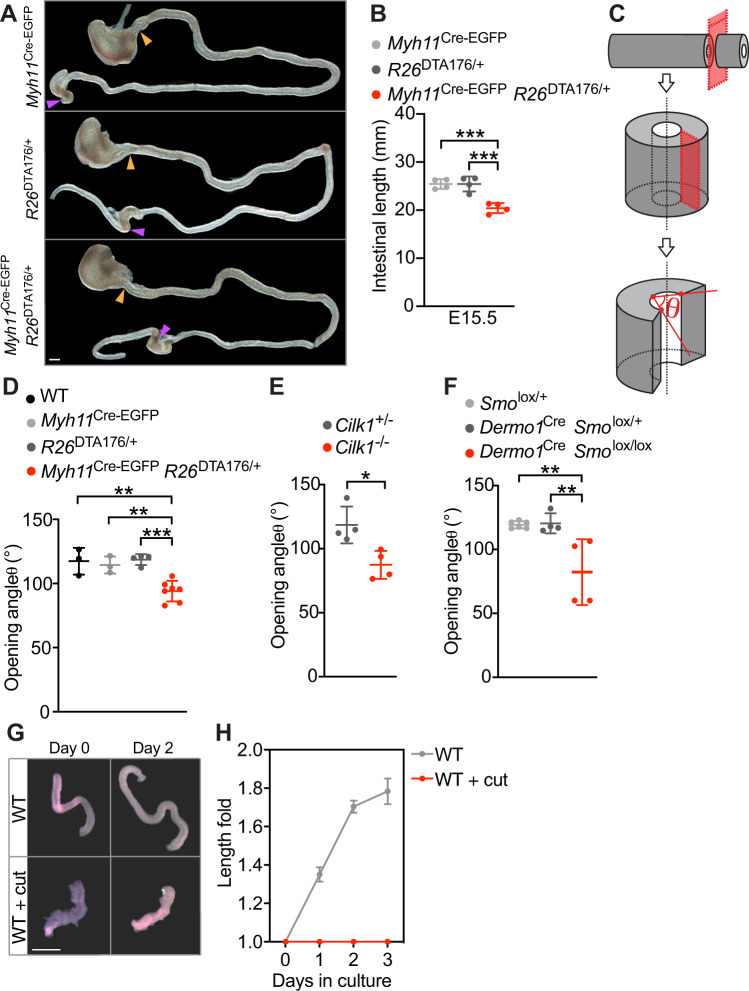
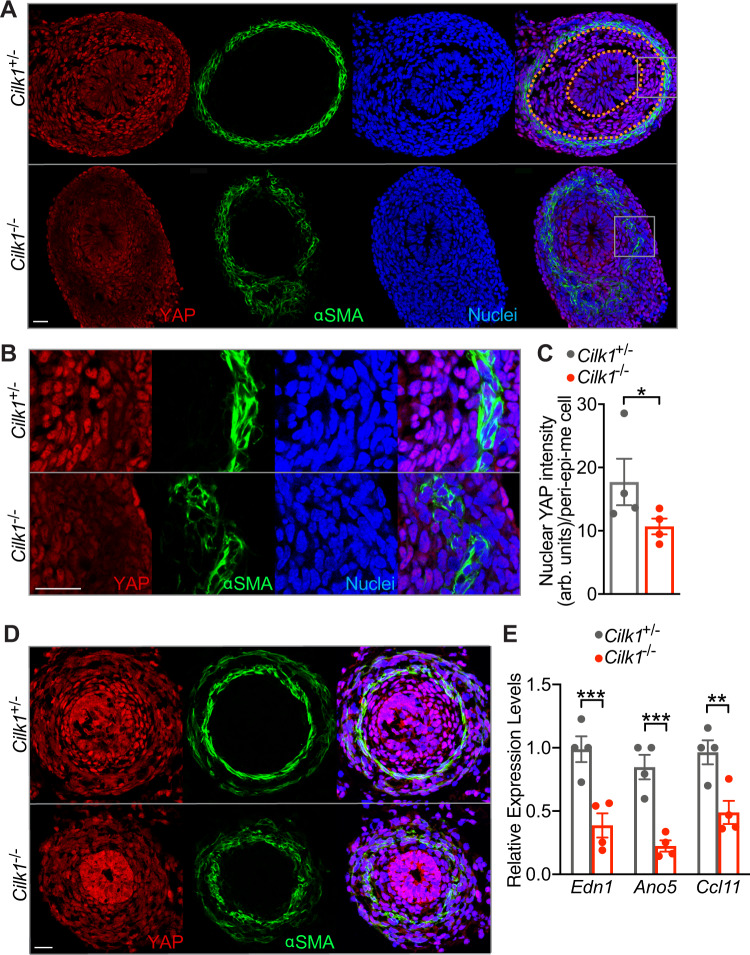
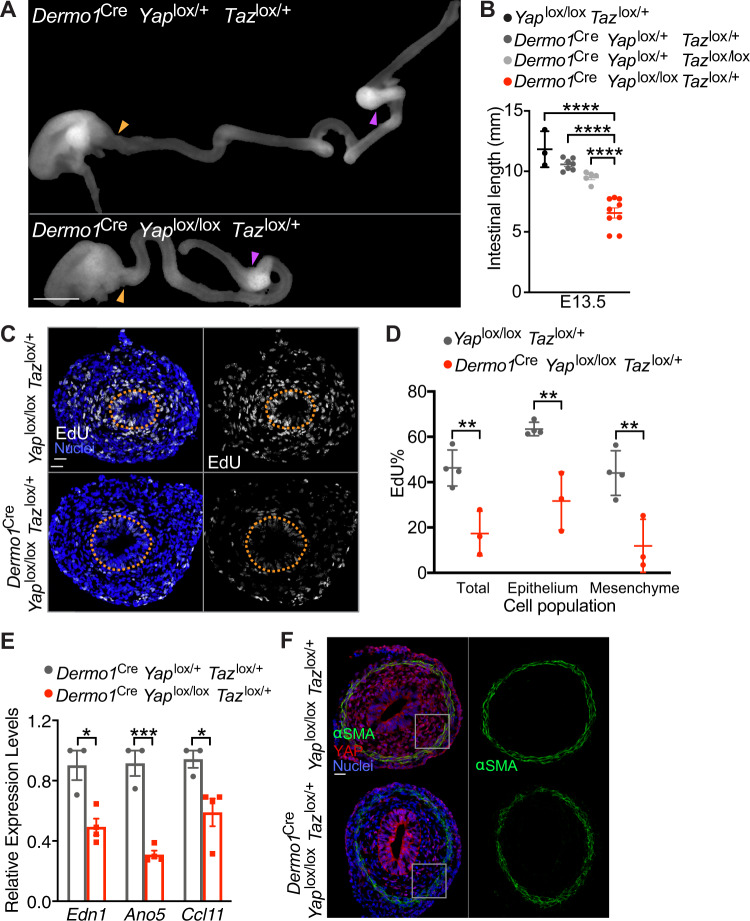
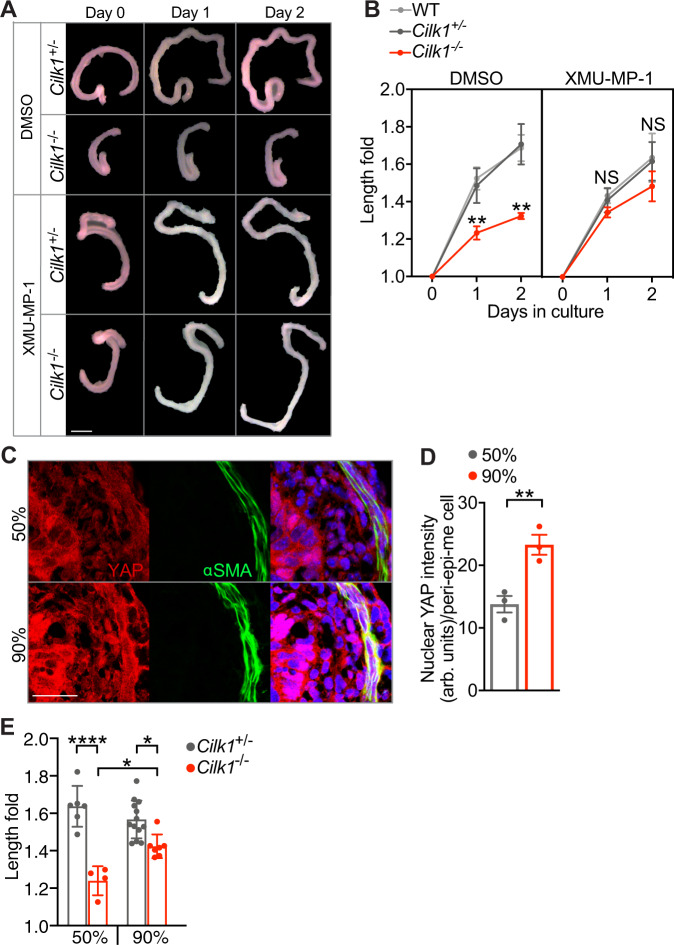
How tubular organs elongate is poorly understood. We found that attenuated ciliary Hedgehog signaling in the gut wall impaired patterning of the circumferential smooth muscle and inhibited proliferation and elongation of developing intestine and esophagus. Similarly, ablation of gut-wall smooth muscle cells reduced lengthening. Disruption of ciliary Hedgehog signaling or removal of smooth muscle reduced residual stress within the gut wall and decreased activity of the mechanotransductive effector YAP. Removing YAP in the mesenchyme also reduced proliferation and elongation, but without affecting smooth muscle formation, suggesting that YAP interprets the smooth muscle-generated force to promote longitudinal growth. Additionally, we developed an intestinal culture system that recapitulates the requirements for cilia and mechanical forces in elongation. Pharmacologically activating YAP in this system restored elongation of cilia-deficient intestines. Thus, our results reveal that ciliary Hedgehog signaling patterns the circumferential smooth muscle to generate radial mechanical forces that activate YAP and elongate the gut.


Conflict of interest statement

The authors declare no competing interests.

Figures

Fig. 1
Fig. 1. Mesenchymal cilia are essential for the cell proliferation and elongation of tubular organs.
A E14.5 intestines after separation from the mesentery of Cilk1+/− and Cilk1−/− embryos. The length of the small intestine was measured from the caudal stomach (orange arrowheads) to the rostral cecum (purple arrowheads). Scale bar, 1 mm. B Lengths of the small intestines of Cilk1+/+ (n = 9, 4, 5, 5, 4), Cilk1+/− (n = 18, 7, 18, 12, 9), and Cilk1−/− (n = 10, 5, 9, 7, 7) embryos at E13.5, 14.5, 15.5, 16.5, and 17.5. C E16.5 esophagi of Cilk1+/− and Cilk1−/− embryos. The length of the esophagi was measured from the stomach (orange arrowheads) to the pharynx (purple arrowheads). Scale bar, 1 mm. D Lengths of the esophagi of Cilk1+/+ (n = 4 and 4), Cilk1+/− (n = 4 and 8), and Cilk1−/− (n = 5 and 4) embryos at E14.5 and E16.5 (adjusted P values are 0.0021 for Cilk1+/+ vs Cilk1−/− and 0.0003 for Cilk1+/− vs Cilk1−/−). E Immunofluorescence staining of E13.5 intestinal cross sections from Cilk1+/− and Cilk1−/− embryos for IFT88 (green), ciliary axonemes (TUBAc, red), basal bodies (γ-tubulin, white), and nuclei (Hoechst, blue). Right, higher magnifications of boxed cilia. White boxes highlight mesenchymal cilia and gray boxes highlight epithelial cilia. Scale bar of larger images, 5 μm. Scale bar of enlarged images, 2 μm. F Lengths of E13.5, E15.5, and E18.5 control (Cilk1lox/lox n = 3, 5, 3 and Dermo1Cre Cilk1lox/+ n = 5, 7, 6) and Dermo1Cre Cilk1lox/lox (n = 6, 10, 4) small intestines. G Immunofluorescence staining for EdU (white) and nuclei (Hoechst, blue) in E13.5 Dermo1Cre Cilk1lox/+ and Dermo1Cre Cilk1lox/lox intestines. Scale bar, 25 μm. Orange dotted lines outline the epithelium. H The percentage of EdU-positive cells in the whole intestine, the epithelial cells and the mesenchymal cells in Cilk1lox/lox (n = 3), Dermo1Cre Cilk1lox/+ (n = 4) and Dermo1Cre Cilk1lox/lox (n = 4) embryos at E13.5. For each intestine, we averaged the percentages from three sections. B, D, F, and H Each point in the scatter plots represents the value from an individual embryonic intestine or esophagus. Horizontal bars indicate means ± SD. ns, p > 0.05; *p < 0.05; **p < 0.01; ***p < 0.001 and ****p < 0.0001 indicate adjusted P values between indicated samples by two-way ANOVA Tukey’s multiple comparisons test. Source data are provided in the Source Data file.
Fig. 2
Fig. 2. The circumferential smooth muscle cell layer is disrupted in the CILK1-deficient gut prior to length shortening.
A Immunofluorescence staining for smooth muscle (αSMA, green) and nuclei (Hoechst, blue) in E13.5 Cilk1+/− and Cilk1−/− intestines. B The radial distribution of αSMA staining intensity from the center of the section to the outer section edge of E13.5 Cilk1+/− (n = 4) and Cilk1−/− (n = 4) intestines, subdivided into 15 ring bins. C The number of αSMA-positive cells per section from E13.5 Cilk1+/− (n = 3) and Cilk1−/− (n = 3) intestines. For each embryonic intestine, the number of αSMA-positive cells was averaged from 3–8 stained sections. Values are presented as means ± SD. ns, p > 0.05 by two-sided unpaired t test. D Immunofluorescence staining for smooth muscle (αSMA, green) and nuclei (Hoechst, blue) in E14.5 Cilk1+/− and Cilk1−/− esophagi. Upper panel, arrowheads indicate two layers of esophageal muscularis: lamina muscularis interna (purple) and the lamina muscularis externa (orange). E The radial distribution of αSMA staining intensity from the center of the section to the outer section edge of E14.5 Cilk1+/− (n = 3) and Cilk1−/− (n = 3) esophagi, subdivided into 15 ring bins. A, D right, higher magnifications of boxed regions. Scale bars, 25 μm. B, E The αSMA intensity fraction in each bin was averaged from 3–8 sections. Values are presented as means ± SEM. X axis, bin number. Source data are provided in the Source Data file.
Fig. 3
Fig. 3. The circumferential smooth muscle creates residual stress to promote gut elongation.
A Intestines from E15.5 control (Myh11Cre-EGFP and R26DTA176/+) and Myh11Cre-EGFP R26DTA176/+ embryos. Scale bar, 1 mm. The length of the small intestine was measured from the end of the stomach (orange arrowheads) to the beginning of cecum (purple arrowheads). B Lengths of E15.5 control (Myh11Cre-EGFP n = 4 and R26DTA176/+ n = 4) and Myh11Cre-EGFP R26DTA176/+ (n = 4) small intestines. Each point in the scatter plots represents the value from an individual embryo. Values are presented as means ± SD. *** adjusted P = 0.0007 by ordinary one-way ANOVA Tukey’s multiple comparisons test. C Schematic of method for measuring the opening angle to assess residual stress. We isolated approximately 1 mm long sections of E13.5 small intestine, cut the intestinal wall axially and measured the opening angle (θ), with the vertex at the midpoint of the inner epithelial surface and the rays intersecting the innermost edges of the cut wall. D The opening angles of intestinal segments from E13.5 control (wild type, n = 3, Myh11Cre-EGFP, n = 3 and R26DTA176/WT, n = 4) and Myh11Cre-EGFP R26DTA176/+ (n = 7) embryos. Adjusted P values are 0.0018 for Myh11Cre-EGFP R26DTA176/+ vs WT, 0.0054 for Myh11Cre-EGFP R26DTA176/+ vs Myh11Cre-EGFP, and 0.005 for Myh11Cre-EGFP R26DTA176/+ vs R26DTA176/WT. E The opening angles of intestinal segments from E13.5 Cilk1+/- (n = 4) and Cilk1−/− (n = 4) embryos. *p = 0.0138 by two-sided unpaired t test. F The opening angles of intestinal segments from E13.5 (Smolox/+, n = 6 and Dermo1Cre Smolox/+, n = 4) and Dermo1Cre Smolox/lox (n = 4) embryos. Adjusted P values are 0.0038 for Dermo1Cre Smolox/lox vs Smolox/+ and 0.0058 for Dermo1Cre Smolox/lox vs Dermo1Cre Smolox/+. G Representative E13.5 wild-type intestine segments opened axially (WT + cut) or not before (Day 0) and after culture in Matrigel for 2 days (Day 2). Scale bar, 1 mm. H Length fold change of the cultured intestine segments (WT: n = 3; WT + cut: n = 3) for indicated days. DF For each intestine, we calculated the median angle of 5–15 segments. DF and H values are presented as means ± SD. *p < 0.05; **p < 0.01; ***p < 0.001 by ordinary one-way ANOVA Sidak’s multiple comparisons test, except in E. Source data are provided in the Source Data file.
Fig. 4
Fig. 4. YAP nuclear levels and activity depend on CILK1.
A Immunofluorescence staining of E13.5 Cilk1+/- and Cilk1−/− intestines for YAP (red), smooth muscle (αSMA, green), and nuclei (Hoechst, blue). Scale bar, 25 μm. Orange dotted lines outline the epithelium and smooth muscle cell boundaries, in between are the peri-epithelial mesenchymal cells. B Magnifications of the boxed areas from A. Scale bar, 25 μm. C Nuclear YAP intensities of peri-epithelial mesenchymal (peri-epi-me) cells in E13.5 Cilk1+/- (n = 4) and Cilk1−/− (n = 4) intestines. For each intestine, the nuclear YAP intensity per cell was averaged from three sections. Values are presented as means ± SEM. *p = 0.0176 by two-sided ratio paired t test. D Immunofluorescence staining of E14.5 Cilk1+/- and Cilk1−/− esophagi for YAP (red), smooth muscle (αSMA, green) and nuclei (Hoechst, blue). Scale bar, 25 μm. E Relative levels of End1, Ano5, and Ccl11 mRNA of E13.5 control Cilk1+/- (n = 4) and Cilk1−/− (n = 4) intestines. Values are presented as means ± SEM. **p < 0.01 and ***p < 0.001 by two-sided unpaired t test (0.0051 for Edn1, 0.0011 for Ano5 and 0.0114 for Ccl11). Source data are provided in the Source Data file.
Fig. 5
Fig. 5. YAP functions in the mesenchyme to promote gut elongation and cell proliferation.
A Photos of E13.5 Dermo1Cre Yaplox/+ Tazlox/+ and Dermo1Cre Yaplox/lox Tazox/+ intestines. Scale bar, 1 mm. The length of the small intestine was measured from the caudal stomach (orange arrowheads) to the rostral cecum (purple arrowheads). B Lengths of E13.5 in Yaplox/lox Tazlox/+ (n = 3), Dermo1Cre Yaplox/+ Tazlox/lox (n = 7), Dermo1Cre Yaplox/+ Tazlox/+ (n = 5) and Dermo1Cre Yaplox/lox Tazox/+ (n = 9) intestines. Horizontal bars indicate means ± SD. ****p < 0.0001 by one-way ANOVA Sidak’s multiple comparisons test. C Immunofluorescence staining of E12.5 Yaplox/lox Tazlox/+ and Dermo1Cre Yaplox/lox Tazlox/+ intestines for EdU (white) and nuclei (Hoechst, blue). Scale bar, 25 μm. Orange dotted lines outline the epithelium. D The percentage of EdU-positive cells in the E12.5 whole intestine, the epithelial cells or the mesenchymal cells in Yaplox/lox Tazlox/+ (n = 4) and Dermo1Cre Yaplox/lox Tazlox/+ (n = 3). For each intestine, we averaged the percentages in the indicated cell population from three stained sections. Horizontal bars indicate means ± SD. **p < 0.01 by two-way ANOVA Sidak’s multiple comparisons test (adjusted P are 0.0031 for Total, 0.0014 for Epithelium and 0.0013 for Mesenchyme). E Relative levels of End1, Ano5, and Ccl11 mRNA in E13.5 control (Dermo1Cre Yaplox/+ Tazlox/+, n = 3) and Dermo1Cre Yaplox/lox Tazlox/+ (n = 4) intestines. Values are presented as means ± SEM. *p < 0.05 and ***p < 0.001 by two-sided unpaired t test (0.0114 for Edn1, 0.0005 for Ano5 and 0.0311 for Ccl11). F Immunofluorescence staining of E13.5 Yaplox/lox Tazlox/+ and Dermo1Cre Yaplox/lox Tazlox/+ intestines for YAP (red), smooth muscle (αSMA, green) and nuclei (Hoechst, blue). Higher magnifications of boxed regions are depicted in Supplementary Fig. 12B. Scale bar, 25 μm. Source data are provided in the Source Data file.
Fig. 6
Fig. 6. Modulating the Hippo pathway restores elongation of Cilk1−/− intestine.
A Representative E13.5 intestines of indicated genotypes before (Day 0) and after culture in Matrigel with DMSO or XMU-MP-1 for indicated days. Scale bar, 1 mm. B Fold change of intestinal length after culture in Matrigel with DMSO (WT, n = 6; Cilk1+/−, n = 5; Cilk1−/−, n = 4) or XMU-MP-1 (WT, n = 3; Cilk1+/−, n = 4; Cilk1−/−, n = 6) for indicated days. The values are presented as means ± SD. ns p > 0.05, **p < 0.01 by two-way ANOVA Sidak’s multiple comparisons test (adjusted P values are 0.0046 for day 1 and 0.0025 for day 2 between Cilk1+/− DMSO and Cilk1-/- DMSO). C Immunofluorescence staining of E13.5 wild-type intestine cultured for one day in 50% or 90% Matrigel for YAP (red), smooth muscle (αSMA, green) and nuclei (Hoechst, blue). Scale bars, 25 μm. D Nuclear YAP intensities of peri-epithelial mesenchymal cells in C. n = 3 for each group. For each intestine, the nuclear YAP intensity per cell was averaged from three sections. Values are presented as means ± SEM. **p = 0.035 by two-sided paired t test. E Fold change of intestinal length after culture in 50% (Cilk1+/−, n = 6; Cilk1-/-, n = 4 or 90% (Cilk1+/−, n = 13; Cilk1-/-, n = 7) Matrigel for two days. The values are presented as means ± SD. *p < 0.05, ****p < 0.0001 by one-way ANOVA Turkey’s multiple comparisons test. Adjusted P value are: 0.0194 for Cilk1-/- 50% vs Cilk1-/- 90% and 0.0145 for Cilk1+/− 90% vs Cilk1-/- 90%. Source data are provided in the Source Data file.

References

    1. FitzSimmons J, Chinn A, Shepard TH. Normal length of the human fetal gastrointestinal tract. Pediatr. Pathol. 1988;8:633–641. - PubMed
    1. Stark R, Dunn JCY. Mechanical enterogenesis - a review. J. Healthc. Eng. 2012;3:229–242.
    1. Huycke TR, et al. Genetic and mechanical regulation of intestinal smooth muscle development. Cell. 2019;179:90–105.e21. - PMC - PubMed
    1. Kim HY, et al. Localized smooth muscle differentiation is essential for epithelial bifurcation during branching morphogenesis of the mammalian lung. Dev. Cell. 2015;34:719–726. - PMC - PubMed
    1. Chin AM, Hill DR, Aurora M, Spence JR. Morphogenesis and maturation of the embryonic and postnatal intestine. Semin. Cell Dev. Biol. 2017;66:81–93. - PMC - PubMed

Publication types

Substances