. 2021 Dec 10;12(1):7185.
doi: 10.1038/s41467-021-27421-2.

Dynamic regulation of N6,2'-O-dimethyladenosine (m6Am) in obesity

Affiliations

Dynamic regulation of N6,2'-O-dimethyladenosine (m6Am) in obesity

Moshe Shay Ben-Haim et al. Nat Commun. .

Abstract

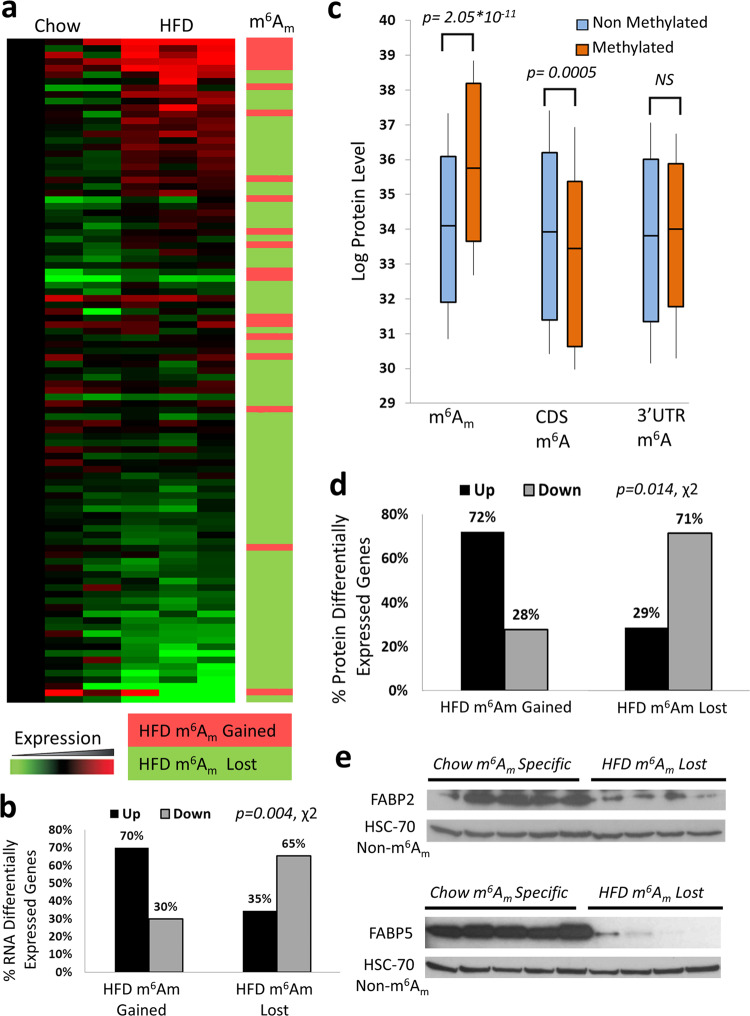
The prevalent m6Am mRNA cap modification was recently identified as a valid target for removal by the human obesity gene FTO along with the previously established m6A mRNA modification. However, the deposition and dynamics of m6Am in regulating obesity are unknown. Here, we investigate the liver m6A/m methylomes in mice fed on a high fat Western-diet and in ob/ob mice. We find that FTO levels are elevated in fat mice, and that genes which lost m6Am marking under obesity are overly downregulated, including the two fatty-acid-binding proteins FABP2, and FABP5. Furthermore, the cellular perturbation of FTO correspondingly affect protein levels of its targets. Notably, generally m6Am- but not m6A-methylated genes, are found to be highly enriched in metabolic processes. Finally, we deplete all m6A background via Mettl3 knockout, and unequivocally uncover the association of m6Am methylation with increased mRNA stability, translation efficiency, and higher protein expression. Together, these results strongly implicate a dynamic role for m6Am in obesity-related translation regulation.


Conflict of interest statement

The authors declare no competing interests.

Figures

Fig. 1
Fig. 1. m6Am genes are associated with higher translation efficiency, mRNA stability, and increased protein levels in m6A depleted mES Mettl3 KO cells.
a m6A methylation. b Cap m6Am methylation. c Distance of MACS methylation peaks from a reported annotated TSS. d Percent of adenosines in annotated TSS as a function of peak fold change. e Sequence logo of the m6Am peaks around and upstream the annotated TSS within the DNA, portraying the canonical m6Am genomic consensus. f Fraction of m6Am methylated genes across their RNA expression percentile bins. g Log ribosome footprint reads of m6Am- and non-m6Am-decorated genes as a function of their mRNA expression percentile, portraying higher ribosome occupancy of m6Am-modified genes above and beyond their expected corresponding RNA level. Two-tailed p-value of an ANCOVA analysis controlling for RNA levels of each gene as covariates is reported, F(1,13843) = 155.14, p = 2.02 × 10−35. h Ribosome release scores (RRS) of m6Am and non-m6Am-modified genes. Two-tailed p-value of the Mann Whitney U test is reported, covering a total of 13,240 genes. Box plot surrounds the 1–3 quartiles, whiskers denote 1.5 interquartile range. i Log high-throughput proteomic profiling of m6Am- and non-m6Am-modified genes. Two-tailed p-value of the Mann Whitney U test is reported, covering a total of 3970 genes. Box plot surrounds the 1–3 quartiles, whiskers denote 1.5 interquartile range. j mRNA half-life measurements of m6Am- and non-m6Am-modified genes. Two-tailed p-value of the Mann Whitney U test is reported, covering a total of 19,649 genes. Box plot surrounds the 1–3 quartiles, whiskers denote 1.5 interquartile range. Source data are provided as a Source Data file.
Fig. 2
Fig. 2. High fat diet mice physiologic parameters and enrichment of m6Am-modified genes in GO terms associated with metabolic processes.
a Gain in weight of mice fed a high fat diet (HFD) or regular chow diet across weeks. N = 10 (5 HDF mice, and 5 Chow lean control mice), error bars denote SEM. b NMR measurement of lean and fat mass body composition, indicating that the gain in weight was mainly in fat mass. N = 10 (5 HDF mice, and 5 Chow lean control mice). c Fold change of read end counts (IP/Input) within a sliding window of 5 base-pairs around a reported adenosine TSS in the Fabp2 gene in lean (chow) and HFD mice. All adenosines in the sequence are indicated. d Sequence logo of the m6Am peaks around and upstream the annotated TSS within the DNA, portraying the canonical m6Am genomic consensus. e. Gene ontology analysis of m6Am and CDS m6A (>50 nt of TSS) showing a clear enrichment of m6Am- but not in m6A-modified genes, in GO terms associated with metabolic processes. Source data are provided as a Source Data file.
Fig. 3
Fig. 3. m6Am significantly regulates mRNA and protein levels upon high fat diet.
a mRNA expression heatmap of >1.5 fold differentially expressed genes with differential m6Am methylation in HFD. Heatmap colors represent differential mRNA expression fold-change levels in the respective gene between mice samples (green - lower expression; red - higher expression). Right panel indicates if m6Am was gained (light red - HFD specific) or lost (light green - chow specific) in HFD. b Heatmap quantification of the mRNA differentially expressed genes that gained or lost m6Am upon HFD. Two-tailed p-value of the Chi-square test is reported. c Log protein expression levels of m6Am or m6A methylated genes versus non-methylated genes in lean control (chow) mice. Two-tailed p-values of the Mann Whitney U test are reported, covering 2246, 1998, and 5737 genes with the respective locations. Box plots surround the 1–3 quartiles, whiskers denote 1.5 interquartile range. d Full proteomic profiling proportions of genes with protein differential expression >1.5 fold, which gained or lost m6Am upon HFD. Two-tailed p-value of the Chi-square test is reported. Full proteomic abundance profiling was conducted on two HFD mice samples and two lean chow control mice samples covering a total of 5914 proteins detected. e Western blot of Fabp2 and Fabp5 genes, which were found decorated with m6Am only in lean mice. The results show a clear repeating pattern of overexpression across all lean biological replicates (N = 5) versus all fat biological replicates (N = 4). See Supplementary Fig. 4c for the quantification of these signals. The available molecular weight markers can be seen within the full scan blots which are available as Source data accompanying this figure, provided as a Source Data file.
Fig. 4
Fig. 4. FTO is highly expressed in HFD mice and its cellular perturbation affects protein levels of its m6Am-modified targets.
a m6A/m6Am peak ratio in FTO overexpression, FTO knockdown, and control HepG2 cells. Two-tailed p-value of the Chi-square test is reported. b Full proteomic abundance profiling of HepG2 cells overexpressing FTO. Results display a higher fraction of downregulated genes that lost m6Am in comparison to non-targets. Two-tailed p-value of the Chi-square test is reported. c High-throughput proteomic profiling of FTO knockdown in HepG2 cells. Results display a higher fraction of upregulated genes that gained m6Am in comparison to non-targets. Two-tailed p-value of the Chi-square test is reported. Full proteomic abundance profiling was conducted on an HepG2 FTO overexpression sample, an HepG2 FTO Knockdown sample, and an HepG2 control sample, and covered a total of 5487 proteins detected. d Western blot of liver FTO in HFD and regular chow diet control mice showing higher expression levels of FTO in HFD mice relative to the normalizing TUBULIN. The results show a clear repeating pattern of overexpression through most HFD biological replicates versus most lean control biological replicates. The available molecular weight markers can be seen within the full scan blots, which are available as source data. e Quantification of the FTO western blot signal relative to normalizing TUBULIN. Box plot surrounds the 1–3 quartiles, whiskers denote 1.5 interquartile range. p-values are indicated (two-tailed student t-test), N = 10 (five HFD and five Chow lean controls). Source data are provided as a Source Data file.
Fig. 5
Fig. 5. m6Am regulates mRNA and protein expression in ob/ob mice.
a ob/ob mice and their WT littermates’ weight on the day of sacrifice. N = 9 (4 ob/ob mice and 3 WT mice). b Sequence collapse of the m6Am peaks around and upstream the annotated TSS within the DNA portraying the canonical m6Am genomic consensus. c Western blot of FTO in ob/ob and WT mouse livers relative to the normalizing TUBULIN. The results show a clear repeating pattern of overexpression across five of six ob/ob biological replicates versus all three lean control biological replicates. The available molecular weight markers can be seen within the full scan blots, which are available as source data. d Quantification of the FTO western blot signal relative to the normalizing TUBULIN. Box plot surrounds the 1–3 quartiles, whiskers denote 1.5 interquartile range, p-values are indicated (two-tailed student t-test with unequal variance), N = 9 (six ob/ob and three WT lean controls). e Proportions of genes which were upregulated or downregulated (>1.5 fold) upon gain or loss of m6Am in ob/ob mice, relative to their overall expected ratios in the sample without m6Am peak categorization. Two-tailed p-value of the Chi-square test is reported. f Full proteomic abundance profiling proportions of genes with protein differential expression >1.5 fold which gained or lost m6Am in ob/ob mice. Two-tailed p-value of the Chi-square test is reported. Full proteomic abundance profiling was conducted on two ob/ob mice samples and two lean wt samples covering a total of 5568 proteins detected. Source data are provided as a Source Data file.

References

    1. Frayling TM, et al. A common variant in the FTO gene is associated with body mass index and predisposes to childhood and adult obesity. Science. 2007;316:889–894. - PMC - PubMed
    1. Jia G, et al. N6-methyladenosine in nuclear RNA is a major substrate of the obesity-associated FTO. Nat. Chem. Biol. 2011;7:885–887. - PMC - PubMed
    1. Mauer J, et al. Reversible methylation of m6Am in the 5’ cap controls mRNA stability. Nature. 2017;541:371–375. - PMC - PubMed
    1. Zhao X, et al. FTO-dependent demethylation of N6-methyladenosine regulates mRNA splicing and is required for adipogenesis. Cell Res. 2014;24:1403–1419. - PMC - PubMed
    1. Hess ME, et al. The fat mass and obesity-associated gene (Fto) regulates activity of the dopaminergic midbrain circuitry. Nat. Neurosci. 2013;16:1042–1048. - PubMed

Publication types

LinkOut - more resources