. 2021 Dec 10;12(1):7199.
doi: 10.1038/s41467-021-27563-3.

Type-I collagen produced by distinct fibroblast lineages reveals specific function during embryogenesis and Osteogenesis Imperfecta

Affiliations

Type-I collagen produced by distinct fibroblast lineages reveals specific function during embryogenesis and Osteogenesis Imperfecta

Yang Chen et al. Nat Commun. .

Abstract

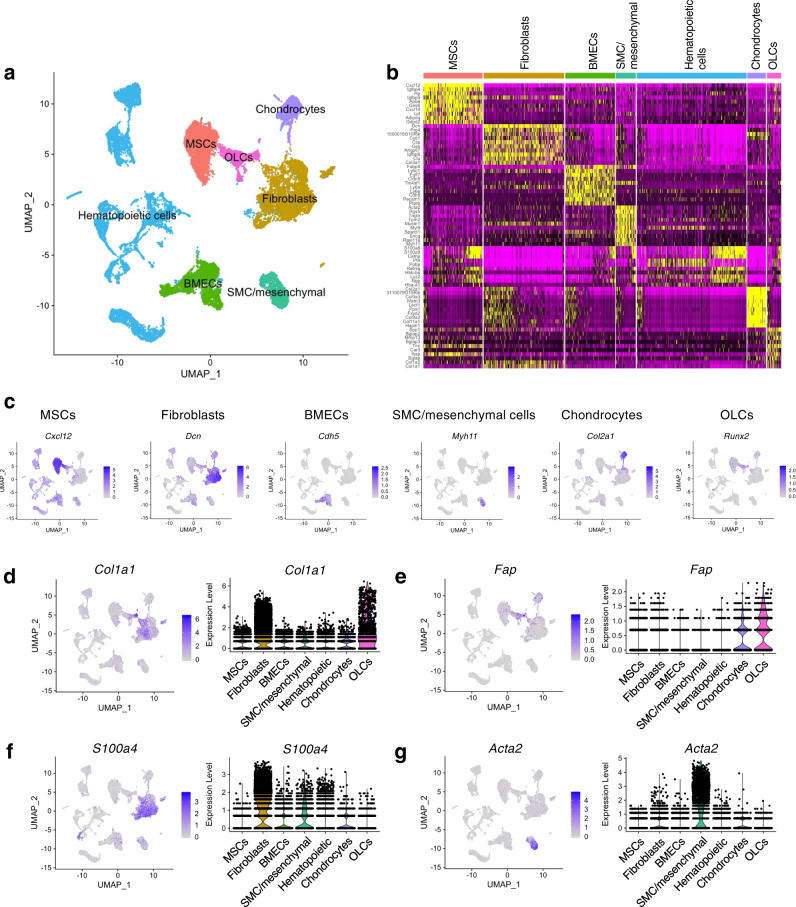
Type I collagen (Col1) is the most abundant protein in mammals. Col1 contributes to 90% of the total organic component of bone matrix. However, the precise cellular origin and functional contribution of Col1 in embryogenesis and bone formation remain unknown. Single-cell RNA-sequencing analysis identifies Fap+ cells and Fsp1+ cells as the major contributors of Col1 in the bone. We generate transgenic mouse models to genetically delete Col1 in various cell lineages. Complete, whole-body Col1 deletion leads to failed gastrulation and early embryonic lethality. Specific Col1 deletion in Fap+ cells causes severe skeletal defects, with hemorrhage, edema, and prenatal lethality. Specific Col1 deletion in Fsp1+ cells results in Osteogenesis Imperfecta-like phenotypes in adult mice, with spontaneous fractures and compromised bone healing. This study demonstrates specific contributions of mesenchymal cell lineages to Col1 production in organogenesis, skeletal development, and bone formation/repair, with potential insights into cell-based therapy for patients with Osteogenesis Imperfecta.


Conflict of interest statement

The authors declare no competing interests.

Figures

Fig. 1
Fig. 1. Single-cell RNA-sequencing analysis identifies Col1-producing cells/lineages in bone and bone marrow fractions.
ac Single-cell RNA-sequencing (sc-RNA-seq) analysis of cell mixture of mouse bone and bone marrow fractions (n = 6 mice) from a recently published dataset (GSE128423). Functional clusters of cells were defined with group definition listed, as implemented in the Seurat R package (a). MSCs mesenchymal stem/stromal cells, OLCs osteolineage cells derived from MSCs, BMECs bone marrow endothelial cells, SMC/mesenchymal smooth-muscle cell/mesenchymal lineage. b Heat map showing the scaled expression values of discriminating signature genes for the functional clusters of cells defined above. (c) Expression profile of representative signature gene for each of the non-hematopoietic cell clusters. Continued in Supplementary Fig. 1 and 2. dg Expression profile of type I collagen α1 chain (Col1a1; d), fibroblast activation protein (Fap; e), fibroblast-specific protein 1 (S100a4; f), and α-smooth muscle actin (Acta2; g) among defined cell clusters shown in UMAP plot and violin plot.
Fig. 2
Fig. 2. Systemic deletion of Col1 by CMV-Cre transgene results in early embryonic lethality.
a Genetic strategy to achieve systemic (whole-body) knockout of type I collagen α1 chain (Col1a1) by crossing the Col1a1loxP/loxP mice with generic CMV-Cre mice. b Genotype distribution in live offspring examined at the time of weaning from the crosses between CMV-Cre;Col1a1loxP/+ and Col1a1loxP/loxP mice. c, d Hematoxylin and eosin (H&E) staining of the embryos of CMV-Cre-negative;Col1a1loxP/loxP (WT; wild-type) and CMV-Cre;Col1a1loxP/loxP (Col1a1cmvKO) at embryonic day E9.5 (c) and E12.5 (d). Col1a1cmvKO embryo of E9.5 was indicated by dashed line, with labeled epiblast and trophoblast areas. Representative images were shown for WT embryos (n = 6) and Col1a1cmvKO embryos (n = 6) of E9.5 (c); and WT embryos (n = 6) and Col1a1cmvKO embryos (n = 3, limited number of obtained embryos due to lethality) of E12.5 (d). e Genotype distribution in live offspring examined at E9.5 and E12.5 from the crosses between CMV-Cre;Col1a1loxP/+ and Col1a1loxP/loxP mice. Scale bars of whole-mount sections, 1 mm; Scale bars at 50× magnification, 500 μm; Scale bars at 200× magnification, 100 μm; Scale bars at 630× magnification, 50 μm.
Fig. 3
Fig. 3. Specific deletion of Col1 in Fap-lineage cells leads to impaired skeletal development and late embryonic lethality.
a Genetic strategy to delete Col1a1 specifically in Fap-lineage cells by crossing the Col1a1loxP/loxP mice with Fap-Cre mice. b Wild-type (WT; with genotype of Fap-Cre-negative;Col1a1loxP/loxP) and Col1a1fapKO (Fap-Cre;Col1a1loxP/loxP) embryos at E16.5. The Col1a1fapKO embryo exhibits hydrops fetalis (white arrow) and hemorrhage (red arrow). c Genotype distribution in live offspring documented examined at E9.5 and E12.5 from the crosses between Fap-Cre;Col1a1loxP/+ and Col1a1loxP/loxP mice. df H&E staining (d) and Col1 immunohistochemistry staining (e) of the embryos of WT and Col1a1fapKO at E16.5. Quantification of % positive area for Col1 staining was based on three mice per group (f). The unpaired, two-tailed t test was used to compare the mean of two independent groups. **P = 0.00116 (tibia/fibula), ***P = 0.00057 (femur), **P = 0.00149 (radius/ulna). Data are represented as mean ± SEM. Additional Picrosirius Red staining was shown in Supplementary Fig. 4. g Genotype distribution in live offspring documented at the time of weaning from the crosses between Fap-Cre;Col1a1loxP/+ and Col1a1loxP/loxP mice. Scale bars of whole-mount sections, 5 mm; Scale bars at 50× magnification, 500 μm; Scale bars at 200× magnification, 100 μm.
Fig. 4
Fig. 4. The only live offspring of Col1a1fapKO genotype exhibits severe skeletal defects.
a Radiograph of three-week-old wild-type (WT, Fap-Cre-negative;Col1a1loxP/loxP) and Col1a1fapKO mice. b H&E staining of the forelimb whole-mount sections of 3-week-old WT (n = 3) and Col1a1fapKO (n = 1, limited by the fact that only one live Col1a1fapKO mouse was ever observed) mice. c H&E staining, Masson’s Trichrome staining (MTS), and Safranin-O/Fast Green staining on serial sections of the forelimbs from three-week-old WT (n = 3) and Col1a1fapKO (n = 1, limited by the fact that only one live Col1a1fapKO mouse was ever observed) mice. d Quantification of % positive area for MTS staining (blue indicating collagen deposition) and Safranin-O/Fast Green staining (red indicating cartilage) based on the staining shown in (c). Quantification of % positive area for staining was based on 10 bone samples from WT group (n = 3 mice) and Col1a1fapKO group (n = 1 mouse, limited by the fact that only one live Col1a1fapKO mouse was ever observed). The unpaired, two-tailed t test was used to compare the mean of two independent groups. *P = 0.0116, ***P = 1.11E-06. Data are represented as mean ± SEM. e Representative H&E and immunofluorescence images of humerus serial sections from Fap-Cre;LSL-tdTomato mice (n = 3 mice at 2-month-old) stained for osteoblast marker osteocalcin (green) and Fap-Cre-induced tdTomato (red). Scale bars, 50 μm. Scale bars of whole-mount sections, 5 mm; Scale bars at 50× magnification, 500 μm; Scale bars at 200× magnification, 100 μm.
Fig. 5
Fig. 5. Specific deletion of Col1 in Fsp1-lineage cells causes Osteogenesis Imperfecta phenotype.
a Genetic strategy to delete Col1a1 specifically in Fsp1-lineage cells by crossing the Col1a1loxP/loxP mice with Fsp1-Cre mice. b Survival of wild-type (WT; with genotype of Fsp1-Cre-negative;Col1a1loxP/loxP) and Col1a1fspKO (Fsp1-Cre;Col1a1loxP/loxP) mice (n = 24 and 26, respectively). Kaplan-Meier plots and the log rank Mantel-Cox test were used to evaluate statistical differences of survival. ****P < 0.0001. c Micro-CT scanning of 6-month-old WT and Col1a1fspKO mice (with white arrows indicating the fractures in pelvis and ischium of Col1a1fspKO mice). d Radiograph of Col1a1fspKO mice at the age from 1 to 6 month. Radiograph of age-matched WT littermates was shown in Supplementary Fig. 7a. e Summary of the occurrence of fractures in pelvis, ischium, and/or joints, as examined by radiograph, of WT (n = 6) and Col1a1fspKO (n = 8) mice at the age from 1 to 6 month. f Body weight of WT and Col1a1fspKO mice (n = 6 mice per group) at the age of 3, 12, and 24 month. The unpaired, two-tailed t test was used to compare the mean of two independent groups. ***P = 9.57E-05 (female 12 weeks), 7.15E-07 (female 24 weeks), 0.00096 (male 12 weeks), 2.35E-07 (male 24 weeks). Data are represented as mean ± SEM. g The micro-CT images of trabecular and cortical bones of femurs from 6-month-old WT mice (n = 4) and Col1a1fspKO mice (n = 3). The trabecular bone material property measurements are compared as bone mineral density (BMD; ***P = 1.04E-05), bone volume/total volume (BV/TV; * P = 0.0289), bone surface area/bone volume (BS/BV; **P = 0.00212), trabecular thickness (Tb.Th; *P = 0.0287), and trabecular number (Tb.N; *P = 0.0160). The unpaired, two-tailed t test was used to compare the mean of two independent groups. Data are represented as mean ± SEM. The cortical bone material property measurements are continued in Supplementary Fig. 7d. h Biomechanical (three-point bending) test results of femurs from 6-month-old WT mice (n = 7) and Col1a1fspKO mice (n = 5) were presented as ultimate load (**P = 0.00135), yield load (***P = 0.00012), post-yield energy (***P = 2.01E-05), and post-yield displacement (***P = 0.00077). The unpaired, two-tailed t test was used to compare the mean of two independent groups. Data are represented as mean ± SEM.
Fig. 6
Fig. 6. Histological analysis of bone tissues from Col1a1fspKO mice and Fsp1-Cre;LSL-YFP mice.
a, b H&E staining and Safranin-O/Fast Green staining of the forelimb elbow joints of 6-month-old WT and Col1a1fspKO mice (a). Quantification of % positive area for Safranin-O/Fast Green staining was based on three mice per group (b). The unpaired, two-tailed t test was used to compare the mean of two independent groups. **P = 0.00946. Data are represented as mean ± SEM. Scale bars at 50× magnification, 500 μm; Scale bars at 200× magnification, 100 μm. c Picrosirius Red staining of collagen content in the forelimb elbow joints from six-month-old WT and Col1a1fspKO mice (n = 3 mice per group) examined by circularly polarized light microscopy. Scale bars, 100 μm. d Representative immunofluorescence images of humerus serial sections from lineage-tracing Fsp1-Cre;LSL-YFP mice (n = 3 mice at two-month-old) stained for Fsp1-Cre-induced YFP. Scale bars, 50 μm. e Representative H&E and immunofluorescence images of humerus serial sections from Fsp1-Cre;LSL-YFP mice (n = 3 mice at two-month-old) stained for osteoblast marker osteocalcin (red) and Fsp1-Cre-induced YFP (green). Scale bars, 50 μm.
Fig. 7
Fig. 7. Single-cell RNA-sequencing analysis of bone marrow fractions from Col1a1fspKO mice.
ac Single-cell RNA-sequencing analysis of cell mixture of bone marrow fractions from 2-month-old WT and Col1a1fspKO mice (n = 2 per group). Functional clusters of cells were defined with group definition listed, as implemented in the Seurat R package (a). Mono/Macro: monocyte/macrophage cluster. HSPCs: hematopoietic stem and progenitor cells. Dendritic: dendritic cell cluster. Eosino/Baso: eosinophil/basophil cluster. b Pie charts showing the percentage of each of the functional cell clusters in bone marrow fractions from WT and Col1a1fspKO mice. Total neutrophil clusters containing 3 subpopulations (1–3) were further plotted as pie charts. (c) List of top signature genes of “Neutrophil-1” cluster shown in (a) and (b), presented with P value (based on the non-parameteric Wilcoxon Rank Sum test) and Log2 fold change. Continued in Supplementary Fig. 8a–c. d Expression profile of Mmp9, Cxcl12, and Retnlg among defined cell clusters in the bone marrow fractions from WT and Col1a1fspKO mice shown in UMAP plot. Continued in Supplementary Fig. 8d. e, f Top upregulated genes of Neutrophil-1 cluster in Col1a1fspKO mice than WT mice shown in heat map plot (e) or violin plot (f). g Representative immunofluorescence images and quantification results of humerus bone marrow from two-month-old WT and Col1a1fspKO mice (n = 5 per group) stained for Neutrophil-1 marker Ly6G (yellow). Scale bars, 50 μm. The unpaired, two-tailed t test was used to compare the mean of two independent groups. ***P = 0.00096. Data are represented as mean ± SEM.

References

    1. Hay ED. Extracellular matrix. J. cell Biol. 1981;91:205s–223s. - PMC - PubMed
    1. Lohler J, Timpl R, Jaenisch R. Embryonic lethal mutation in mouse collagen I gene causes rupture of blood vessels and is associated with erythropoietic and mesenchymal cell death. Cell. 1984;38:597–607. - PubMed
    1. Zaidi M. Skeletal remodeling in health and disease. Nat. Med. 2007;13:791–801. - PubMed
    1. Marini JC, et al. Osteogenesis imperfecta. Nat. Rev. Dis. Prim. 2017;3:17052. - PubMed
    1. Rauch F, Glorieux FH. Osteogenesis imperfecta. Lancet. 2004;363:1377–1385. - PubMed

Publication types

MeSH terms