. 2021 Dec;27(12):2099-2103.
doi: 10.1038/s41591-021-01564-7. Epub 2021 Dec 10.

Neurocognitive and hypokinetic movement disorder with features of parkinsonism after BCMA-targeting CAR-T cell therapy

Affiliations

Neurocognitive and hypokinetic movement disorder with features of parkinsonism after BCMA-targeting CAR-T cell therapy

Oliver Van Oekelen et al. Nat Med. 2021 Dec.

Abstract

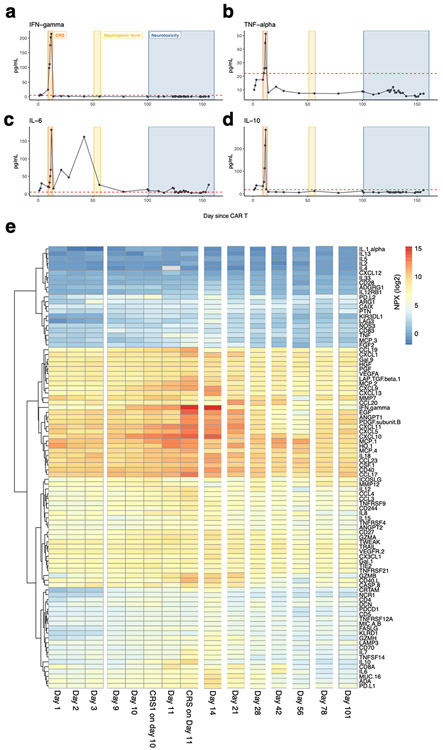
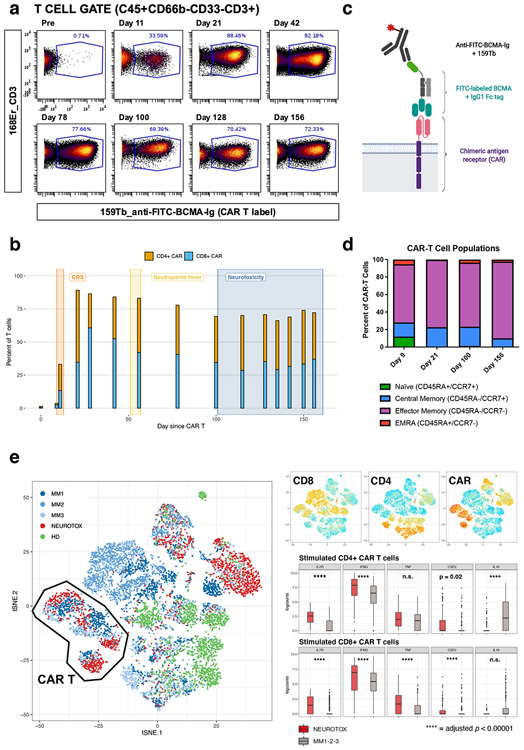
B-cell maturation antigen (BCMA) is a prominent tumor-associated target for chimeric antigen receptor (CAR)-T cell therapy in multiple myeloma (MM). Here, we describe the case of a patient with MM who was enrolled in the CARTITUDE-1 trial ( NCT03548207 ) and who developed a progressive movement disorder with features of parkinsonism approximately 3 months after ciltacabtagene autoleucel BCMA-targeted CAR-T cell infusion, associated with CAR-T cell persistence in the blood and cerebrospinal fluid, and basal ganglia lymphocytic infiltration. We show BCMA expression on neurons and astrocytes in the patient's basal ganglia. Public transcriptomic datasets further confirm BCMA RNA expression in the caudate of normal human brains, suggesting that this might be an on-target effect of anti-BCMA therapy. Given reports of three patients with grade 3 or higher parkinsonism on the phase 2 ciltacabtagene autoleucel trial and of grade 3 parkinsonism in the idecabtagene vicleucel package insert, our findings support close neurological monitoring of patients on BCMA-targeted T cell therapies.


Figures

Extended Data Fig. 1
Extended Data Fig. 1. Clinical course and biochemical parameters after CAR-T cell treatment.
The time periods associated with cytokine release syndrome (CRS), neutropenic fever and neurotoxicity are annotated in the individual subplots. All cytokine levels were determined in the peripheral blood. (a) Temperature curve. (b) Administration of relevant pharmacologic treatments during the period after CAR-T treatment. (c) Total leukocyte, lymphocyte, and neutrophil counts. (d) Time course of CRP level (mg/L). (e) Time course of ferritin level (ng/mL). (f) Time course of IL-18 level (pg/mL). (g) Time course of IL-2Ra (CD25) level (pg/mL).
Extended Data Fig. 2
Extended Data Fig. 2. Cytokine levels and time course after CAR-T cell treatment.
The time periods associated with cytokine release syndrome (CRS), neutropenic fever and neurotoxicity are annotated in the individual subplots. (a) Time course of IFN-gamma level (pg/mL). (b) Time course of TNF-alpha level (pg/mL). (c) Time course of IL-6 level (pg/mL). (d) Time course of IL-10 level (pg/mL). All measurements are from peripheral blood plasma. (e) Olink cytokine profiling of peripheral blood plasma at different time points after chimeric antigen receptor (CAR) T cell therapy. Values shown are normalized protein expression (NPX) values according the Olink protocol in log2 scale (high protein levels in red, low protein levels in blue).
Extended Data Fig. 3
Extended Data Fig. 3. MRI and Ioflupane single photon emission computed tomography imaging after the onset of neurotoxicity.
(a) MRI axial FLAIR (left) and T2 (right) images at the level of the deep brain nuclei (top) and the cerebral cortex (top), conducted at day 101 after CAR-T infusion. Images demonstrate small punctuate hyperintensities present on imaging prior to CAR-T therapy and putatively due to pre-existing microvascular damage. (b) Ioflupane (123-I) scan images, conducted at day 155 after CAR-T infusion, show normal uptake at the level of the basal ganglia.
Extended Data Fig. 4
Extended Data Fig. 4. Quantitative analysis of FDG-PET/CT images confirms decreased metabolism in caudate nucleus after CAR-T cell therapy.
(a) FDG-PET axial splash images pre (top) and post (bottom) CAR-T infusion. Shown is a spectral scale with high metabolism/perfusion in red, to low metabolism/perfusion in dark blue. (b) Quantitative analysis showing normalized Z-score for all available regions of the brain before (blue) and after (red) CAR-T infusion. The caudate is highlighted. The normalized score was calculated using MIMneuro, comparing the image with a library of 43 FDG neurologic controls (41-80 years old).
Extended Data Fig. 5
Extended Data Fig. 5. Mass cytometry characterizes the effector-memory phenotype of CAR-T cells over time.
(a) Representative mass cytometry (CyTOF) plots illustrating the gating strategy for identifying CAR-T cells and T cell subsets as shown in Figure 1a, 1d and Extended Data Figure 5e. (b) UMAP representation of peripheral blood mononuclear cells (PBMC) collected at time points shown in (a) shows the clustering of major immune cell types. (c) Relative contribution of major immune cell types in samples at different time points. (d) Expression of canonical markers, showing accurate classification of major immune celI types. (e) CAR-T cell phenotype, as determined by expression of CCR7 and CD45RA, illustrating a high fraction of effector-memory T cells at all time points. Each bar corresponds to N=1 sample collected from the patient. The UMAP plots visually illustrate the clustering of T cells and confirm low CCR7 and CD45RA expression on CAR-T cells.
Extended Data Fig. 6
Extended Data Fig. 6. Cytokine expression of peripheral blood CAR-T cells isolated at day 128 after treatment vs. healthy donor T cells.
(a) CAR-T cells isolated at day 128 after CAR-T infusion were stimulated with PMA/ionomycin and cytokine production was assessed with mass cytometry. Shown here is high expression of TNF-alpha, interferon-gamma and GM-CSF and lack of expression of IL-17 in CD4+ (left) and CD8+ (right) CAR-T cells. (b) Percentage of CAR-T cells (orange) and healthy donor (HD) T cells (blue) expressing the full set of cytokines tested before (UNSTIM) or after (STIM) stimulation with PMA/ionomycin. Each bar represents N=1 sample analyzed from the patient or healthy donor.
Extended Data Fig. 7
Extended Data Fig. 7. Expression of canonical markers on CITE-seq data identifies and clusters major immune cell types.
(a) t-SNE plot representation of CITE-seq analysis of peripheral blood mononuclear cells before and after PMA/ionomycin stimulation. Clustering was determined by similarity network fusion (SNF) and Louvain clustering algorithm. Individual cells are colored by subject (healthy donor (HD), neurotoxicity patient (NEUROTOX) and 3 other patients on the same clinical trial without neurotoxicity (MM1, MM2, MM3). Highlighted are the major immune cell types (B cells, NK cells, CD8+ T cells, CD4+ T cells, CAR-T cells and monocytes). There is a small cluster of events that corresponds to multiplets or debris (centrally, not highlighted). (b) Expression level of canonical genes: CD8A, CD4, CD14, FCGR3A (CD16), CD19 and NCAM1 (CD56). In each case showing both mRNA (top) and ADT (antibody-derived tag, representation of protein level) (high = red, low = blue). Expression levels are normalized as described in the Methods.
Extended Data Fig. 8
Extended Data Fig. 8. Expression of BCMA in healthy donors of the Allen Brain Atlas and presence of CAR-T cells in CSF of patient.
(a) Microarray data on top illustrates the expression of TNFRSF17 (BCMA) in the caudate nucleus of 5 healthy brain donors. The bottom shows that regions of TNFRSF17 (BCMA) expression coincides with DRD1 (dopamine receptor D1) expression, a protein know to be highly specific for the caudate nucleus. Image credit: Allen Institute: © 2010 Allen Institute for Brain Science. Allen Human Brain Atlas; available from: human.brain-map.org. (b) Schematic representation showing the log2 intensity of TNFRSF17 (BCMA) RNA expression in a single patient from the Allen Brain Atlas. Image credit: Allen Institute: © 2010 Allen Institute for Brain Science. Allen Human Brain Atlas; available from: human.brain-map.org. (c) Quantitative representation of the Allen Brain Atlas data with boxplots (median, Q1 and Q3 quartiles, whiskers up to 1.5 x IQR) showing normalized expression (z-score) across all six donors for different brain structures (N = 6, total of 3,702 probes across 27 brain regions). The p-values shown correspond to a two-sided Mann-Whitney U test of striatum versus any other region (**: p < 0.001, ***: p < 0.0001, n.s.: p ≥ 0.05).
Extended Data Fig. 9
Extended Data Fig. 9. Presence and persistence of CAR-T cells in CSF of patient and cytokine profiling in peripheral blood plasma versus CSF after development of neurotoxicity.
(a) Representative plots showing the gating strategy on CSF to get to the T cell gate. (b) Flow cytometric data of cerebrospinal fluid from day 148 after CAR-T cell infusion, showing presence of CD4+ and CD8+ CAR-T cells. (c) Flow cytometric data of cerebrospinal fluid from day 155 after CAR-T cell infusion (i.e. after administration of intravenous cyclophosphamide and intrathecal cytarabine), showing persistent presence of CD4+ and CD8+ CAR-T cells. (d) Normalized protein expression (NPX) log2 values of all cytokines in the Olink Immuno-Oncology panel, in serum (top) and CSF (bottom) (high protein levels in red, low protein levels in blue). (e) Scatter plot showing overall correlation of cytokine levels in plasma versus CSF (Pearson correlation coefficient r = 0.70, two-sided p < 0.001). (f) The log2 fold change (FC) of CSF versus blood plasma in a healthy control (along x-axis) and the patient who developed neurotoxicity (along y-axis). Highlighted are a selection of cytokines that are overrepresented in the patient’s CSF compared to the healthy control data. Among the cytokines that are overrepresented, we note a set of cytokines suggesting T cell activation (e.g. GZMB, GZMA, IFN-γ, CD40L, CD8A, CD27, FASLG), cytokines that are induced by IFN-γ (e.g. CXCL5, CXCL10, CXCL11) and that are known to act as chemo-attractants for T cells (among other immune cell types), and cytokines that point to possible involvement of cells in the blood-brain barrier (BBB) (e.g. PDGFb, EGF and ANGPT1).
Extended Data Fig. 10
Extended Data Fig. 10. Immunohistochemistry showing BCMA protein expression in brain tissue of the patient and in a control brain.
(a) BCMA immunohistochemistry of the caudate nucleus subependymal region (10x magnification, left, scale bar 200 μm). Inset (40x magnification, right, scale bar 50 μm) shows high magnification image of astrocytes (top) and a neuron (bottom) that stained positive for BCMA, whereas surrounding cells were negative. Images shown are representative slides from the caudate nucleus from the patient described in this case report (N=1). For each region stained, at least 3 slides were available. (b) BCMA immunohistochemistry of selected brain regions as annotated in the patient of interest (left) versus a control brain (right) from a subject who died due to non-neurologic illness (10x magnification (top), scale bar 200 μm and 20x magnification (middle, bottom), scale bar 100 μm). Images shown are representative slides from the patient described in this case report (N=1), as well as a single control brain (N = 1). For each region stained, at least 3 slides were available. The experiment was repeated in a second control brain with similar results.
Figure 1:
Figure 1:. Persistence of chimeric antigen receptor (CAR) T cells with an activated effector-memory phenotype in the peripheral blood.
(a) Mass cytometry (CyTOF) plots gated on CD3+ T cells, showing fraction of FITC-BCMA-labeled (i.e. CAR) T cells at different time points after CAR-T infusion. (b) Quantitative representation of data in (a), showing the relative contribution of CD4+ and CD8+ CAR-T cells at different timepoints. The time periods associated with cytokine release syndrome (CRS), neutropenic fever and neurotoxicity are annotated. Each bar corresponds to N=1 sample collected from the patient. (c) Schematic illustration of CyTOF strategy used to detect the CAR on the T cell surface, see Methods for details (figure panel created with BioRender.com). (d) CAR-T cell phenotype, as determined by expression of CCR7 and CD45RA, illustrating a high fraction of effector-memory T cells. Each bar corresponds to N=1 sample collected from the patient. (e) t-SNE plot representation of CITE-seq analysis of peripheral blood mononuclear cells before and after PMA/ionomycin stimulation. Clustering was determined by similarity network fusion (SNF) and Louvain clustering algorithm. Individual cells are colored by subject (healthy donor (HD), neurotoxicity patient (NEUROTOX) and 3 other patients on the same clinical trial without neurotoxicity (MM1, MM2, MM3). Highlighted on side plots is expression level of CD4, CD8 and CAR ADT (antibody-derived tag, representation of protein level, high = red, low = blue) and boxplots (median, Q1 and Q3 quartiles, whiskers up to 1.5 x IQR) showing expression of a subset of differentially expressed genes (*: p < 0.01, n.s.: p ≥ 0.05, two-sided Mann-Whitney U test) in patient with neurotoxicity (NEUROTOX, N = 1, data on 145 stimulated CD4+ CAR-T cells (top, red) and 119 stimulated CD8+ CAR-T cells (bottom, red) total) and the other MM patients (MM1-2-3, N = 3, data on 152 stimulated CD4+ CAR-T cells (top, gray) and 406 stimulated CD8+ CAR-T cells (bottom, gray) total).
Figure 2:
Figure 2:. BCMA is expressed in the caudate nucleus of healthy donors and post-mortem in the patient following CAR-T cell therapy.
(a) FDG-PET/CT illustrates decreased uptake in the caudate nucleus after development of neurotoxicity (POST, right, day 134 after CAR-T infusion), compared with previous imaging before development of neurotoxicity symptoms (PRE, left, day 77 after CAR-T infusion). Prior FDG-PET/CT imaging (before CAR-T infusion) was comparable to the pre-neurotoxicity scan. The scatter plot on the right illustrates the normalized Z-score of different regions of the brain before and after CAR-T infusion. The caudate is highlighted. The normalized score is calculated using MIMneuro, comparing the image with a library of 43 FDG neurologic controls (41-80 years old). (b) Visual representation of the expression of DRD1 and TNFRSF17 (BCMA) in a single patient from the Allen Brain Atlas. Expression of both genes (left, red = high) overlaps with the caudate nucleus region shown in 3D (right, purple). Image credit: Allen Institute: © 2010 Allen Institute for Brain Science. Allen Human Brain Atlas; available from: human.brain-map.org. (c) H&E staining of the caudate nucleus subependymal region (10x magnification, scale bar 200 μm). (d) GFAP (glial fibrillary acidic protein) immunohistochemistry of the caudate nucleus subependymal region (10x magnification, scale bar 200 μm) (e) CD3 immunohistochemistry of the caudate nucleus subependymal region (10x magnification, scale bar 200 μm) (f) BCMA immunohistochemistry of the caudate nucleus subependymal region (10x magnification, scale bar 200 μm, inset 40x magnification showing a neuron staining positively). (c-f) Images shown are representative slides from the caudate nucleus from the patient described in this case report (N=1). For each stain, at least 3 slides were available showing similar results.

References

    1. Kumar SK, et al. Multiple myeloma. Nat Rev Dis Primers 3, 17046 (2017). - PubMed
    1. Madduri D, Dhodapkar MV, Lonial S, Jagannath S & Cho HJ SOHO State of the Art Updates and Next Questions: T-Cell-Directed Immune Therapies for Multiple Myeloma: Chimeric Antigen Receptor-Modified T Cells and Bispecific T-Cell-Engaging Agents. Clin Lymphoma Myeloma Leuk 19, 537–544 (2019). - PubMed
    1. Shah N, Chari A, Scott E, Mezzi K & Usmani SZ B-cell maturation antigen (BCMA) in multiple myeloma: rationale for targeting and current therapeutic approaches. Leukemia (2020). - PMC - PubMed
    1. Shah UA & Mailankody S Emerging immunotherapies in multiple myeloma. BMJ 370, m3176 (2020). - PubMed
    1. Bu DX, et al. Pre-clinical validation of B cell maturation antigen (BCMA) as a target for T cell immunotherapy of multiple myeloma. Oncotarget 9, 25764–25780 (2018). - PMC - PubMed

METHODS-ONLY REFERENCES

    1. Kotecha N, Krutzik PO & Irish JM Web-based analysis and publication of flow cytometry experiments. Current protocols in cytometry Chapter 10, Unit10.17 (2010). - PMC - PubMed
    1. Kolde R pheatmap: Pretty Heatmaps. R package version 1.0.12 (2019).
    1. Wickham H ggplot2: Elegant Graphics for Data Analysis, (Springer-Verlag; New York, 2016).
    1. Zunder ER, et al. Palladium-based mass tag cell barcoding with a doublet-filtering scheme and single-cell deconvolution algorithm. Nat Protoc 10, 316–333 (2015). - PMC - PubMed
    1. Nowicka M, et al. CyTOF workflow: differential discovery in high-throughput high-dimensional cytometry datasets. F1000Res 6, 748 (2017). - PMC - PubMed

Publication types

MeSH terms

Substances

Associated data