. 2021 Dec;27(12):2176-2182.
doi: 10.1038/s41591-021-01595-0. Epub 2021 Dec 10.

Underdiagnosis bias of artificial intelligence algorithms applied to chest radiographs in under-served patient populations

Affiliations

Underdiagnosis bias of artificial intelligence algorithms applied to chest radiographs in under-served patient populations

Laleh Seyyed-Kalantari et al. Nat Med. 2021 Dec.

Abstract

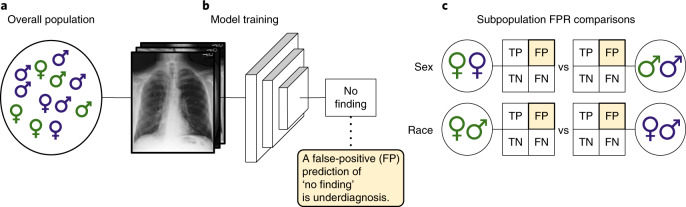
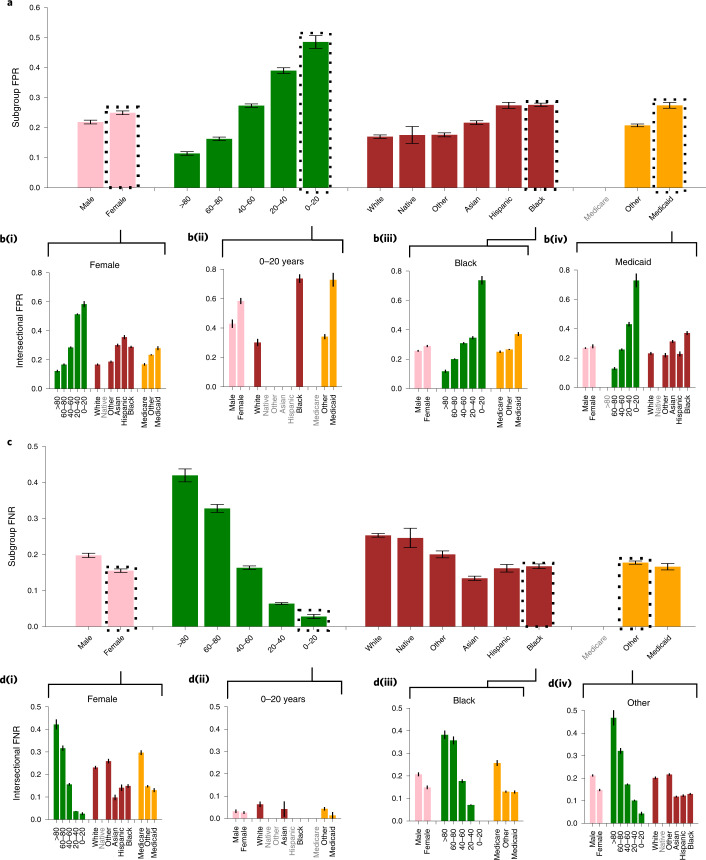
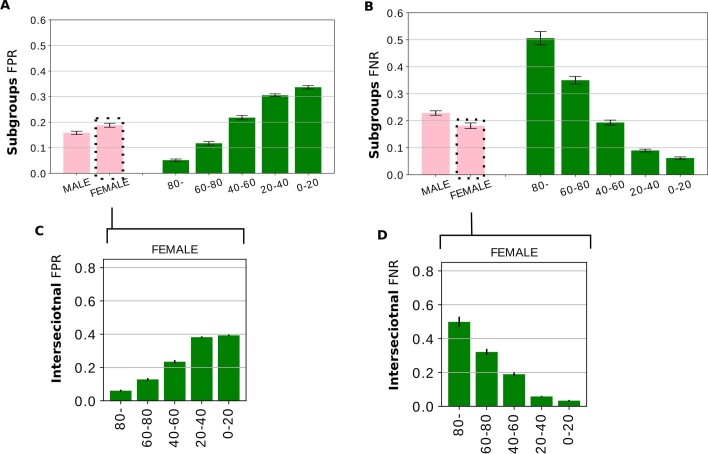
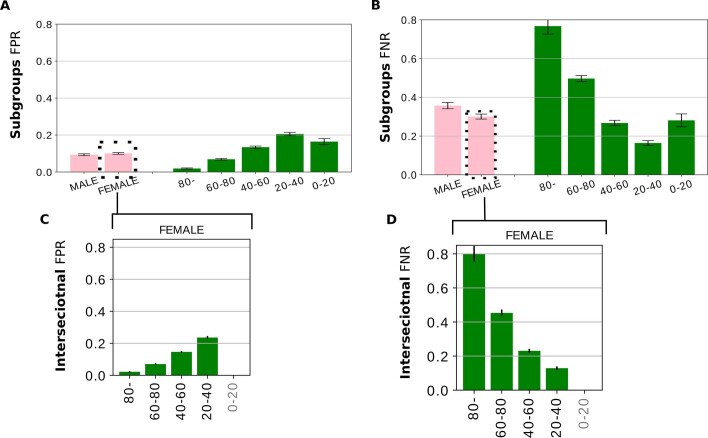
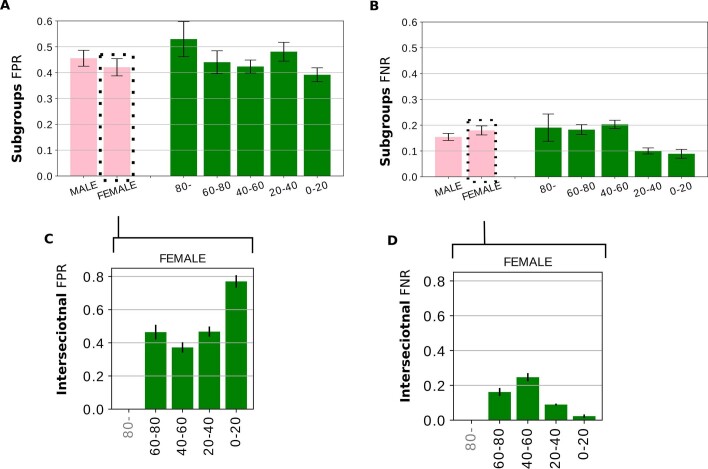
Artificial intelligence (AI) systems have increasingly achieved expert-level performance in medical imaging applications. However, there is growing concern that such AI systems may reflect and amplify human bias, and reduce the quality of their performance in historically under-served populations such as female patients, Black patients, or patients of low socioeconomic status. Such biases are especially troubling in the context of underdiagnosis, whereby the AI algorithm would inaccurately label an individual with a disease as healthy, potentially delaying access to care. Here, we examine algorithmic underdiagnosis in chest X-ray pathology classification across three large chest X-ray datasets, as well as one multi-source dataset. We find that classifiers produced using state-of-the-art computer vision techniques consistently and selectively underdiagnosed under-served patient populations and that the underdiagnosis rate was higher for intersectional under-served subpopulations, for example, Hispanic female patients. Deployment of AI systems using medical imaging for disease diagnosis with such biases risks exacerbation of existing care biases and can potentially lead to unequal access to medical treatment, thereby raising ethical concerns for the use of these models in the clinic.


Conflict of interest statement

The authors declare no competing interests.

Figures

Fig. 1
Fig. 1. The model pipeline.
a, We examine chest radiographs across several datasets with diverse populations. b, A deep learning model is then trained from these data (training across all patients simultaneously) to predict the presence of the no finding label, which indicates that the algorithm did not detect disease for the image. c, The underdiagnosis rate (that is, the false-positive rate (FP) of the no finding label) of this model is then compared in different subpopulations (including sex, race/ethnicity, age and insurance type) to examine the algorithm’s underdiagnosis rate. FN, false negative; TN, true negative; TP, true positive. Symbol colors indicate different races of male and female patients.
Fig. 2
Fig. 2. Analysis of underdiagnosis across subgroups of sex, age, race/ethnicity and insurance type in the MIMIC-CXR (CXR) dataset.
a, The underdiagnosis rate, as measured by the no finding FPR, in the indicated patient subpopulations. b, Intersectional underdiagnosis rates for female patients (b(i)), patients aged 0–20 years (b(ii)), Black patients (b(iii)), and patients with Medicaid (b(iv)). c,d, The overdiagnosis rate, as measured by the no finding FNR in the same patient subpopulations as in a and b. The results are averaged over five trained models with different random seeds on the same train–validation–test splits. 95% confidence intervals are shown. Subgroups with too few members to be studied reliably (≤15) are labeled in gray text and the results for these subgroups are omitted. Data for the Medicare subgroup are also omitted, given that data for this subgroup are highly confounded by patient age.
Extended Data Fig. 1
Extended Data Fig. 1. Analyzing underdiagnoses over subgroups of sex, age, within ALL dataset (combined CXR, CXP and NIH dataset on shared labels).
Fig. S1. Analyzing underdiagnoses over subgroups of sex, age, within ALL dataset (combined CXR, CXP and NIH dataset on shared labels). The results are averaged over 5 trained model with different random seed ± 95% confidence interval (CI). A. The underdiagnosis rate (measured by ‘No Finding’ FPR). B. The overdiagnosis rate (‘No Finding’ False Negative Rate (FNR)) over subgroups of sex, age. C. The intersectional underdiagnosis rates within only female patients. D. Examining the overdiagnosis rate for the intersectional identities. The number of images with actual 0 or 1 ‘No Finding’ label in the age - sex intersections in the test dataset is presented in Supplementary Table 1.
Extended Data Fig. 2
Extended Data Fig. 2. Analyzing underdiagnoses over subgroups of sex, age, within CheXpert (CXP) dataset.
Fig. S2. Analyzing underdiagnoses over subgroups of sex, age, within CheXpert (CXP) dataset. The results are averaged over 5 trained model with different random seed ± 95% CI. A. The underdiagnosis rate is FPR in ‘No Finding’. B. Examining the overdiagnosis rate (‘No Finding’ FNR) over sex and age subgroups, C. The intersectional underdiagnosis rates within only female patients, and D. measure the overdiagnosis rate for the intersectional identities. The subgroups labeled in gray text, with results omitted, indicate the subgroup has too few members (<= 15) to be used reliably. The number of images with actual 0 or 1 ‘No Finding’ label in the age - sex intersections in the test dataset is presented in Supplementary Table 1.
Extended Data Fig. 3
Extended Data Fig. 3. Analyzing underdiagnoses over subgroups of sex, age, within ChestX-ray14 (NIH) dataset.
Fig. S3. Analyzing underdiagnoses over subgroups of sex, age, within ChestX-ray14 (NIH) dataset. The results are averaged over 5 trained model with different random seed ± 95% confidence interval (CI). A. The underdiagnosis rate (‘No Finding’ FPR). B. The over diagnosis rate (‘No Finding’ FNR) over subgroups of sex and age. C. The intersectional underdiagnosis rates within only female patients. D. The over diagnosis rate for the intersectional identities. The subgroups labeled in gray text, with results omitted, indicate the subgroup has too few members (<= 15) to be used reliably. The number of images with actual 0 or 1 ‘No Finding’ label in the age - sex intersections in the test dataset is presented in Supplementary Table 1.

Comment in

References

    1. Raghavan, M., Barocas, S., Kleinberg, J. & Levy, K. Mitigating bias in algorithmic hiring: evaluating claims and practices. In FAT* ’20: Proceedings of the 2020 Conference on Fairness, Accountability, and Transparency 469–481 (Association for Computing Machinery, 2020).
    1. Wiens J, et al. Do no harm: a roadmap for responsible machine learning for health care. Nat. Med. 2019;25:1337–1340. doi: 10.1038/s41591-019-0548-6. - DOI - PubMed
    1. Char DS, Eisenstein LG, Jones DS. Implementing machine learning in health care: addressing ethical challenges. N. Engl. J. Med. 2018;378:981–983. doi: 10.1056/NEJMp1714229. - DOI - PMC - PubMed
    1. Chen IY, Joshi S, Ghassemi M. Treating health disparities with artificial intelligence. Nat. Med. 2020;26:16–17. doi: 10.1038/s41591-019-0649-2. - DOI - PubMed
    1. Obermeyer Z, Powers B, Vogeli C, Mullainathan S. Dissecting racial bias in an algorithm used to manage the health of populations. Science. 2019;366:447–453. doi: 10.1126/science.aax2342. - DOI - PubMed

Publication types