. 2022 Feb 3;39(2):msab353.
doi: 10.1093/molbev/msab353.

Whole-Genome Resequencing of Worldwide Wild and Domestic Sheep Elucidates Genetic Diversity, Introgression, and Agronomically Important Loci

Affiliations

Whole-Genome Resequencing of Worldwide Wild and Domestic Sheep Elucidates Genetic Diversity, Introgression, and Agronomically Important Loci

Feng-Hua Lv et al. Mol Biol Evol. .

Abstract

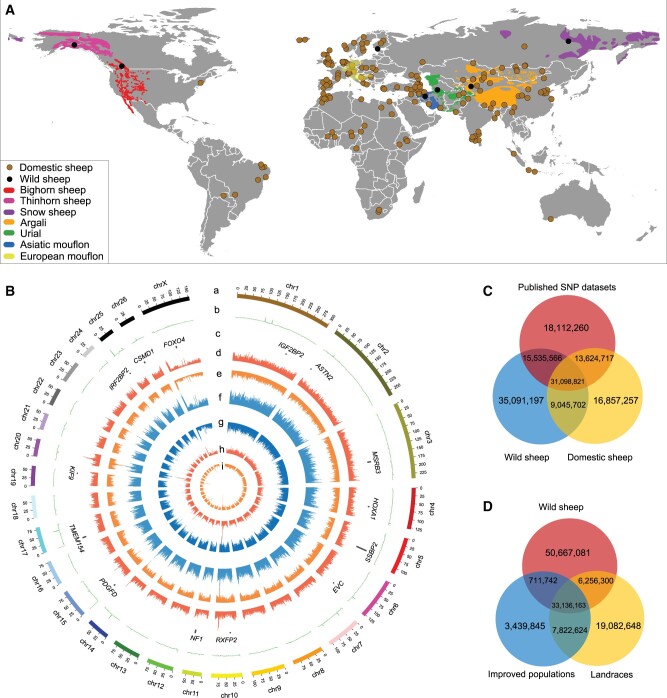
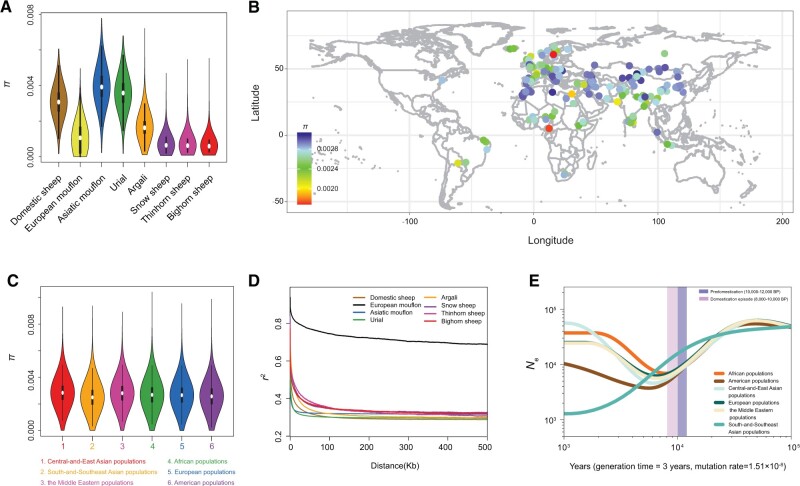
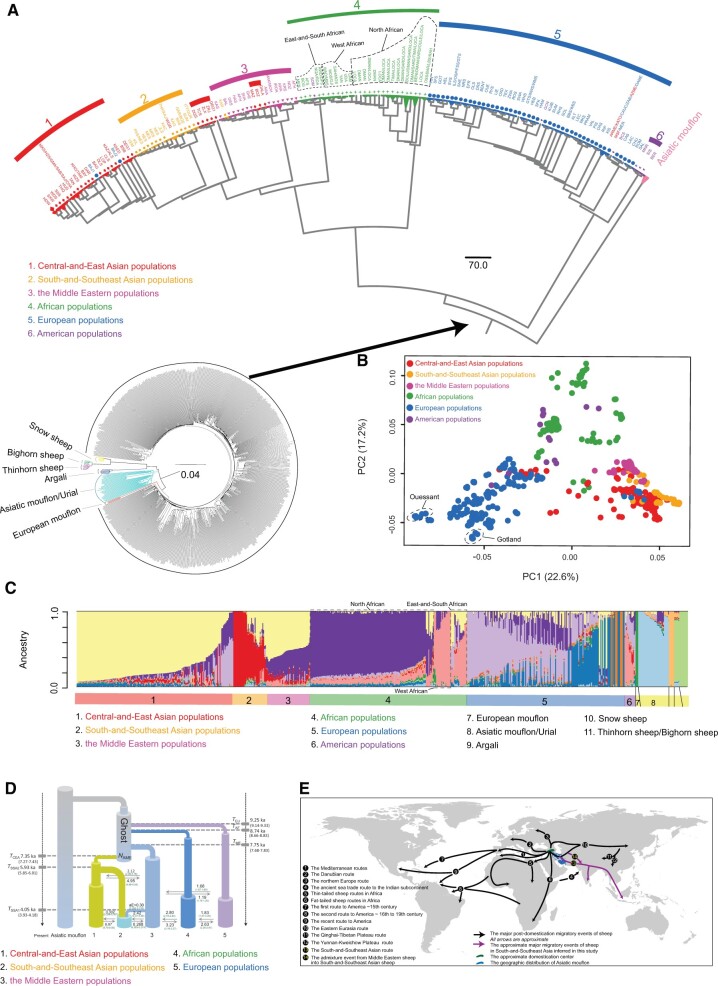
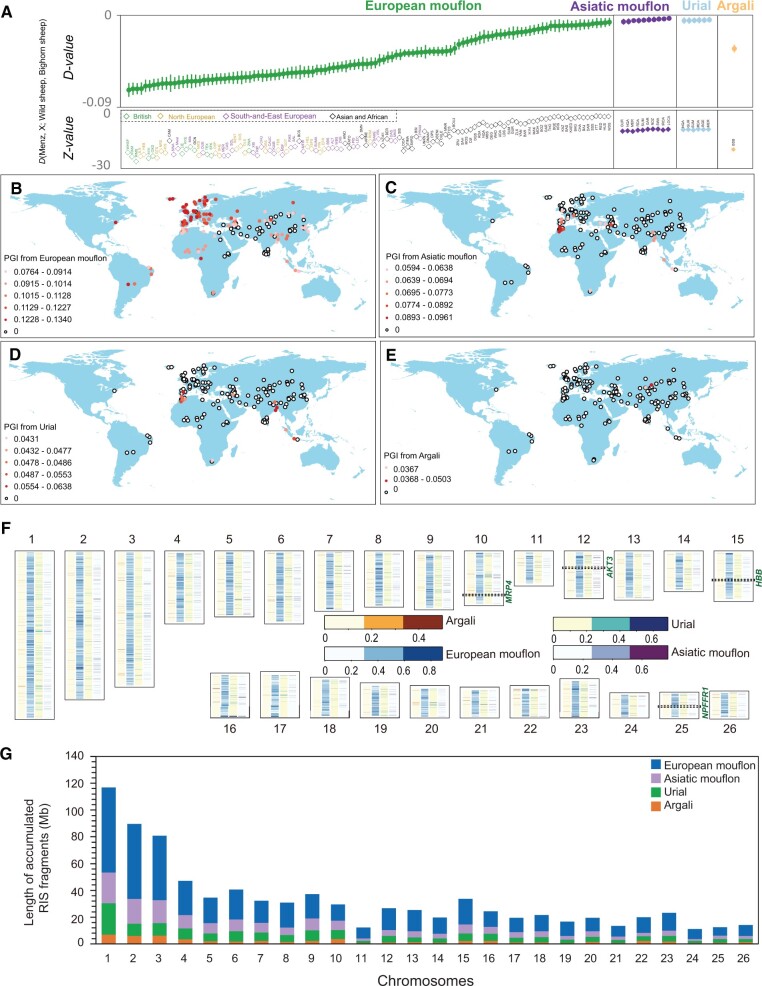
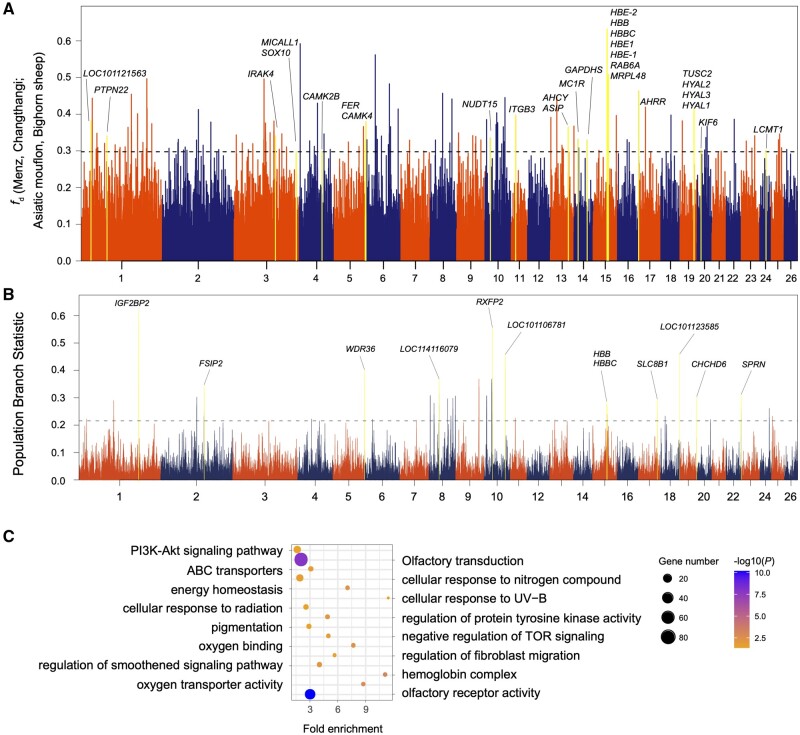
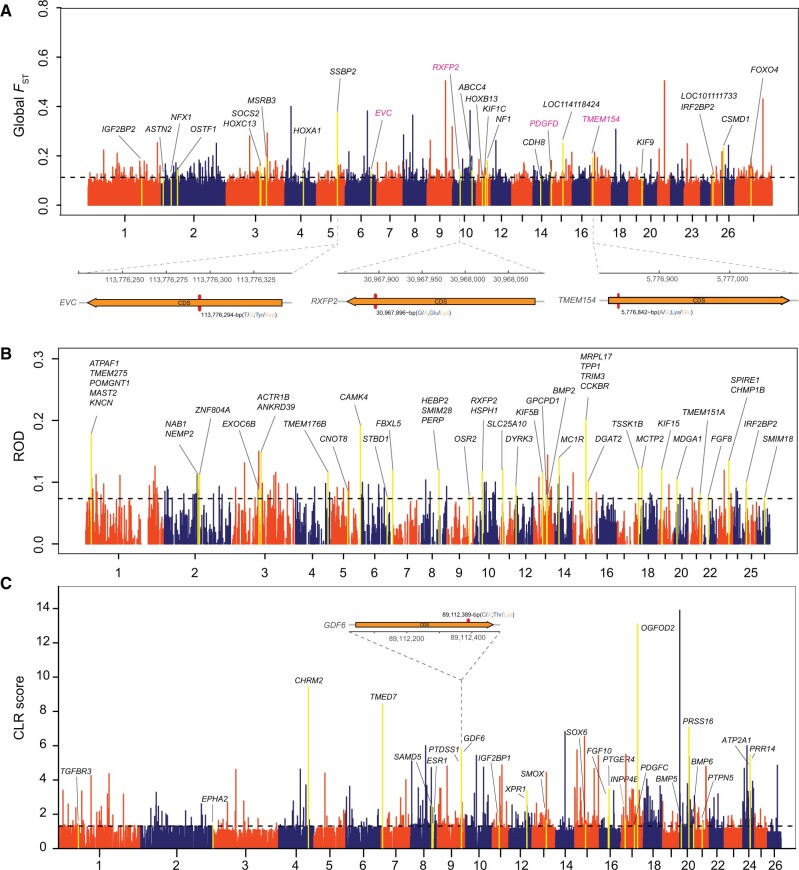
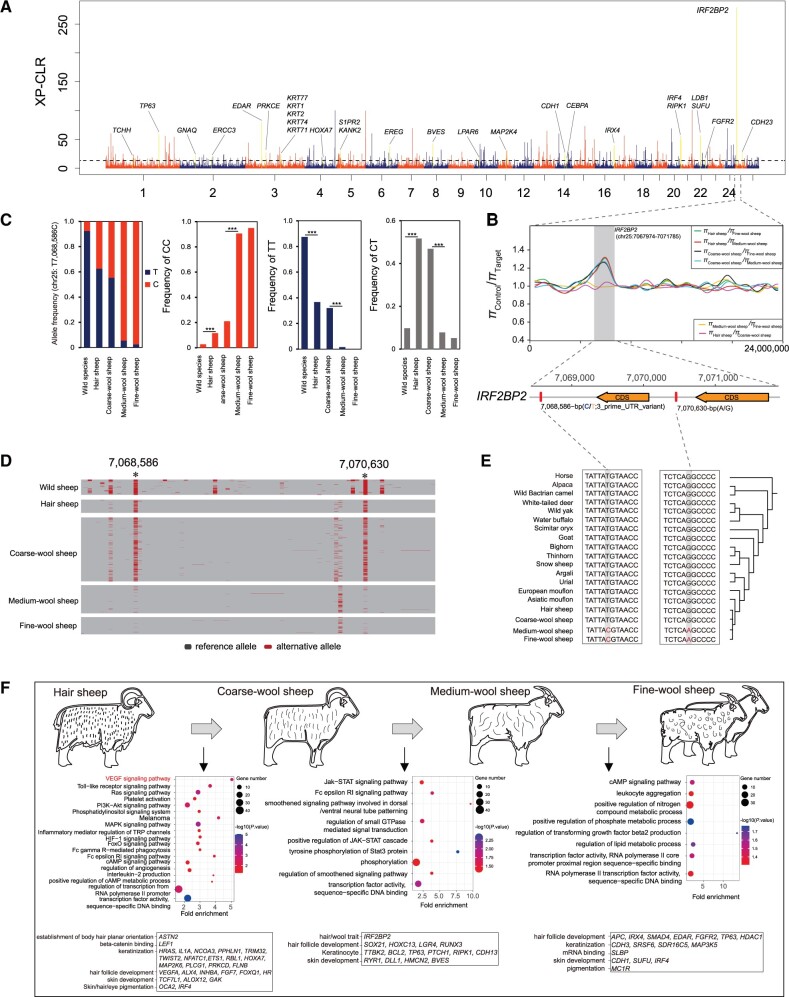
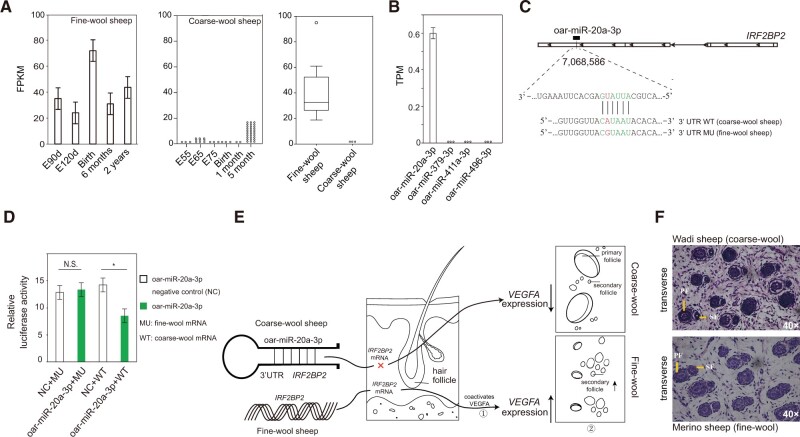
Domestic sheep and their wild relatives harbor substantial genetic variants that can form the backbone of molecular breeding, but their genome landscapes remain understudied. Here, we present a comprehensive genome resource for wild ovine species, landraces and improved breeds of domestic sheep, comprising high-coverage (∼16.10×) whole genomes of 810 samples from 7 wild species and 158 diverse domestic populations. We detected, in total, ∼121.2 million single nucleotide polymorphisms, ∼61 million of which are novel. Some display significant (P < 0.001) differences in frequency between wild and domestic species, or are private to continent-wide or individual sheep populations. Retained or introgressed wild gene variants in domestic populations have contributed to local adaptation, such as the variation in the HBB associated with plateau adaptation. We identified novel and previously reported targets of selection on morphological and agronomic traits such as stature, horn, tail configuration, and wool fineness. We explored the genetic basis of wool fineness and unveiled a novel mutation (chr25: T7,068,586C) in the 3'-UTR of IRF2BP2 as plausible causal variant for fleece fiber diameter. We reconstructed prehistorical migrations from the Near Eastern domestication center to South-and-Southeast Asia and found two main waves of migrations across the Eurasian Steppe and the Iranian Plateau in the Early and Late Bronze Ages. Our findings refine our understanding of genome variation as shaped by continental migrations, introgression, adaptation, and selection of sheep.

Keywords: adaptive introgression; agronomic traits; genetic diversity; genetic selection; migration; whole-genome sequences.


Figures

Fig. 1.
Fig. 1.
Geographic distributions and genetic variants of wild and domestic sheep. (A) Sampling locations of 158 domestic sheep populations, and geographic distribution ranges and sampling locations of the seven wild sheep species. The brown and black dots indicate the sampling locations of domestic and wild sheep. The geographic distribution range of each wild sheep species is shown on the map with different colors as follows: Ovis musimon (yellow), O. orientalis (blue), O. vignei (green), O. ammon (orange), O. nivicola (purple), O. dalli (pink), and O canadensis (red). All European mouflon populations in wild parks of Europe have been imported recently from Coasica and Sardinia. (B) Diagram of SNPs found by resequencing of 734 individuals. Circles represent from outermost to innermost, 27 chromosomes (chr. 1–26, X) denoted by different colors (a), average sequence depth for 810 individuals (b), candidate genes selection based on the top 1% values of global FST (c), SNP abundance bars in improved populations (d) and landraces (e), nucleotide diversity (π) abundance bars in improved populations (f) and landraces (g), and INDEL abundance bars in improved populations (h) and landraces (i). (C) Venn diagrams for novel variants detected in wild and domestic sheep. (D) Venn diagrams for variants shared among wild sheep species and improved populations and landraces of domestic sheep.
Fig. 2.
Fig. 2.
Genetic variability of wild and domestic sheep. (A) Average nucleotide diversity (π) of eight wild and domestic sheep species. (B) Nucleotide diversity (π) of 158 domestic populations across the world. (C) Average nucleotide diversity (π) of six geographic groups of domestic sheep populations. (D) Decay of LD for eight wild and domestic sheep species, with one line per species. (E) Effective population sizes (Ne) for six domestic sheep populations inferred using SMC++, with one line per population. A generation time of 3 years and mutation rate of 1.51 × 10⁻⁸ per site per generation were used to convert coalescent scaling to calendar time.
Fig. 3.
Fig. 3.
Population genetic structure of wild and domestic sheep and the demographic history. (A) Neighbor-joining (NJ) trees of wild and domestic sheep based on whole-genome SNPs using the identity-by-state (IBS) genetic distances implemented in PLINK v1.90 (Purcell et al. 2007). BAJ1 and BAJ2 are from the population BAJ, and DEG1 and DEG2 are from the population DEG. (B) PCA of domestic sheep populations. (C) Population genetic structure of wild and domestic sheep inferred from the sNMF analyses (K = 11) using whole-genome SNP data. (D) Demographic history reconstruction of domestic sheep. The best-supported demographic model of South-and-Southeast Asian population: South-and-Southeast sheep diverged from Central-and-East Asian population ∼5.93 ka and was later admixed by the Middle Eastern population ∼2.42 ka. The Middle Eastern population contributed ∼30% of their gene pool to the South-and-Southeast Asian population. Dates of events (ka) are indicated on the left and right, and estimated migration rates (migrants per generation) are scaled by the effective population size were given above/below the corresponding arrows. The 95% confidence intervals (CIs) are shown in parentheses. (E) Major sheep migrations across the world. (1) The Mediterranean routes (Ryder 1984), (2) the Danubian route (Ryder 1984), (3) the northern Europe route (Tapio et al. 2006), (4) the ancient sea trade route to the Indian subcontinent (Singh et al. 2013), (5) thin-tailed sheep routes in Africa (Muigai and Hanotte 2013), (6) fat-tailed sheep routes in Africa (Muigai and Hanotte 2013), (7) the first route to America ∼15th century (Dunmire 2013), (8) the second route to America ∼16th to 19th century (Spangler et al. 2017), (9) the recent route to America (Ryder 1984), (10) the Eastern Eurasia route (Lv et al. 2015), (11) the Qinghai-Tibet Plateau route (Zhao et al. 2017; Hu et al. 2019), (12) the Yunnan-Kweichow Plateau route (Zhao et al. 2017; Hu et al. 2019), (13) the South-and-Southeastern Asia route (this study), and (14) the admixture event from Middle Eastern sheep into South-and-Southeastern Asian sheep (this study).
Fig. 4.
Fig. 4.
Genetic introgression of wild sheep species in domestic populations. (A) D statistic tests in the form (Menz sheep, X, wild sheep, Bighorn sheep) where wild sheep indicates European mouflon, Asiatic mouflon, urial, or argali, respectively. X indicate a candidate domestic population. Introgressions from European mouflon into British, North European, Southwest-and-East European, and Asian, and African populations are indicated by green, gold, purple, and black color, respectively. (B, C, D, E) The PGI across the whole genome of each wild sheep species in worldwide domestic populations. The levels of PGI from European mouflon, Asiatic mouflon, urial, and argali are mapped based on the results of fd statistics: fd (Menz sheep, X, European mouflon, Bighorn sheep), fd (Menz sheep, X, Asiatic mouflon, Bighorn sheep), fd (Menz sheep, X, Urial, Bighorn sheep), and fd (Menz sheep, X, Argali, Bighorn sheep), separately. X indicates a candidate domestic population. PGI can be estimated with the equation: PGI =(Σfdi×Gi)/G, where fdi and Gi refer to the fd value and the window size in base pairs for the ith window, and G is the genome size in base pairs (Zhou et al. 2020). (F) RIS of wild sheep species in domestic sheep on each chromosome. Colored heatmaps of blue, red, purple, and gray show the abundance of genomic regions containing RIS from the four wild sheep species based on fd statistics (Argali, Asiatic mouflon, Urial, and European mouflon). The genes with the most significant signals of introgression are highlighted. (G) Length of accumulated RIS from the four wild sheep species (Argali, Asiatic mouflon, Urial, and European mouflon) in domestic sheep.
Fig. 5.
Fig. 5.
Signals of introgression and selection in the Changthangi sheep. (A) Manhattan plot showing the introgression signal from Asiatic mouflon to Changthangi sheep. The locations of the HBB, HBE2, HBBC, HBE1, RAB6A, and MRPL48 genes are shown by the highest fd value. (B) Signals of selection in the Changthangi sheep detected by the PBS (Yi et al. 2010). PBS values in windows of 100 kb and names of genes associated with the highest peaks are shown. (C) GO and KEGG pathway enrichment analysis based on genes across significant introgressed regions from wild species to Changthangi sheep. The dot size shows the gene count enriched in the pathway, and the dot color shows adjusted significance value of the enriched pathways.
Fig. 6.
Fig. 6.
Genome-wide selective signals across all the domestic sheep populations based on global FST and ROD, and associated with the stature (i.e., body size) phenotype. (A) Genome-wide distribution of global FST across all the 158 domestic sheep populations. (B) Candidate selective genomic regions based on ROD analysis. (C) Manhattan plot for the dwarf (i.e., small body size) phenotype showing the CLR score distribution in the Ouessant sheep population. Genes within regions with significant outlier scores are highlighted.
Fig. 7.
Fig. 7.
Genomic evolution of hair/coarse-wool/medium-wool/fine-wool sheep. (A) Whole-genome selective signals between fine-wool and hairy populations of domestic sheep by the cross-population composite likelihood ratio (XP-CLR) test. (B) Six comparisons of π ratio (πHair sheepCoarse-wool sheep, πHair sheepMedium-wool sheep, πHair sheepFine-wool sheep, πCoarse-wool sheepMedium-wool sheep, πCoarse-wool sheepFine-wool sheep and πMedium-wool sheepFine-wool sheep) indicates strong selective signal in IRF2BP2 gene. (C) Allele frequency of the mutation site and frequencies of genotypes CC, TT, and CT in 3′-UTR of IRF2BP2 (chr25: T7,068,586C), and significance of the genotype difference is tested. (D) Haplotype pattern of IRF2BP2 among wild sheep, hairy, coarse-wool, medium-wool, and fine-wool populations of domestic sheep. (E) Sequence comparison among different species at mutations chr25: 7,068,586, and chr25: 7,070,630. (F) GO and KEGG pathway enrichment analyses, with the significant (P < 0.05) GO terms and pathways and associated genes shown.
Fig. 8.
Fig. 8.
Histological analysis, mRNA, and miRNA expressions and genetic mechanisms for the gene IRF2BP2 and oar-miR-20a-3p involved in the fleece fiber variation in domestic sheep. (A) Expressions of IRF2BP2 in embryonic developmental stages and 2 years old of fine-wool (left), coarse-wool sheep (medium) and boxplot of FPKM distribution between fine-wool and coarse-wool sheep (right). (B) Expressions of miRNAs in coarse-wool sheep (Hu sheep) normalized by reads per million reads mapped to miRNAs (RPM). (C) Putative binding sites for oar-miR-20a-3p to the 3′-UTR of IRF2BP2. (D) Dual-luciferase reporter assays, *P < 0.05 (t-test); N.S., not significant. (E) Proposed genetic mechanisms for IRF2BP2 and oar-miR-20a-3p involved in the fleece fiber variation in domestic sheep. ①Ho et al. (2012) and ②Zhang et al. (2018). (F) Histological transverse section of skin in Chinese Merino (fine wool, at embryonic 85 days) and Wadi sheep (coarse wool, at embryonic 90 days); PF, primary wool follicle; SF, secondary wool follicle.

References

    1. Agarwal V, Bell GW, Nam JW, Bartel DP.. 2015. Predicting effective microRNA target sites in mammalian mRNAs. eLife 4:e05005. - PMC - PubMed
    1. Ai H, Fang X, Yang B, Huang Z, Chen H, Mao L, Zhang F, Zhang L, Cui L, He W, et al.2015. Adaptation and possible ancient interspecies introgression in pigs identified by whole-genome sequencing. Nat Genet. 47(3):217–225. - PubMed
    1. Alberto FJ, Boyer F, Orozco-terWengel P, Streeter I, Servin B, de Villemereuil P, Benjelloun B, Librado P, Biscarini F, Colli L, et al.2018. Convergent genomic signatures of domestication in sheep and goats. Nat Commun. 9(1):813. - PMC - PubMed
    1. Aldersey JE, Sonstegard TS, Williams JL, Bottema CDK.. 2020. Understanding the effects of the bovine POLLED variants. Anim Genet. 51(2):166–176. - PubMed
    1. Barbato M, Hailer F, Orozco-terWengel P, Kijas J, Mereu P, Cabras P, Mazza R, Pirastru M, Bruford MW.. 2017. Genomic signatures of adaptive introgression from European mouflon into domestic sheep. Sci Rep. 7(1):7623. - PMC - PubMed

Publication types

LinkOut - more resources