. 2022 Jan 7;39(1):msab340.
doi: 10.1093/molbev/msab340.

Island Biogeography Revisited: Museomics Reveals Affinities of Shelf Island Birds Determined by Bathymetry and Paleo-Rivers, Not by Distance to Mainland

Affiliations

Island Biogeography Revisited: Museomics Reveals Affinities of Shelf Island Birds Determined by Bathymetry and Paleo-Rivers, Not by Distance to Mainland

Kritika M Garg et al. Mol Biol Evol. .

Abstract

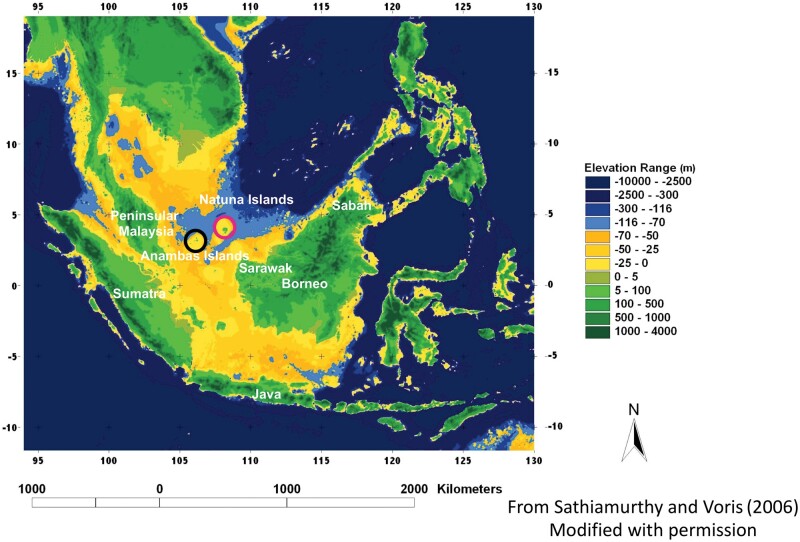
Island biogeography is one of the most powerful subdisciplines of ecology: its mathematical predictions that island size and distance to mainland determine diversity have withstood the test of time. A key question is whether these predictions follow at a population-genomic level. Using rigorous ancient-DNA protocols, we retrieved approximately 1,000 genomic markers from approximately 100 historic specimens of two Southeast Asian songbird complexes from across the Sunda Shelf archipelago collected 1893-1957. We show that the genetic affinities of populations on small shelf islands defy the predictions of geographic distance and appear governed by Earth-historic factors including the position of terrestrial barriers (paleo-rivers) and persistence of corridors (Quaternary land bridges). Our analyses suggest that classic island-biogeographic predictors may not hold well for population-genomic dynamics on the thousands of shelf islands across the globe, which are exposed to dynamic changes in land distribution during Quaternary climate change.

Keywords: Quaternary glacial cycles; Sundaland; ancient DNA; babblers; paleorivers.


Figures

Fig. 1.
Fig. 1.
Map showing Sundaland and sea depths across the Sunda Shelf. Note that land would have extended approximately to the −116 m isobath (border between light-blue and midblue) at the peak of glacial episodes.
Fig. 2.
Fig. 2.
Population subdivision observed in Pellorneum capistratum based on transversions isolated after mapping to the Parus major genome. Three population clusters observed based on (A) principal component analysis (number of transversions=10,848), (B) discriminant analysis (DA) of principal components, in which clusters are color coded based on population affinity (number of transversions=38,463), (C) genetic assignment of P. capistratum individuals using STRUCTURE for K = 2 to K = 6 (number of transversions=38,463).
Fig. 3.
Fig. 3.
Population subdivision observed in Pellorneum malaccense based on transversions isolated after mapping to the Parus major genome. Three population clusters observed based on (A) principal component analysis (number of transversions=6,091), (B) discriminant analysis (DA) of principal components, in which clusters are color coded based on population affinity (number of transversions=32,735), (C) genetic assignment of P. malaccense individuals using STRUCTURE for K = 2 to K = 6 (number of transversions=32,735).
Fig. 4.
Fig. 4.
Admixture graph of gene flow dynamics observed in Pellorneum capistratum. (A) Schematic of genetic ancestry and admixture proportions among populations of P. capistratum based on a combination of five best-fit admixture graphs, all of which exhibited an identical topology and only differed slightly in estimates of the extent of admixture from an unknown source for the western Sundaic population; (B) map during sea level recession of approximately 120 m at glacial maximum around 20,000 years before present, showing major paleo-rivers and present-day taxon distributions; (C) current map of South East Asia with taxon distributions, major rivers, and arrows indicating potential gene flow from unsampled or extinct populations (see A). The black-stippled line indicates potential habitat during sea level lows. Panels (B) and (C) modified with permission from Voris (2000).
Fig. 5.
Fig. 5.
Admixture graph of gene flow dynamics observed in Pellorneum malaccense. (A) Schematic of genetic ancestry and admixture proportions among populations of P. malaccense based on single best-fit admixture graph; (B) map during sea level recession of approximately 120 m at glacial maximum around 20,000 years before present, showing major paleo-rivers and present-day taxon distributions; (C) current map of South East Asia with taxon distributions, major rivers, and arrows indicating potential gene flow among populations or from unsampled or extinct populations (see A). The black-stippled line indicates potential habitat during sea level lows. Panels (B) and (C) modified with permission from Voris (2000).

References

    1. Andrews S. 2010. FastQC: a quality control tool for high throughput sequence data. Available from: https://www.bioinformatics.babraham.ac.uk/projects/fastqc/.
    1. Bird MI, Taylor D, Hunt C.. 2005. Palaeoenvironments of insular Southeast Asia during the Last Glacial Period: a savanna corridor in Sundaland? Quat Sci Rev. 24(20–21):2228–2242.
    1. Bolger AM, Lohse M, Usadel B.. 2014. Trimmomatic: a flexible trimmer for Illumina sequence data. Bioinformatics 30(15):2114–2120. - PMC - PubMed
    1. Borowiec ML. 2016. AMAS: a fast tool for alignment manipulation and computing of summary statistics. PeerJ 4:e1660. - PMC - PubMed
    1. Borregaard MK, Matthews TJ, Whittaker RJ, Field R.. 2016. The general dynamic model: towards a unified theory of island biogeography? Glob Ecol Biogeogr. 25(7):805–816.

Publication types