. 2022 Jan 11;50(1):17-34.
doi: 10.1093/nar/gkab1199.

Palmitic acid conjugation enhances potency of tricyclo-DNA splice switching oligonucleotides

Affiliations

Palmitic acid conjugation enhances potency of tricyclo-DNA splice switching oligonucleotides

Karima Relizani et al. Nucleic Acids Res. .

Abstract

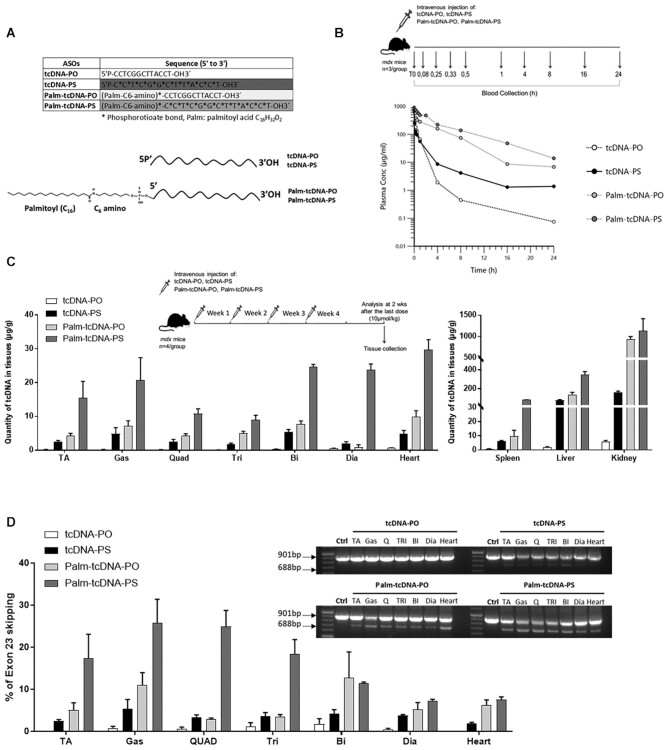
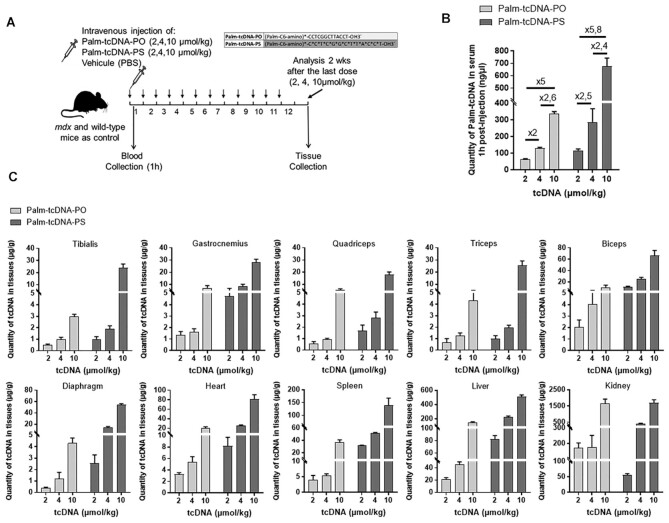
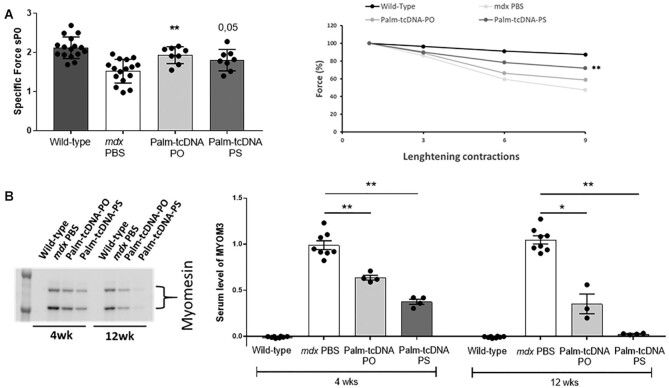
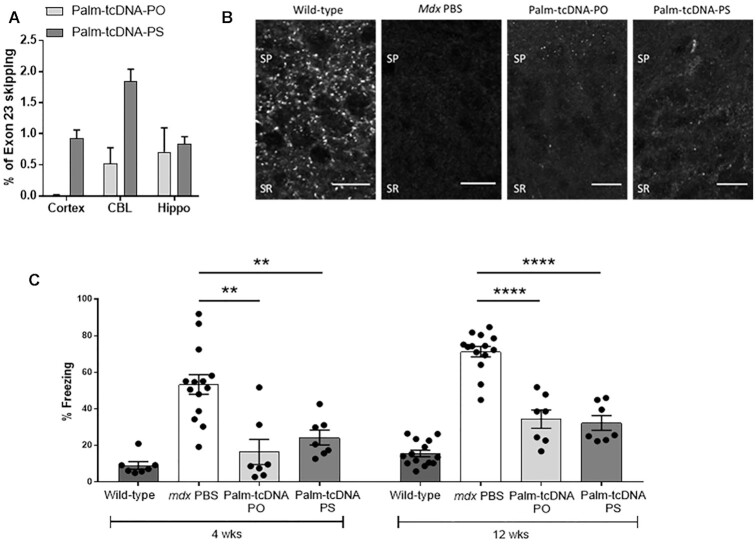
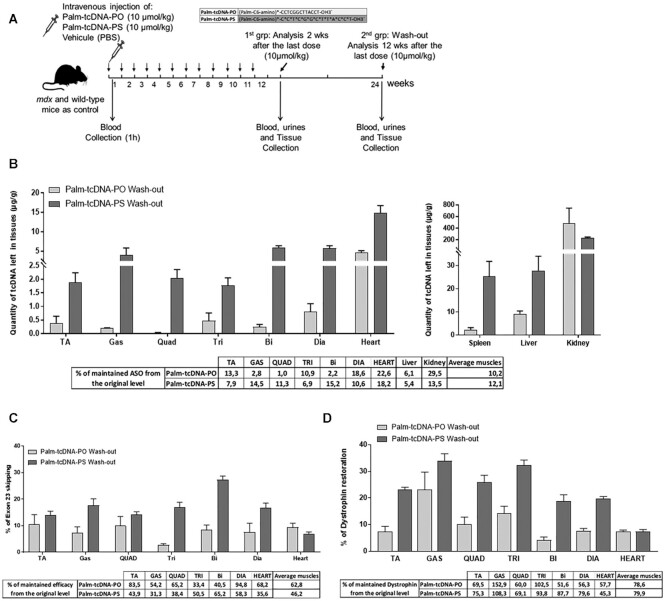
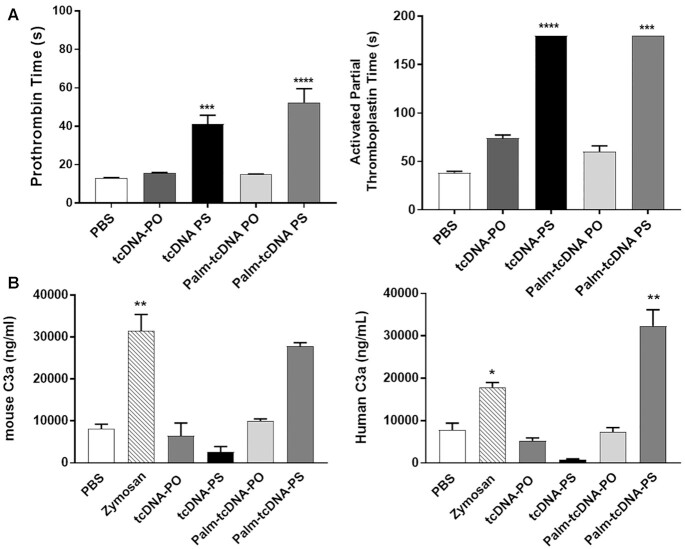
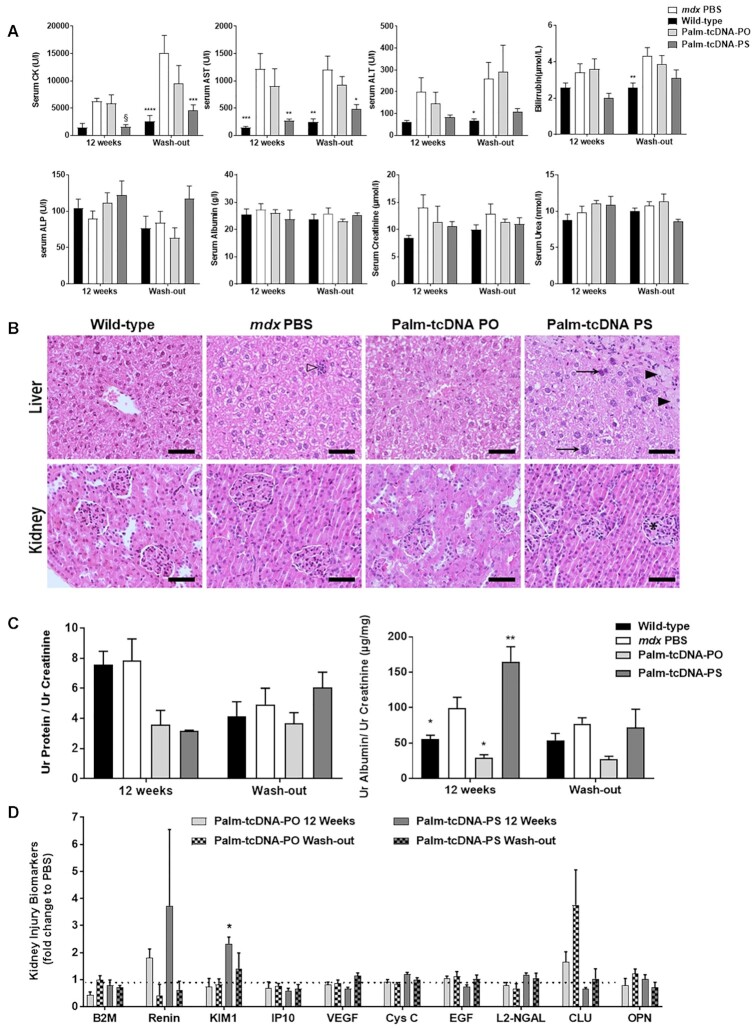
Tricyclo-DNA (tcDNA) is a conformationally constrained oligonucleotide analog that has demonstrated great therapeutic potential as antisense oligonucleotide (ASO) for several diseases. Like most ASOs in clinical development, tcDNA were modified with phosphorothioate (PS) backbone for therapeutic purposes in order to improve their biodistribution by enhancing association with plasma and cell protein. Despite the advantageous protein binding properties, systemic delivery of PS-ASO remains limited and PS modifications can result in dose limiting toxicities in the clinic. Improving extra-hepatic delivery of ASO is highly desirable for the treatment of a variety of diseases including neuromuscular disorders such as Duchenne muscular dystrophy. We hypothesized that conjugation of palmitic acid to tcDNA could facilitate the delivery of the ASO from the bloodstream to the interstitium of the muscle tissues. We demonstrate here that palmitic acid conjugation enhances the potency of tcDNA-ASO in skeletal and cardiac muscles, leading to functional improvement in dystrophic mice with significantly reduced dose of administered ASO. Interestingly, palmitic acid-conjugated tcDNA with a full phosphodiester backbone proved effective with a particularly encouraging safety profile, offering new perspectives for the clinical development of PS-free tcDNA-ASO for neuromuscular diseases.


Figures

Figure 1.
Figure 1.
Palmitic acid conjugation enhances the biodistribution and efficacy of tcDNA-ASO. (A) Sequences of the different tcDNA-ASOs and schematic design representing the conjugation of the palmitic acid at the 5’ end of tcDNA (tcDNA-PO, tcDNA-PS) using a C6-amino linker and a PS bond. (B) Experimental pharmacokinetics protocol (upper panel): mdx mice received a single intravenous dose of 10 μmol/kg of unconjugated (tcDNA-PO or tcDNA-PS) or conjugated tcDNA (palm-tcDNA-PO or palm-tcDNA-PS) and blood samples were collected at different time points (t = 0, 0.08 h (i.e. 5 min), 0.33 h (i.e. 15 min), 0.5 h (i.e. 30 min), 1, 4, 8, 16 and 24 h) after the administration. Semi-log plots of serum concentration of each tcDNA-ASO versus time from mice treated with 10 μmol/kg of unconjugated (tcDNA-PO or tcDNA-PS) or conjugated tcDNA (palm-tcDNA-PO or palm-tcDNA-PS). Data are represented as mean, n = 3/time point). (C) Quantification of tcDNA-ASO content in various tissues by fluorescent hybridization assay following a 4-week treatment at the dose of 10 μmol/kg/week. D) Detection of exon 23–skipped dystrophin mRNA by nested RT-PCR (right) and quantification of exon 23 skipping levels by qRT-PCR (bottom) in the different muscle tissues following a 4-week treatment at the dose of 10 μmol/kg/week (TA: tibialis anterior, gas: gastrocnemius, quad: quadriceps, Tri: triceps, Bi: biceps; Dia: diaphragm). Results are expressed as mean ± SEM; n = 4 mice per group.
Figure 2.
Figure 2.
Dose dependant distribution of palmitic acid conjugated tcDNA in tissues following 12-week repeated dosing. (A) Schematic representation of the 12-week study protocol with different doses of palmitic acid conjugated tcDNA-ASO. Mdx mice were injected intravenously with 2, 4 or 10 μmol/kg/week of conjugated tcDNA (palm-tcDNA-PO or palm-tcDNA-PS) for 12 weeks and euthanized 2 weeks after the last dose for tissue collection. 2, 4 or 10 μmol/kg correspond to approximately 10, 20 and 50 mg/kg. (B) Quantification of palm-tcDNA in mouse serum collected 1 h post-injection by fluorescent hybridization assay (n = 4 per group; data are represented as mean ± SEM and ratio between the different doses for each compound are shown). (C) Quantification of tcDNA-ASO content in various tissues 2 weeks after the end of the 12-week dosing regimen by fluorescent hybridization assay. Results are expressed as mean ± SEM; n = 4 mice per group.
Figure 3.
Figure 3.
Skipping efficacy and dystrophin rescue following 12-week repeated dosing of palm-tcDNA-ASO. (A) Quantification of exon 23 skipping levels in different muscle tissues 2-week after the end of the 12-week dosing regimen (palm-tcDNA-PO or palm-tcDNA-PS at 2, 4 or 10 μmol/kg/week) by RT-qPCR. Results are expressed as mean ± SEM; n = 4 mice/group. (B) ED50 values corresponding to the dose of ASO required to achieve 50% of exon 23 skipping in each tissue were determined with GraphPad Prism 7 software for palm-tcDNA-PO or palm-tcDNA-PS. (C) Detection and quantification of dystrophin restoration by western blot analysis in the different muscle tissues 2 weeks after the end of the 12-week dosing regimen (palm-tcDNA-PO or palm-tcDNA-PS at 2, 4 or 10 μmol/kg/week). The blot shows a representative example of dystrophin restoration in the quadriceps of one of the four animals per group. Results are expressed as mean ± SEM; n = 4 mice/group. (D) Detection of the dystrophin protein (green staining) by immunostaining on transverse sections of muscle tissues (quadriceps, diaphragm and heart) from WT and mdx mice treated with PBS or palm-tcDNA-PO or palm-tcDNA-PS for 12 weeks at 10 μmol/kg/week. Nuclei are labelled in blue (DAPI). Scale bar, 100 μm.
Figure 4.
Figure 4.
Functional evaluation following 12-week repeated dosing of palm-tcDNA-ASO treatment. (A) Maximal specific force (sP0) (left panel) and percentage of force drop following a series of eccentric contractions (right panel) measured on semi-isolated tibialis anterior (TA) muscles from mdx mice treated with palm-tcDNA-PO or palm-tcDNA-PS (n = 4 mice/group and 2 TA analysed per mouse) for 12 weeks at 10 μmol/kg/week and compared to WT and PBS control mdx mice (n = 8 mice/group). Results are expressed as mean ± SEM. **P < 0.01 compared to PBS treated controls (Mann–Whitney U tests). (B) Detection and quantification of MYOM3 levels by western blot in serum of mdx mice treated with palm-tcDNA-PO or palm-tcDNA-PS (n = 4 mice/group) for 4 or 12 weeks at 10 μmol/kg/week and compared to WT and PBS control mdx mice (n = 8 mice/group). Results are expressed as mean ± SEM. *P < 0.05 and **P < 0.01 compared to PBS treated controls (Mann–Whitney U tests).
Figure 5.
Figure 5.
Palm-tcDNA-ASO effect on central nervous system in treated mdx mice. (A) Quantification of exon 23 skipping by qRT-PCR in the cortex, cerebellum (CBL), and hippocampus (Hippo) following intravenous injection of 10 μmol/kg/week of palm-tcDNA-PO or palm-tcDNA-PS for 12 weeks. Results are expressed as mean ± SEM; n = 4 mice per group. (B) Detection of restored dystrophin by immunostaining in the stratum pyramidale (SP) and proximal stratum radiatum (SR) of the CA1 hippocampus in wild-type and mdx mice treated with PBS, palm-tcDNA-PO or palm-tcDNA-PS (10 μmol/kg/week). Scale bar 12 μm. (C) Restraint-induced unconditioned fear responses expressed as a percentage of freezing time in wild-type and mdx mice treated with PBS, palm-tcDNA-PO or palm-tcDNA-PS (10 μmol/kg/week) after 4 weeks and 12 weeks of treatment. **P < 0.01 and ****P < 0.0001 compared to mdx controls (Mann–Whitney U tests); Results are expressed as mean ± SEM; n = 7 per palm-tcDNA treated group and n = 14 for wild-type and mdx PBS control (mice from the wash-out groups were included in this non-invasive test).
Figure 6.
Figure 6.
Palm-tcDNA-ASO efficacy is maintained after 12 weeks of wash-out period. (A) Schematic representation of the 12-week study protocol at 10 μmol/kg/week of palm-tcDNA-PO or palm-tcDNA-PS followed by a 12-week wash-out period. (B) Quantification of tcDNA compounds in the different tissues after the 12-week wash-out period by fluorescent hybridization assay. Results are expressed as mean ± SEM; n = 5 for palm-tcDNA-PO and n = 3 for palm-tcDNA-PO. The percentage of remaining ASO compared to the content measured 2 weeks after the last dose is indicated below the graphs. (C) Quantification of exon 23 skipping levels in different muscle tissues by taqman RT-qPCR after the 12-week wash-out period. Results are expressed as mean ± SEM; n = 3 for palm-tcDNA-PO and n = 5 for palm-tcDNA-PS. The percentage of remaining exon 23 skipping levels compared to the those measured 2 weeks after the last dose is indicated below the graphs. (D) Quantification of dystrophin restoration by western blot in the different muscle tissues after the 12-week wash-out period. Results are expressed as mean ± SEM; n = 3 for palm-tcDNA-PO and n = 5 for palm-tcDNA-PS. The percentage of remaining dystrophin expression compared to the levels measured 2 weeks after the last dose is indicated below the graphs.
Figure 7.
Figure 7.
In vitro evaluation of the palm-tcDNA-ASO on clotting times and complement activation. (A) To determine the effect of the different tcDNA-ASO on coagulation pathways, the prothrombin time (PT) (left) and the activated partial tromboplastin (aPTT) (right) were analysed in human plasma incubated with PBS (n = 12), tcDNA-PO (n = 6), tcDNA-PS (n = 6), palm-tcDNA-PO (n = 5) or palm-tcDNA-PS (n = 5). Results are expressed as mean ± SEM. ****P < 0.0001 compared to PBS (one-way ANOVA). (B) Mouse and human C3a anaphylotoxin were analysed by ELISA in mouse and human serum samples incubated with tcDNA-PO, tcDNA-PS, palm-tcDNA-PO or palm-tcDNA-PS. PBS and Zymosan were used as negative and positive control respectively. Results are expressed as mean ± SEM; n = 5 per tcDNA treated group and n = 12 for PBS and Zymosan controls. * P < 0.05, ** P < 0.01, ***P < 0.001, ****P < 0.0001 compared to PBS.
Figure 8.
Figure 8.
Evaluation of palm-tcDNA-ASO safety profile. (A) Serum CK, AST, ALT, bilirubin, ALP, albumin, creatinine and urea levels were measured at the end of the 12-wk treatment (12 weeks) or after a 12-week washout period (wash-out) in wild-type (n = 7) and mdx mice treated with PBS (n = 7), palm-tcDNA-PO (n = 3) or palm-tcDNA-PS (n = 5). Results are expressed as mean ± SEM. * P < 0.05, ** P < 0.01, ***P < 0.001, ****P < 0.0001 compared to PBS (two-way ANOVA). § P = 0.0025 compared to PBS (Mann–Whitney U tests). (B) Histological presentation of wild-type mice and mdx mice treated with PBS, palm-tcDNA-PO or palm-tcDNA-PS at 10 μmol/kg/wk for 12 weeks. In liver (upper panel), small foci of inflammatory cell infiltration (open arrowhead) were scattered in the liver parenchyma of mdx PBS mice compared to WT mice in which no such focus were observed. No additional lesions were present in mdx mice after palm-tcDNA-PO treatment. In palm-tcDNA-PS mice, foci of hepatocytes with intracytoplasmic vacuolization and fainted eosinophilic content (black arrowhead) were observed. Additionally, an increase in size heterogeneity of hepatocyte nuclei was present with notably numerous binucleated cells and meganucleation (arrow). In kidney (lower panel), no lesions were present in mdx mice after PBS or palm-tcDNA-PO treatment compared to WT mice. A slight increase of cellular density (*) in glomeruli was sometimes noted in mice treated with palm-tcDNA-PS. Hemalun-Eosin-Saffron staining. Scale bar = 50 μm. (C) Total protein and albumin levels in the urine of wild-type (n = 7) and mdx mice treated with PBS (n = 7), palm-tcDNA-PO (n = 3) or palm-tcDNA-PS (n = 5) at 10 μmol/kg/week for 12 weeks. Urines were collected at the end of the 12-week treatment (12 weeks) or after a 12-week washout period (wash-out). Results are normalised to creatinine levels and expressed as mean ± SEM. * P < 0.05 compared to PBS (two-way ANOVA). (D) Kidney injury biomarkers (KIB) were evaluated in urines collected from mdx mice treated with palm-tcDNA-PO (n = 3) or palm-tcDNA-PS (n = 5) at 10 μmol/kg/week for 12 weeks. Urines were collected at the end of the 12-week treatment (12 weeks) or after a 12-week washout period (wash-out). Results are normalised to mdx PBS levels and expressed as mean ± SEM; *P < 0.05 compared to PBS (Mann–Whitney U tests).

References

    1. Overby S.J., Cerro-Herreros E., Llamusi B., Artero R. RNA-mediated therapies in myotonic dystrophy. Drug Discov. Today. 2018; 23:2013–2022. - PubMed
    1. Ferlini A., Goyenvalle A., Muntoni F. RNA-targeted drugs for neuromuscular diseases. Science. 2021; 371:29–31. - PubMed
    1. Geary R.S., Yu R.Z., Levin A.A. Pharmacokinetics of phosphorothioate antisense oligodeoxynucleotides. Curr. Opin. Investig. Drugs. 2001; 2:562–573. - PubMed
    1. Geary R.S., Norris D., Yu R., Bennett C.F. Pharmacokinetics, biodistribution and cell uptake of antisense oligonucleotides. Adv. Drug. Deliv. Rev. 2015; 87:46–51. - PubMed
    1. Roberts T.C., Langer R., Wood M.J.A. Advances in oligonucleotide drug delivery. Nat. Rev. Drug Discov. 2020; 19:673–694. - PMC - PubMed

Publication types