. 2022 Aug 10;71(5):1073-1087.
doi: 10.1093/sysbio/syab095.

Bayesian Inference of Clonal Expansions in a Dated Phylogeny

Affiliations

Bayesian Inference of Clonal Expansions in a Dated Phylogeny

David Helekal et al. Syst Biol. .

Abstract

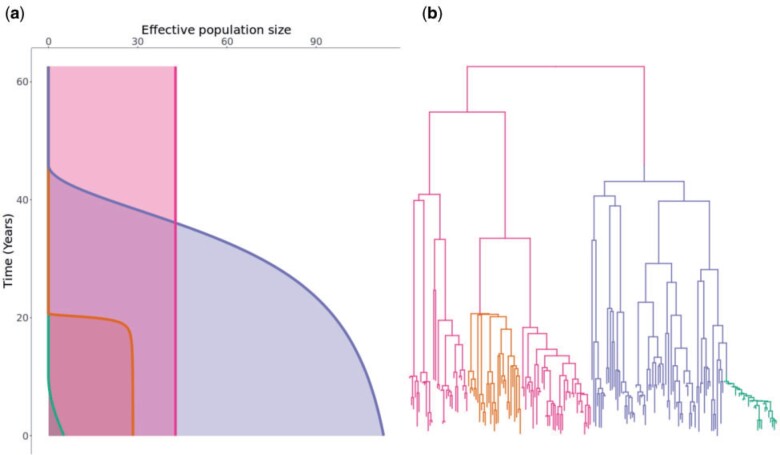
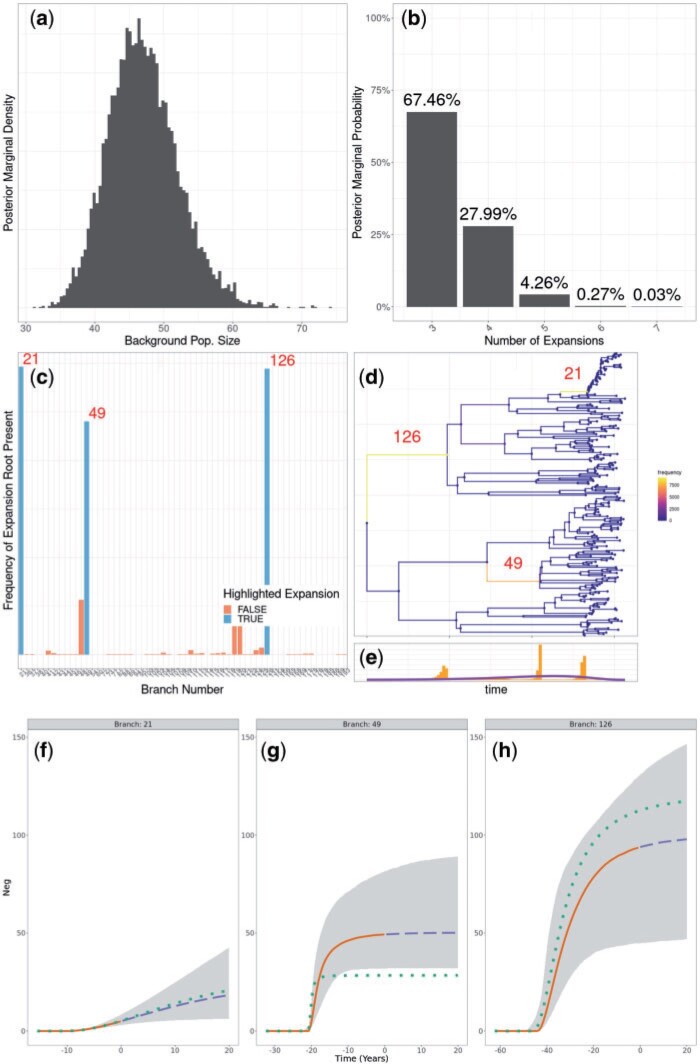
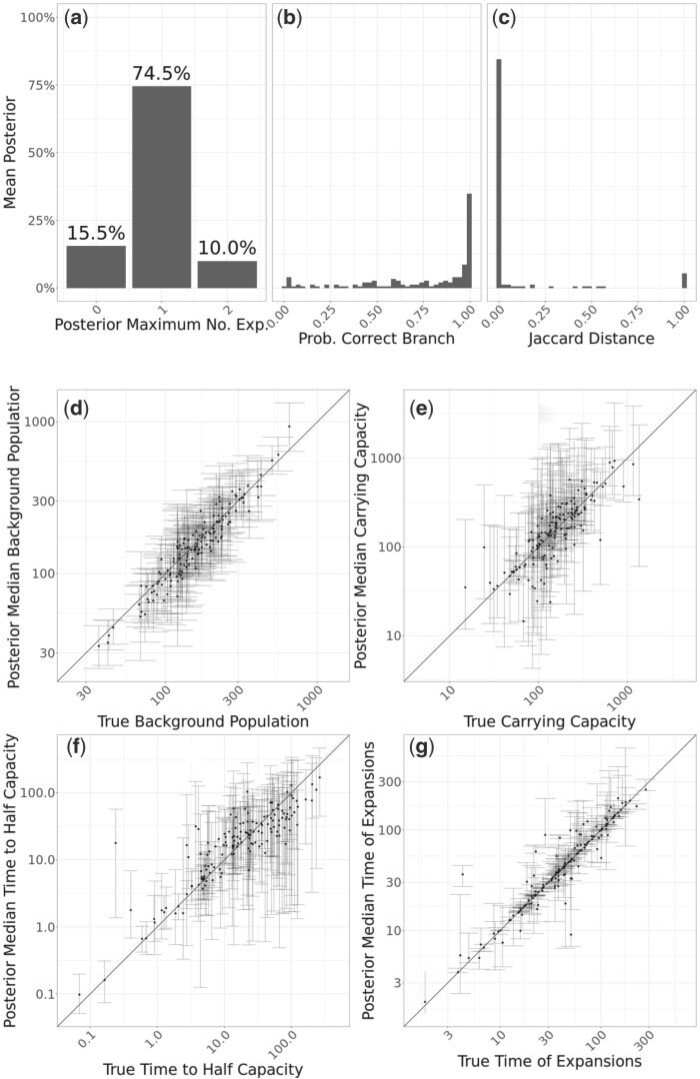
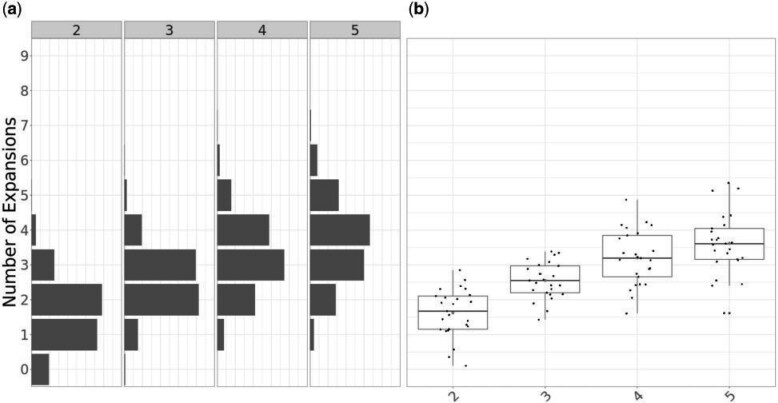
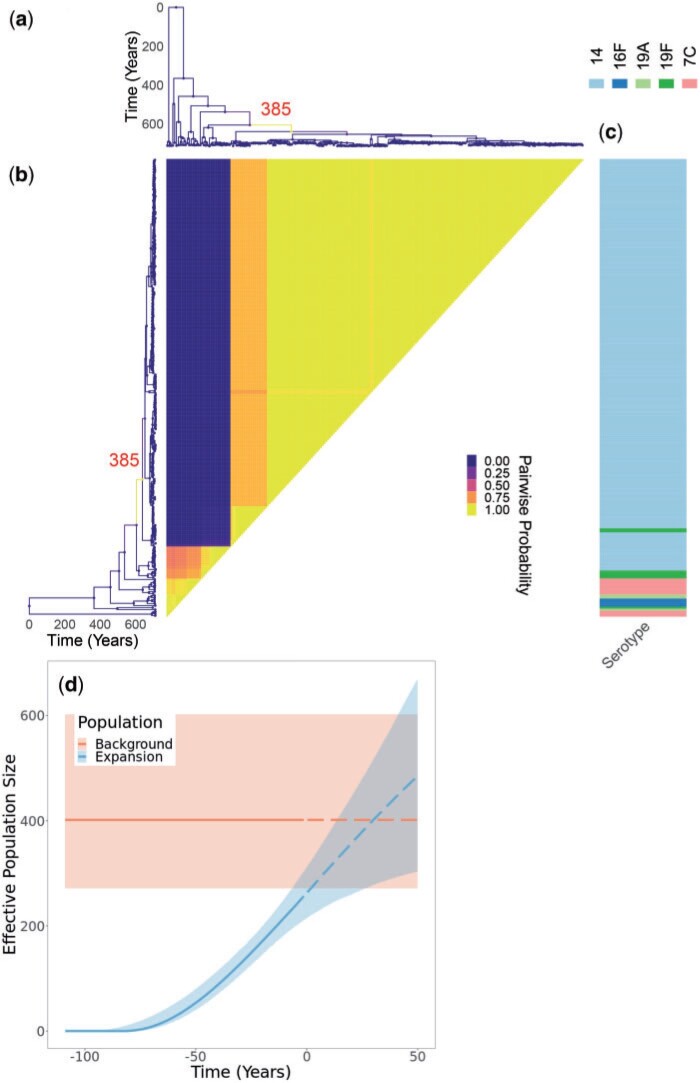
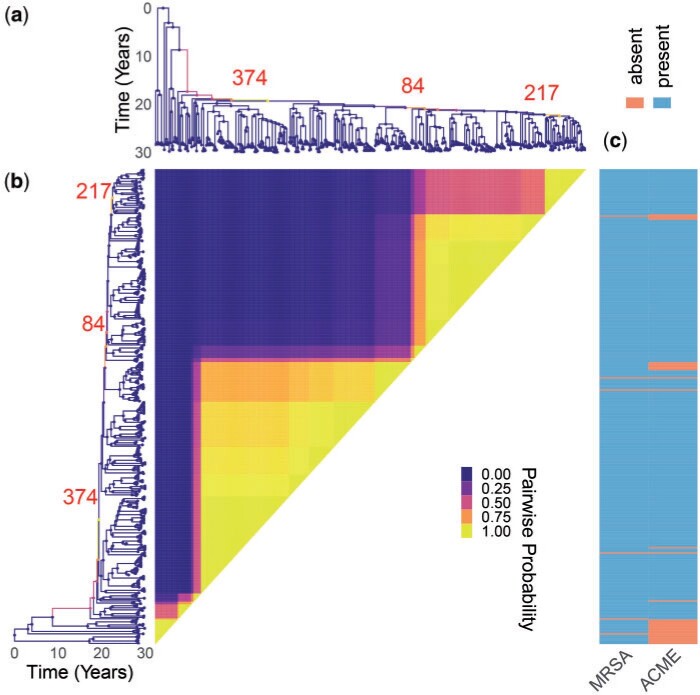
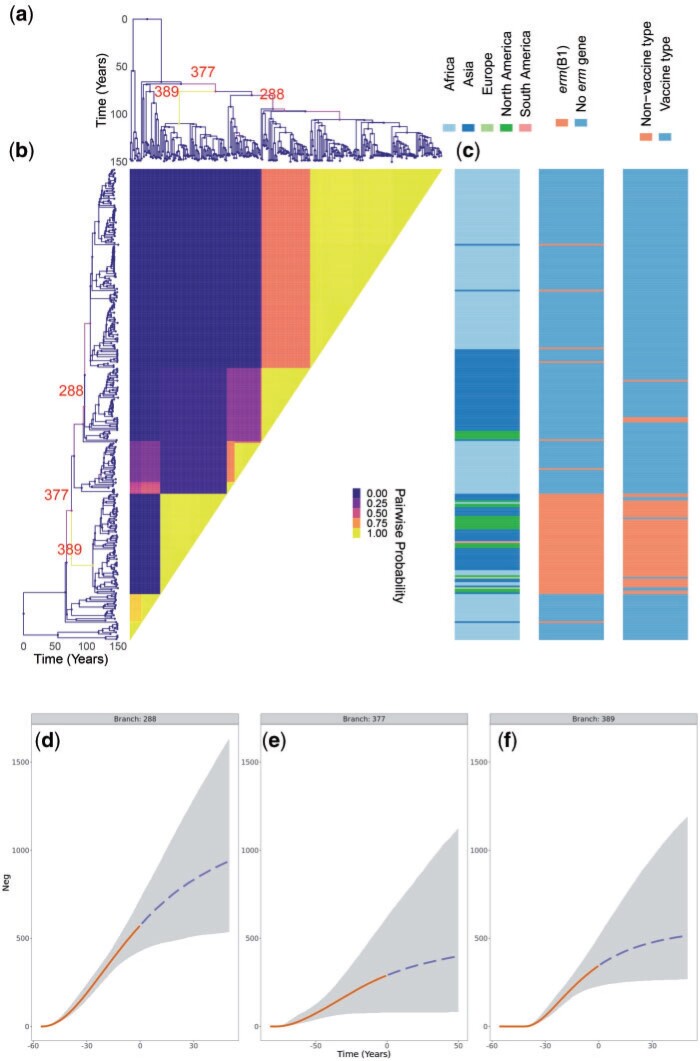
Microbial population genetics models often assume that all lineages are constrained by the same population size dynamics over time. However, many neutral and selective events can invalidate this assumption and can contribute to the clonal expansion of a specific lineage relative to the rest of the population. Such differential phylodynamic properties between lineages result in asymmetries and imbalances in phylogenetic trees that are sometimes described informally but which are difficult to analyze formally. To this end, we developed a model of how clonal expansions occur and affect the branching patterns of a phylogeny. We show how the parameters of this model can be inferred from a given dated phylogeny using Bayesian statistics, which allows us to assess the probability that one or more clonal expansion events occurred. For each putative clonal expansion event, we estimate its date of emergence and subsequent phylodynamic trajectory, including its long-term evolutionary potential which is important to determine how much effort should be placed on specific control measures. We demonstrate the applicability of our methodology on simulated and real data sets. Inference under our clonal expansion model can reveal important features in the evolution and epidemiology of infectious disease pathogens. [Clonal expansion; genomic epidemiology; microbial population genomics; phylodynamics.].


Figures

<sc>Figure</sc> 1.
Figure 1.
A realization from the clonal expansion model. a) Effective population size functions for each of the subpopulations. Each subpopulation is shown using a different color, with its size (x-axis) given as a function of time since present (y-axis). Note that the background subpopulation (pink) has a constant size whereas the three other subpopulations (orange, blue, and green) are clonal expansions. b) Dated phylogeny colored according to the four subpopulations as in part (a).
<sc>Figure</sc> 2.
Figure 2.
Application to the simulated data set shown in Figure 1. a) Posterior distribution of the background population size. b) Posterior distribution of the number of clonal expansions. c,d) Posterior probabilities of having a clonal expansions on different branches of the tree, with the indexes of three branches of interest shown. e) Posterior distribution of clonal expansion starting times, with prior shown in purple. f–h) Posterior reconstruction of the expansion population dynamics. 95% credible intervals in gray. Median in solid orange for past population dynamics and dashed blue for future prediction of the population dynamics. True population dynamics in dotted green.
<sc>Figure</sc> 3.
Figure 3.
Application to 200 simulated trees containing one expansion. a) Histogram of posterior modes for the number of expansions. b) Histogram of probability to have a clonal expansion on the correct branch. c) Histogram of Jaccard distances between the true expansion and the expansion corresponding to the mode branch. d–g) Scatter plots showing posterior median and 95% credible interval for individual expansion parameters, with correct values on the x-axis and inferred values on the y-axis. b–g) Only include simulations where the inferred mode of the number of expansions was one.
<sc>Figure</sc> 4.
Figure 4.
Application to 100 simulated data sets, with 25 per each scenario with 2, 3, 4, and 5 expansions. a) Expected posterior distributions for the number of expansions for each scenario. b) Box plots of the posterior mean number of expansions for each simulation by scenario.
<sc>Figure</sc> 5.
Figure 5.
Application to GPSC18 Streptococcus pneumoniae phylogeny. a) Dated phylogeny with branches colored according to the inferred probability of clonal expansion. The single branch with a high probability of clonal expansion is labeled. b) Pairwise matrix showing the posterior probabilities of any two samples belonging to the same subpopulation. c) color map showing serotype values. d) Posterior summary of the inferred effective population size functions. The colored regions represent 95% credible interval and the lines represent median. Solid denotes past effective population size inference and dashed represents prediction of future effective population size.
<sc>Figure</sc> 6.
Figure 6.
Application to methicillin resistant Staphylococcus aureus data set. a) Dated phylogeny with branches colored according to the inferred probability of clonal expansion. Three branches with high probability of clonal expansion are labeled. b) Pairwise matrix showing the posterior probabilities of any two genomes belonging to the same subpopulation. c) Color map showing the presence of relevant phenotypes.
<sc>Figure</sc> 7.
Figure 7.
Application to GPSC9 Streptococcus pneumoniae phylogeny. a) Dated phylogeny with branches colored according to the probability of clonal expansion. Three branches with high probability of clonal expansion are labeled. b) Pairwise matrix showing the posterior probabilities of any two samples belonging to the same subpopulation. c) Color map showing geographical sampling location, erm gene presence, and whether the serotype is covered by the vaccine. d–f) Posterior summary of the inferred effective population size functions. The grayed regions represent 95% credible interval and the lines represent median. Solid denotes past effective population size inference and dashed represents prediction of future effective population size.

References

    1. Allen L. 2008. An introduction to stochastic epidemic models. In: Brauer F., editor. Mathematical epidemiology vol. 1945 of Lecture Notes in Mathematics. Berlin Heidelberg: Springer. p. 81–130.
    1. Ansari M.A., Didelot X.. 2016. Bayesian inference of the evolution of a phenotype distribution on a phylogenetic tree. Genetics 204:89–98. - PMC - PubMed
    1. Baele G., Suchard M.A., Rambaut A., Lemey P.. 2016. Emerging concepts of data integration in pathogen phylodynamics. Syst. Biol. 00:1–24. - PMC - PubMed
    1. Barido-Sottani J., Vaughan T.G., Stadler T.. 2020. A multitype birth–death model for Bayesian inference of lineage-specific birth and death rates. Syst. Biol. 69:973–986. - PMC - PubMed
    1. Biek R., Pybus O.G., Lloyd-Smith J.O., Didelot X.. 2015. Measurably evolving pathogens in the genomic era. Trends Ecol. Evol. 30:306–313. - PMC - PubMed

Publication types