. 2022 Jan 11;50(1):191-206.
doi: 10.1093/nar/gkab1221.

HIRA complex presets transcriptional potential through coordinating depositions of the histone variants H3.3 and H2A.Z on the poised genes in mESCs

Affiliations

HIRA complex presets transcriptional potential through coordinating depositions of the histone variants H3.3 and H2A.Z on the poised genes in mESCs

Yang Yang et al. Nucleic Acids Res. .

Abstract

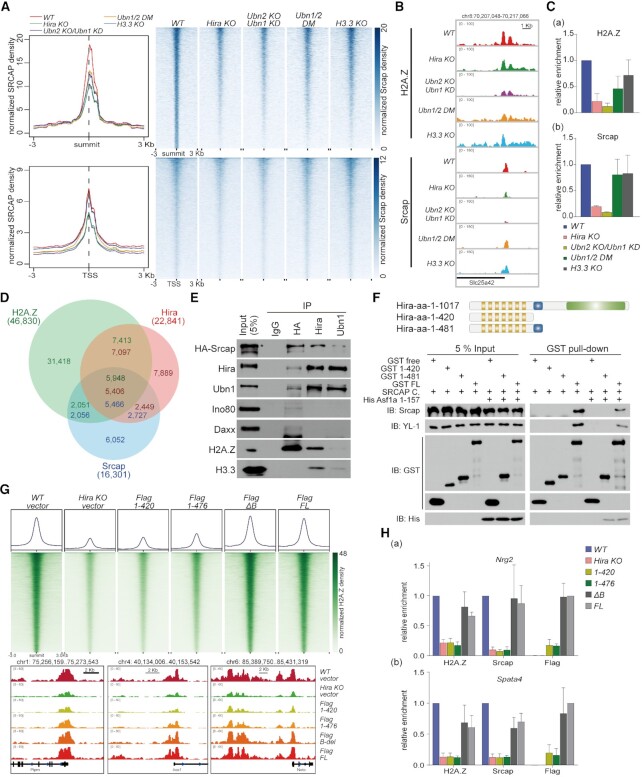
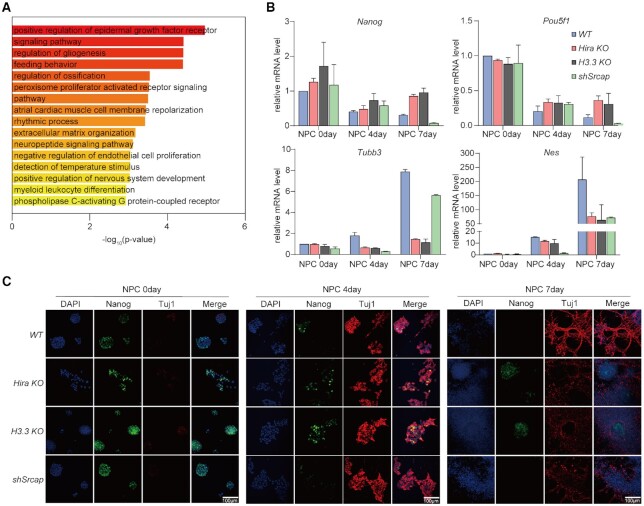
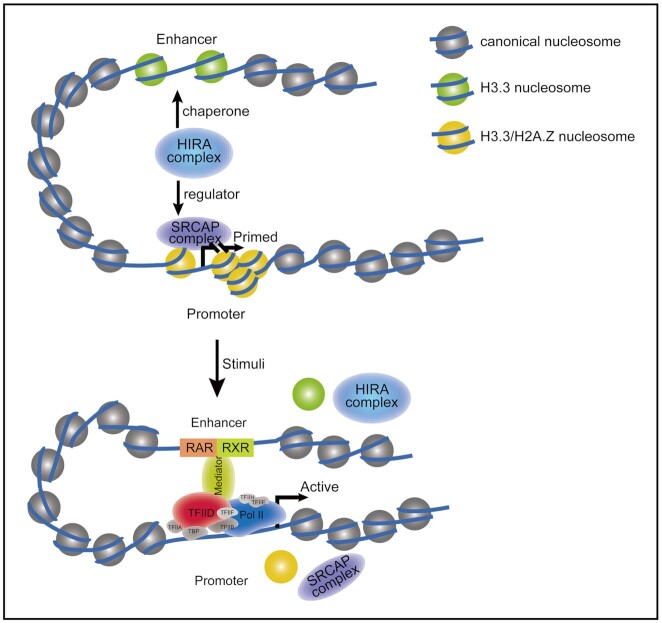
Histone variants have been implicated in regulating chromatin dynamics and genome functions. Previously, we have shown that histone variant H3.3 actively marks enhancers and cooperates with H2A.Z at promoters to prime the genes into a poised state in mouse embryonic stem cells (mESCs). However, how these two important histone variants collaboratively function in this process still remains elusive. In this study, we found that depletion of different components of HIRA complex, a specific chaperone of H3.3, results in significant decreases of H2A.Z enrichment at genome scale. In addition, CUT&Tag data revealed a genomic colocalization between HIRA complex and SRCAP complex. In vivo and in vitro biochemical assays verified that HIRA complex could interact with SRCAP complex through the Hira subunit. Furthermore, our chromatin accessibility and transcription analyses demonstrated that HIRA complex contributed to preset a defined chromatin feature around TSS region for poising gene transcription. In summary, our results unveiled that while regulating the H3.3 incorporation in the regulatory regions, HIRA complex also collaborates with SRCAP to deposit H2A.Z onto the promoters, which cooperatively determines the transcriptional potential of the poised genes in mESCs.


Figures

Figure 1.
Figure 1.
Defect of HIRA complex results in H2A.Z decrease on genome wide. (A) Schematic diagram of genome editing in defective cell lines. Hira-, Ubn2- and H3.3-knockout cell lines and Ubn1/2 double mutants were generated using CRISPR-Cas9 system. For subsequent experiments, 6 × HA tag was added to the N-terminus of Srcap in R1 wild type and above defective cell lines. (B) Western blot respectively shows the proteins levels of Hira (a), Ubn1&Ubn2 (b), and H3.3 (c) in the defective cell lines. (C) Meta-analysis (left) and heatmap (right) show H2A.Z reads density around summit (upper) and TSS (below) in R1 WT, Hira-KO, Ubn2-KO/Ubn1-KD, Ubn1/2-DM and H3.3-KO cells within a ±3 kb window. (D) Venn diagram shows the overlap of H2A.Z down-regulated peaks between the above defective cell lines. (E) The reduced H2A.Z peaks in either Hira-KO or Ubn2-KO/Ubn1-KD cell lines are defined as HIRA complex regulated (HR) peaks (23 530 peaks). The 5426 HR peaks overlapping with Ubn1/2-DM cell line is defined as HIRA-regulated and H3.3-dependent (HIRA-H3.3D). The other 18 104 HR peaks are HIRA-regulated and H3.3-independent (HIRA-H3.3ID).
Figure 2.
Figure 2.
HIRA collaborates with SRCAP to deposit H2A.Z on genome. (A) Meta-analysis (left) and heatmap (right) show Srcap reads density around summit (upper) and TSS (below) within a ±3 kb window. (B) Representative loci on Slc25a42 gene show the enrichment of H2A.Z and Srcap. (C) ChIP-qPCR validation of H2A.Z and Srcap enrichment at promoter of Slc35a42 gene. Error bars represent data from three independent experiments. (D) Venn diagram shows the overlap between H2A.Z, Hira and Srcap peaks. (E) Western blot shows the interaction among endogenous HA-Srcap, Hira and Ubn1 from nuclear lysates. Ino80, Daxx, H2A.Z and H3.3 are also detected. (F) Top panel showed schematic presentation of full length and truncation mutants of Hira subunit. Bottom panel showed the biochemical interactions between Hira truncations and SRCAP complex are analyzed by GST pull-down coupled with western blot analyses. (G) Heatmaps (upper) show H2A.Z reads density around H2A.Z peak summits (upper) in R1 WT, Hira-KO and Hira-truncation mutant expressing cells within a ±3 kb window. Representative loci (bottom) show the enrichment of H2A.Z. (H) ChIP-qPCR of H2A.Z, Srcap and Flag at representative genes Nrg2 and Spata4 in the rescued overexpressed cell lines. Error bars represent data from three independent experiments.
Figure 3.
Figure 3.
HIRA-mediated H2A.Z recruitment is crucial for the local chromatin state of TSS and tRA inducible gene transcription. (A) Heatmap (below) and statistical graph (upper) of normalized mononucleosome density on TSSs within a ±0.5 kb window. Each unsaturated MNase signaling contains 2 min and 4 min digested production. The distributions of mononucleosomes are classified into three groups based on H2A.Z content, that is, HIRA-regulated and H3.3-independent (HIRA-H3.3ID) H2A.Z, HIRA-regulated and H3.3-dependent (HIRA-H3.3D) H2A.Z, and no H2A.Z binding (NO H2A.Z) in each cell line. (B) Boxplot shows the normalized H2A.Z density around TSS of tRA inducible gene (iTSS) and other TSS (TSS) in R1 WT cells. These two subsets are further classified into HIRA-H3.3ID H2A.Z, HIRA-H3.3D H2A.Z and NO H2A.Z. P, P-value by two-tailed Wilcoxon rank test. (C) Statistical graph of normalized gene expression in R1 WT cells. The inducible genes are classified into HIRA-H3.3ID iTSS, HIRA-H3.3D iTSS and NO H2A.Z iTSS. P, P-value by two-tailed Wilcoxon rank test. (D) The K-means clustering analysis of time course expression profiles across samples of tRA inducible genes with HIRA-H3.3ID and HIRA-H3.3D H2A.Z in their promoters.
Figure 4.
Figure 4.
The poised chromatin state is essential for NPC differentiation. (A) The Gene Ontology analysis of genes in cluster C1-C4. Real-time quantitative PCR (B) and immunofluorescent staining (C) of Nanog, Pou5f1, Tubb3 and Nes in 0, 4, 7-day NPCs which derived from R1 WT, Hira-KO, H3.3b-KO/H3.3a-KD and shSrcap cells respectively. *P-value < 0.033, P-value < 0.001, unpaired t test. Nanog and Tuj1 represent proteins encoded by Nanog and Tubb3. Standard deviation (SD) was calculated from three replicates.
Figure 5.
Figure 5.
A model for the HIRA-faciliated the poised chromatin state during gene activation. When gene prepares to be activated, histone variants H3.3 and H2A.Z occupy the transcribed regions such as promoter and enhancer to set up a poised chromatin state (31). HIRA complex, as a chaperone of H3.3, also facilitates H2A.Z deposition through collaborating with SRCAP complex in this process. This molecular mechanism plays an important role in stabilizing the poised chromatin state at promoters to preset gene transcriptional potential during mESC differentiation.

References

    1. Song F., Chen P., Sun D., Wang M., Dong L., Liang D., Xu R.M., Zhu P., Li G.. Cryo-EM study of the chromatin fiber reveals a double helix twisted by tetranucleosomal units. Science. 2014; 344:376–380. - PubMed
    1. Kornberg R.D. Chromatin structure: a repeating unit of histones and DNA. Science. 1974; 184:868–871. - PubMed
    1. Luger K., Mader A.W., Richmond R.K., Sargent D.F., Richmond T.J.. Crystal structure of the nucleosome core particle at 2.8 A resolution. Nature. 1997; 389:251–260. - PubMed
    1. Talbert P.B., Henikoff S.. Histone variants–ancient wrap artists of the epigenome. Nat. Rev. Mol. Cell Biol. 2010; 11:264–275. - PubMed
    1. Chen P., Zhao J., Li G.. Histone variants in development and diseases. J Genet Genomics. 2013; 40:355–365. - PubMed

Publication types