. 2022 Apr 18;145(2):569-583.
doi: 10.1093/brain/awab320.

Bacterial neurotoxic metabolites in multiple sclerosis cerebrospinal fluid and plasma

Affiliations

Bacterial neurotoxic metabolites in multiple sclerosis cerebrospinal fluid and plasma

Achilles Ntranos et al. Brain. .

Abstract

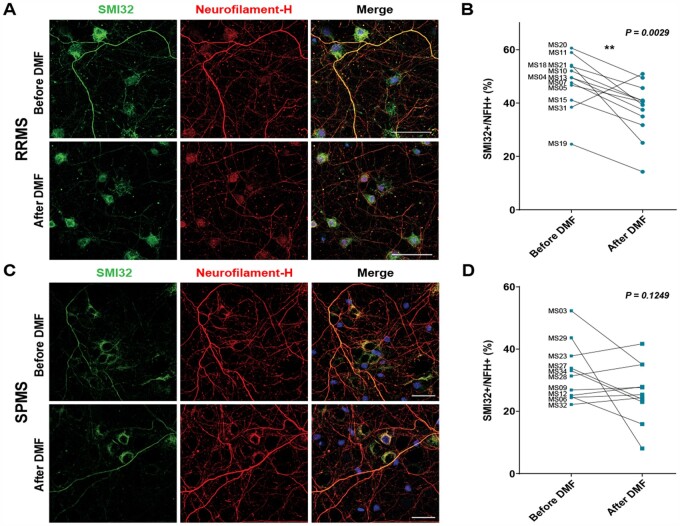
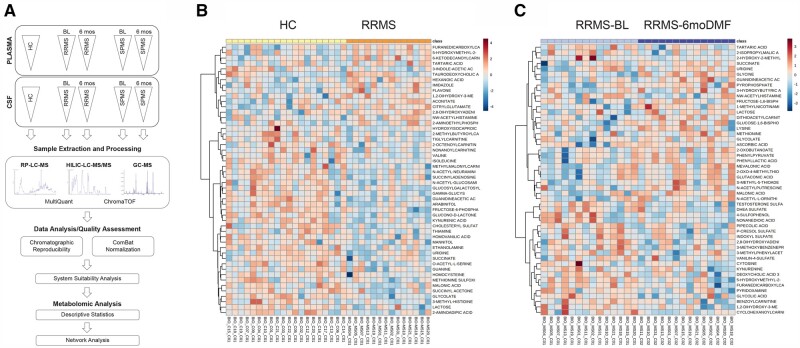
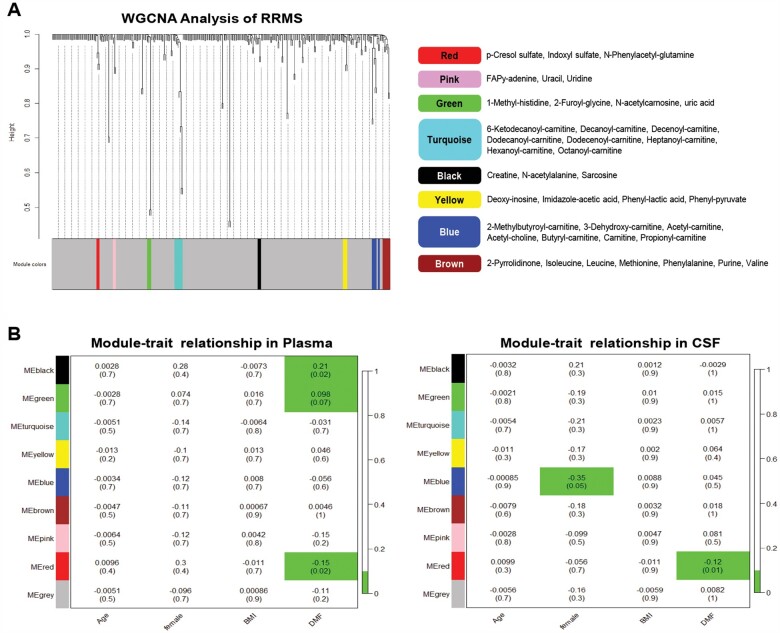
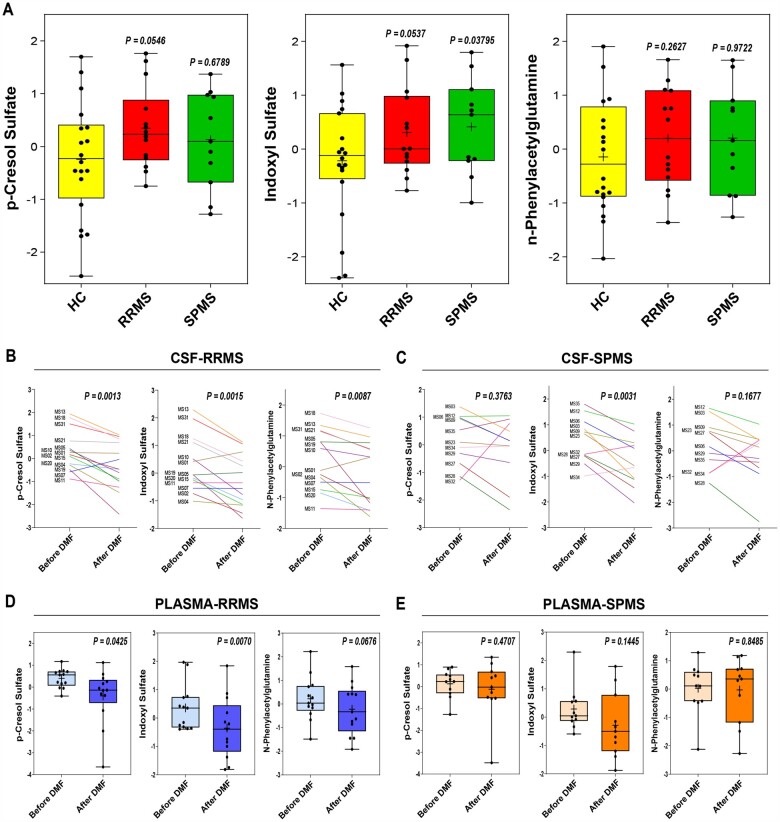
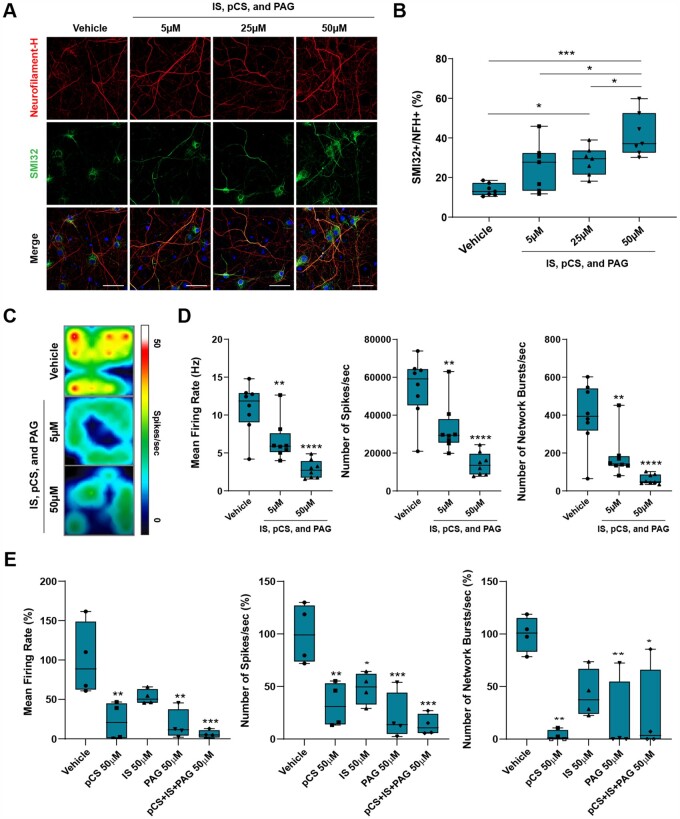
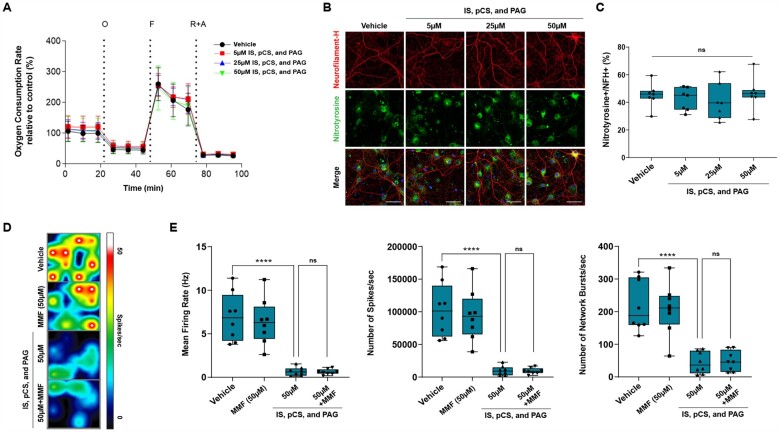
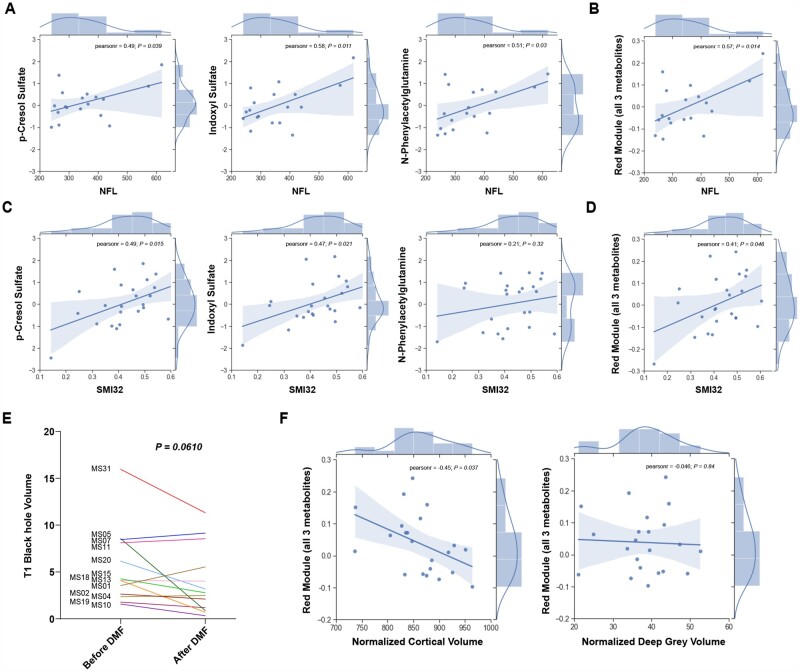
The identification of intestinal dysbiosis in patients with neurological and psychiatric disorders has highlighted the importance of gut-brain communication, and yet the question regarding the identity of the components responsible for this cross-talk remains open. We previously reported that relapsing remitting multiple sclerosis patients treated with dimethyl fumarate have a prominent depletion of the gut microbiota, thereby suggesting that studying the composition of plasma and CSF samples from these patients may help to identify microbially derived metabolites. We used a functional xenogeneic assay consisting of cultured rat neurons exposed to CSF samples collected from multiple sclerosis patients before and after dimethyl fumarate treatment to assess neurotoxicity and then conducted a metabolomic analysis of plasma and CSF samples to identify metabolites with differential abundance. A weighted correlation network analysis allowed us to identify groups of metabolites, present in plasma and CSF samples, whose abundance correlated with the neurotoxic potential of the CSF. This analysis identified the presence of phenol and indole group metabolites of bacterial origin (e.g. p-cresol sulphate, indoxyl sulphate and N-phenylacetylglutamine) as potentially neurotoxic and decreased by treatment. Chronic exposure of cultured neurons to these metabolites impaired their firing rate and induced axonal damage, independent from mitochondrial dysfunction and oxidative stress, thereby identifying a novel pathway of neurotoxicity. Clinical, radiological and cognitive test metrics were also collected in treated patients at follow-up visits. Improved MRI metrics, disability and cognition were only detected in dimethyl fumarate-treated relapsing remitting multiple sclerosis patients. The levels of the identified metabolites of bacterial origin (p-cresol sulphate, indoxyl sulphate and N-phenylacetylglutamine) were inversely correlated to MRI measurements of cortical volume and directly correlated to the levels of neurofilament light chain, an established biomarker of neurodegeneration. Our data suggest that phenol and indole derivatives from the catabolism of tryptophan and phenylalanine are microbially derived metabolites, which may mediate gut-brain communication and induce neurotoxicity in multiple sclerosis.

Keywords: brain; metabolism; microbiota; neurodegeneration.


Conflict of interest statement

A.N. received financial compensation as a consultant for Biogen Idec.

Figures

Figure 1
Figure 1
DMF treatment reduces the neurotoxic potential of CSF from RRMS but not SPMS patients. (A and C) Confocal image of primary cultured neurons exposed to CSF from RRMS (A) or SPMS (C) patients for 18 h and then fixed, stained with antibodies for SMI32 (green, to assess axonal damage) and for neurofilament heavy chain (red, as control for axonal density). (B and D) Percentage axonal damage was calculated by dividing SMI32 positive area by the total neurofilaments. The paired analysis of SMI32 immunoreactivity in neurons exposed to CSF samples collected at baseline and after 6 months of DMF treatment is shown for RRMS (B) and SPMS (D) patients. Note the significant reduction of the SMI32 marker of axonal damage only in RRMS patients (A and B) and not SPMS (C and D) patients. **P < 0.01 (paired t-test). Scale bar = 50 µm.
Figure 2
Figure 2
Metabolomic profiling of CSF in RRMS patients. (A) Flow chart of the experimental approach and data analysis related to metabolomics profiling of CSF and plasma samples. (B) Heat map of the hierarchical clustering representing the metabolic features differentially abundant in healthy control (HC, yellow) and RRMS (orange) patients. (C) Heat map of the hierarchical clustering of the longitudinally collected samples in RRMS patients at baseline (BL, light blue) and 6 months after DMF treatment (purple). The relative abundance of metabolites at baseline and after DMF treatment is shown as colour variation from dark red (high abundance) to dark blue (low abundance) for each metabolite (rows) and for each individual patient at the two time points (columns).
Figure 3
Figure 3
Identification of bacterial metabolites significantly reduced by DMF treatment in plasma and CSF of RRMS patients. (A) Consensus analysis of CSF and plasma metabolome from RRMS patients was performed using WGCNA to identify highly correlated metabolite modules. The cluster dendrogram is depicted on the left, with each line representing a different metabolite and the height representing their similarity or correlation. The distinct clusters of highly correlated metabolites, called ‘modules’, are shown in various colours at the bottom, with the grey colour reserved for metabolites that did not correlate with each other. The specific metabolites belonging to distinct modules are shown on the right. (B) The eigenvector of the metabolite modules was associated with different patient traits using linear mixed-effect models, given our paired sample design. Each module colour is shown on the y-axis and each trait on the x-axis. The coefficient and the P-value (in parentheses) of the model are shown in the table (top and bottom numbers, respectively). The associations with P-values < 0.1 are shown in green. The only module that is significantly associated with DMF treatment in both plasma (left) and CSF (right) is the ‘red module’, which is composed of bacterial metabolites. Of note, this module does not correlate with other patient traits, such as age, sex or body mass index.
Figure 4
Figure 4
Neurotoxic metabolites are in higher abundance in the CSF of RRMS than SPMS patients. (A) Graphs show normalized levels of pCS, IS and PAG in CSF of RRMS, SPMS, and healthy control (HC), with each metabolite trending towards higher abundance in multiple sclerosis patients compared to controls. (B and C) Paired analysis of the relative abundance of metabolites in the longitudinally collected CSF samples from RRMS and SPMS patients [each line representing of patient at baseline (before DMF) and after 6 months of DMF treatment (after DMF)]. Note the significant reduction of pCS, IS and PAG relative abundance in RRMS, not in SPMS. (D and E) Similarly, abundance of putative neurotoxic metabolites was decreased in plasma from RRMS patients, but not in SPMS patients, after DMF treatment. The lines in the box plot in A, D and E represent the quartiles (25th, 50th, 75th) and the whiskers mark the minimum and maximum values of the data. Statistical significance was calculated by either linear regression controlling for age (A), or paired Student’s t-test (BE).
Figure 5
Figure 5
Identified bacterial metabolites directly induce axonal damage and neuronal dysfunction. (A) Confocal image of cultured neurons chronically exposed to different concentrations of the three ‘red module’ metabolites after 18 days in culture and stained for neurofilament heavy chain (red) and for the axonal marker SMI32 (green). (B) Dose-dependent axonal damage expressed as the percentage of NFH+ neuronal processes that are co-stained with SMI32. (C) Pseudo-colour image of the spontaneous electrical neuronal activity measured using MEA of neurons kept in regular medium supplemented with either vehicle or with the red module metabolites at the indicated concentration. Red represents high electrical activity and blue low activity in neurons. (D) The combination of the bacterial metabolites significantly decreased spontaneous neuronal activity as measured by calculating the average firing rate, number of spikes per second and number of network bursts. (E) The effect of treatment with each individual metabolite was significant and distinct. The overall effect of the combination of metabolites was synergistic on the mean firing rate and number of spikes per seconds. The lines in the box plot in B, D and E represent the quartiles (25th, 50th, 75th) and the whiskers mark the minimum and maximum values of the data. Statistical significance assessed by one-way ANOVA followed by Tukey’s post hoc test. *P < 0.05, **P < 0.01, ***P < 0.001, ****P < 0.0001. Scale bar = 50 µm.
Figure 6
Figure 6
MMF cannot counteract neurotoxicity of microbial metabolites. (A) A Mito Stress Test was performed on neurons cultured in the absence (black curve) or presence of increasing concentrations of the three metabolites (red for 5 µM, blue for 25 µM, green for 50 µM), using the Seahorse XF bioanalyser. No difference in mitochondrial bioenergetic measures was detected. Error bars represent SD. (B) Immunofluorescence of neurons stained with a nitrotyrosine (NTS)-specific antibody, as a marker for cell damage and for neurofilament H (NFH). (C) Quantification of NTS staining was referred to the total NFH+ neuronal processes and did not reveal significant differences between metabolite-treated neurons compared to vehicle. (D and E) Neuronal cultures were chronically exposed to a mixture of CS, IS and PAG (50 µM each) in the absence or presence of MMF (50 µM), and the endogenous neuronal activity was measured. The lines in the box plots in C and E represent the quartiles (25th, 50th, 75th) and the whiskers mark the minimum and maximum values of the data. Statistical significance was assessed by one-way ANOVA followed by Tukey’s post hoc test. ****P < 0.0001. Scale bar = 50 µm
Figure 7
Figure 7
Correlation between neurotoxic CSF metabolites, biomarker of neurodegeneration and cortical volume in multiple sclerosis patients. (A) The correlation plots of the eigenvector of each individual metabolite (CS, IS and PAG) in the red module and the NFL levels in the CSF are positively correlated. (B) The abundance of the three metabolites as a ‘red module’, significantly correlated with the NFL concentration in the CSF. (C) The correlation plots of the eigenvector of each metabolite in the red module indicated that correlation of the ‘red module’ metabolites to axonal damage was mainly driven by CS and IS, not by PAG. (D) However, the relative abundance of the ‘red module’ metabolites significantly correlated with SMI32+ area in neurons treated with the patient-derived CSF samples. (E) T1 black hole volume in RRMS patients showed a trend towards improvement after DMF treatment. (F) The three ‘red module’ metabolites, as a group, were inversely correlated with the volume of superficial cortical layers (normalized cortical volume) and not with that of deep grey matter (normalized deep grey volume) as measure at the 1-year follow-up. Pearson’s correlation coefficient (r) and associated P-value or P-values for paired t-test are indicated.

References

    1. Iglesias-Vázquez L, Van Ginkel Riba G, Arija V, Canals J. Composition of gut microbiota in children with autism spectrum disorder: A systematic review and meta-analysis. Nutrients. 2020;12(3):792. - PMC - PubMed
    1. Kong G, Cao KL, Judd LM, Li S, Renoir T, Hannan AJ. Microbiome profiling reveals gut dysbiosis in a transgenic mouse model of Huntington's disease. Neurobiol Dis. 2020;135:104268. - PubMed
    1. Sampson TR, Debelius JW, Thron T, et al. Gut microbiota regulate motor deficits and neuroinflammation in a model of Parkinson's disease. Cell. 2016;167(6):1469–1480.e12. - PMC - PubMed
    1. Wu SC, Cao ZS, Chang KM, Juang JL. Intestinal microbial dysbiosis aggravates the progression of Alzheimer's disease in Drosophila. Nat Commun. 2017;8(1):24. - PMC - PubMed
    1. Quagliariello A, Del Chierico F, Russo A, et al. Gut microbiota profiling and gut–brain crosstalk in children affected by pediatric acute-onset neuropsychiatric syndrome and pediatric autoimmune neuropsychiatric disorders associated with streptococcal infections. Front Microbiol. 2018;9:675. - PMC - PubMed

Publication types