. 2022 Apr 5;73(7):1963-1977.
doi: 10.1093/jxb/erab542.

INTERMEDIUM-C mediates the shade-induced bud growth arrest in barley

Affiliations

INTERMEDIUM-C mediates the shade-induced bud growth arrest in barley

Hongwen Wang et al. J Exp Bot. .

Abstract

Tiller formation is a key agronomic determinant for grain yield in cereal crops. The modulation of this trait is controlled by transcriptional regulators and plant hormones, tightly regulated by external environmental conditions. While endogenous (genetic) and exogenous (environmental factors) triggers for tiller formation have mostly been investigated separately, it has remained elusive how they are integrated into the developmental program of this trait. The transcription factor gene INTERMEDIUM-C (INT-C), which is the barley ortholog of the maize domestication gene TEOSINTE BRANCHED1 (TB1), has a prominent role in regulating tiller bud outgrowth. Here we show that INT-C is expressed in tiller buds, required for bud growth arrest in response to shade. In contrast to wild-type plants, int-c mutant plants are impaired in their shade response and do not stop tiller production after shading. Gene expression levels of INT-C are up-regulated under light-limiting growth conditions, and down-regulated after decapitation. Transcriptome analysis of wild-type and int-c buds under control and shading conditions identified target genes of INT-C that belong to auxin and gibberellin biosynthesis and signaling pathways. Our study identifies INT-C as an integrator of the shade response into tiller formation, which is prerequisite for implementing shading responses in the breeding of cereal crops.

Keywords: INTERMEDIUM-C; Abscisic acid; barley; bud growth arrest; decapitation; shade avoidance; yield.


Figures

Fig. 1.
Fig. 1.
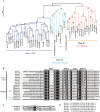
Phylogenetic tree and alignments of Arabidopsis and barley TCP proteins. (A) The phylogenetic tree was built based on multiple alignment of the TCP domain in the TCP proteins using the Neighbor–Joining method with 1000 bootstrap replicates. Blue, light blue, and orange lines indicate the PCF, CYC/TB1, and CIN clades, respectively. Each Arabidopsis protein is indicated by a square, each barley protein is indicated by a triangle. (B) Alignment of the TCP domain and adjoining sequence for the predicted barley TCP proteins. Overall conserved amino acids are shaded in black. Amino acids 80% or 100% conserved in Class II or Class I are shaded in light gray and dark gray, respectively. The basic, helix I, loop, and helix II regions are indicated. (C) Alignment of the R-domain of Class II subfamily members. Amino acids are expressed in the standard single letter code. Sequences were aligned with ClustalW and represented with Genedoc. (D) Alignment of putative target areas for miR319a (aligned in reverse). Asterisks indicate INT-C (HvTCP16).
Fig. 2.
Fig. 2.
INT-C is involved in barley plant architecture by tiller bud outgrowth. Analysis of tiller development in wild-type and int-c plants. (A) Tiller number of int-c and wild-type plants 1–8 weeks after germination (n=25–30 plants). Asterisks indicate significant differences (Student’s t-test, P<0.001) between wild-type and int-c mutant plants. (B) Dissected tillers from successive leaf axils in ~2- to 3-week-old seedlings. Ct, coleoptile tiller; 1–4, order of leaves; scale bars=5 cm; arrows, tiller buds. (C) Exemplary tiller bud formation stage in the third leaf axil. The area of the close-up view is outlined with a white box in the left image. Dissection of a tiller bud at this stage will reveal a shoot apex with leaf primordia and a meristematic dome. Scale bars represent 200 μm. (D) Schematic representations of tiller bud production in each leaf axil of the wild type and int-c in 2- to 3-week-old seedlings. Each column stands for a single plant, and each row stands for a leaf axil in order from bottom to top, starting with the coleoptile tiller. Different colored squares denote different tiller bud lengths. (E) INT-C (HvTCP16) mRNA levels in different tissues and (F) during spike development as analyzed by real-time qRT–PCR. Bars represent means ±SD; n=3 biological replicates. Serine/threonine protein phosphatase HvPP2A-4 mRNA was used as a reference. TM, triple mound; GP, glume primordium; SP, stamen primordium; AP, awn primordium.
Fig. 3.
Fig. 3.
INT-C expression in response to decapitation. (A) Tiller number of cv. Bowman (wild-type) and int-c plants 2 weeks after decapitation. Bars represent means ±SD; n=3 replicates with ≥16 plants. Different letters indicate significant differences according to Tukey’s test (P<0.05). (B) Ratio of mRNA levels of INT-C and DRM1 in tiller buds between decapitated and non-decapitated plants. Relative mRNA abundance of INT-C mRNA was analyzed by real-time qRT–PCR. Bars represent means ±SD; n=4 biological replicates. Serine/threonine protein phosphatase HvPP2A-4 was used as a reference gene. Analyzed is the early transcriptional response within 24 h after decapitation.
Fig. 4.
Fig. 4.
INT-C expression responds to planting density. (A) Tiller number of wild-type and int-c plants grown at planting densities of one, five, or 10 plants per pot. Plants were analyzed 5 weeks after sowing. Bars represent means ±SD; n=3 replicates with ≥20 plants. Different letters indicate significant differences according to Tukey’s test (P<0.01). (B) Transcript levels of INT-C in the tiller bud tissue analyzed by real-time PCR at a density of one or 10 plants per pot. Bars represent means ±SD; n=3 biological replicates. Serine/threonine protein phosphatase HvPP2A-4 was used as a reference gene. The asterisk indicates a significant difference according to Student’s t-test at ∗P<0.001.
Fig. 5.
Fig. 5.
Effect of shading on tiller bud outgrowth and INT-C expression. (A) Tillering phenotype of wild-type and int-c plants grown under control conditions or shading. Red dots indicate the primary tillers. (B) Tiller number of wild-type and int-c plants grown under control or shade conditions. Bars represent means ±SD; three independent experiments with n≥35 plants each. Different letters indicate significant differences according to Tukey’s test (P<0.01). (C) Transcript levels of INT-C analyzed by qPCR, in buds of shaded plants, relative to levels in control plants. Bars represent means ±SD; n=3 biological replicates. Serine/threonine protein phosphatase PP2A-4 was used as a reference gene. Asterisks indicate significant differences according to Student’s t-test at ∗P<0.05. (D) ABA concentrations in tiller buds of wild-type and int-c plants 6 h after exposure to shade. Bars represent means ±SD of six independent biological replicates. Different letters indicate significant differences according to Tukey’s test (P<0.05).
Fig. 6.
Fig. 6.
Venn diagram of differentially expressed genes (DEGs) detected after shade treatment in cv. Bowman wild type (Wt shade) and int-c (int-c shade). These blocks were compared with DEGs detectable after decapitation (decap) in the int-c mutant and wild type (int-c versus WT). Numbers indicate transcript fold changes ≥2 at an FDR of P<0.05. (shade, INT-C mRNA induced; int-c, no functional INT-C; decap, INT-C mRNA reduced).
Fig. 7.
Fig. 7.
Working model for the dynamic balance of INT-C-dependent transcriptional programming to regulate tiller bud outgrowth in barley. Shade perception occurring in tiller buds activates the ‘master-switch’ transcription factor INT-C, thus altering INT-C-dependent target genes; among them is a set of up-regulated hormone and stress response genes and down-regulated cell division- and ribosome-related genes. The output of this transcriptional regulation mediates bud transition from outgrowth to arrest.

References

    1. Aguilar-Martínez JA, Poza-Carrión C, Cubas P.. 2007. Arabidopsis BRANCHED1 acts as an integrator of branching signals within axillary buds. The Plant Cell 19, 458–472. - PMC - PubMed
    1. Ballaré CL. 1999. Keeping up with the neighbours: phytochrome sensing and other signalling mechanisms. Trends in Plant Science 4, 201. - PubMed
    1. Braun N, de Saint Germain A, Pillot JP, et al. . 2012. The pea TCP transcription factor PsBRC1 acts downstream of strigolactones to control shoot branching. Plant Physiology 158, 225–238. - PMC - PubMed
    1. Bustin SA, Benes V, Garson JA, et al. . 2009. The MIQE guidelines: minimum information for publication of quantitative real-time PCR experiments. Clinical Chemistry 55, 611–622. - PubMed
    1. Casal JJ, Sanchez RA, Deregibus VA.. 1986. The effect of plant-density on tillering—the involvement of R/Fr ratio and the proportion of radiation intercepted per plant. Environmental and Experimental Botany 26, 365–371.

Publication types