. 2022 Jan:44:101091.
doi: 10.1016/j.ehb.2021.101091. Epub 2021 Dec 2.

Effectiveness of social distancing interventions in containing COVID-19 incidence: International evidence using Kalman filter

Affiliations

Effectiveness of social distancing interventions in containing COVID-19 incidence: International evidence using Kalman filter

Navendu Prakash et al. Econ Hum Biol. 2022 Jan.

Abstract

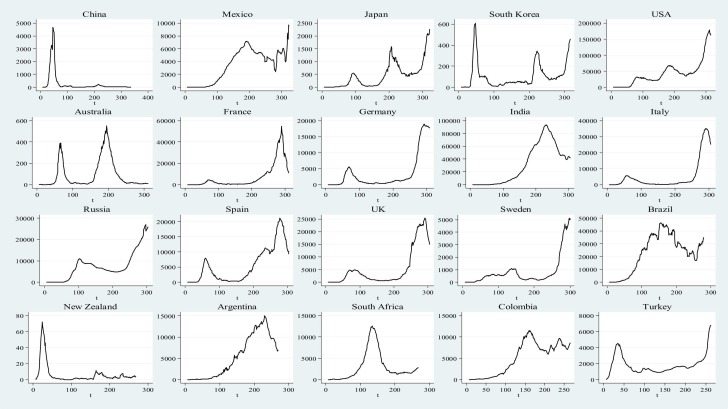
The epidemiological literature has widely documented the importance of social distancing interventions in containing the spread of the COVID-19 pandemic. However, the epidemiological measure of virus reproduction, R0, provides a myopic view of containment, especially when the absolute number of cases is still high. The paper investigates cross-country variations concerning the impact of social distancing interventions on COVID-19 incidence by employing a statistical measure of containment, which models the daily number of cases as a structural time-series, state-space vector. Countries that adopt strict lockdown policies and provide economic support in the form of income augmentations and debt relief improve the response towards the pandemic. Countries like China and South Korea have been most influential in containing the spread of infections. European nations of France, Italy, Spain and the UK are witnessing a second wave of the virus, indicating that re-opening the European economy perhaps has instigated an exponential spread.

Keywords: COVID-19; Economic epidemiology; Kalman filter; Non-pharmaceutical interventions; Pandemic; Social distancing.


Conflict of interest statement

The authors have no competing interests to declare.

Figures

Fig. 1
Fig. 1
7-day moving average of daily cases till November 30, 2020 Note: The above figure illustrates 7-day moving averages of daily reported cases. The horizontal axis measures the days relative to the onset of the outbreak. Countries are aligned in the order of when they report the first case.
Fig. 2
Fig. 2
7-day moving average of daily deaths till November 30, 2020 Note: The above figure illustrates 7-day moving averages of COVID-19 deaths. The horizontal axis measures the days relative to the onset of the outbreak. Countries are aligned in the order of when they report the first death.
Fig. 3
Fig. 3
Cumulative cases till November 30, 2020.
Fig. 4
Fig. 4
Precision of μt and zt Note: The above figure depicts 95% confidence intervals of the estimated level and slope parameters for all countries over the sampled timeframe. For some countries, the disturbances are non-Gaussian, which can also be insinuated from the fact that the point estimates of zt do not lie in the middle of their confidence intervals. Nevertheless, the QML estimation through the Kalman filter with robust standard errors still yields the MMLSE of the state vector, which is asymptotically consistent. For more details, see Appendix A.
Fig. 5
Fig. 5
Country-wise estimates of the state-space model across 90-day rolling windows. Note: The above figure depicts 95% confidence intervals of the level and slope estimates of the state-space model across 90-day rolling windows (R 1 to R9) to track country-specific movements over the course of the pandemic. Equally spaced windows (except the last one for each country) are constructed using 30-day increments. For non-converging models, the estimation was limited to 1000 iterations. For some countries, the disturbances are non-Gaussian, which can also be insinuated from the fact that the point estimates of zt do not lie in the middle of their confidence intervals. Nevertheless, the QML estimation through the Kalman filter with robust standard errors still yields the MMLSE of the state vector, which is asymptotically consistent. For more details, see Appendix A.
Fig. 5
Fig. 5
Country-wise estimates of the state-space model across 90-day rolling windows. Note: The above figure depicts 95% confidence intervals of the level and slope estimates of the state-space model across 90-day rolling windows (R 1 to R9) to track country-specific movements over the course of the pandemic. Equally spaced windows (except the last one for each country) are constructed using 30-day increments. For non-converging models, the estimation was limited to 1000 iterations. For some countries, the disturbances are non-Gaussian, which can also be insinuated from the fact that the point estimates of zt do not lie in the middle of their confidence intervals. Nevertheless, the QML estimation through the Kalman filter with robust standard errors still yields the MMLSE of the state vector, which is asymptotically consistent. For more details, see Appendix A.

References

    1. Alimohamadi Y., Naieni K.H., Sepandi M., Taghdir M. Effect of social distancing on Covid-19 incidence and mortality in Iran since February 20 to May 13, 2020: an interrupted time series analysis. Risk Manag. Healthc. Policy. 2020;13:1695–1700. - PMC - PubMed
    1. Alimohamadi Y., Taghdir M., Sepandi M. The estimate of the basic reproduction number for novel coronavirus disease (COVID-19): a systematic review and meta-analysis. J. Prev. Med. Public Health. 2020;53(3):151–157. - PMC - PubMed
    1. Anderson B., Moore J. Prentice Hall; Englewood Cliffs: 1979. Optimal Filtering.
    1. Arellano M., Bond S. Some tests of specification for panel data: Monte Carlo evidence and an application to employment equations. Rev. Econ. Stud. 1991;51:277–297.
    1. Barro R.J. National Bureau of Economic Research; 2020. Non-Pharmaceutical Interventions and Mortality in U.S. Cities During the Great Influenza Pandemic, 1918-1919 (WP27049) - PMC - PubMed

Publication types