. 2021 Dec 11;22(1):887.
doi: 10.1186/s12864-021-08147-3.

Interaction between Rag genes results in a unique synergistic transcriptional response that enhances soybean resistance to soybean aphids

Affiliations

Interaction between Rag genes results in a unique synergistic transcriptional response that enhances soybean resistance to soybean aphids

Martha I Natukunda et al. BMC Genomics. .

Abstract

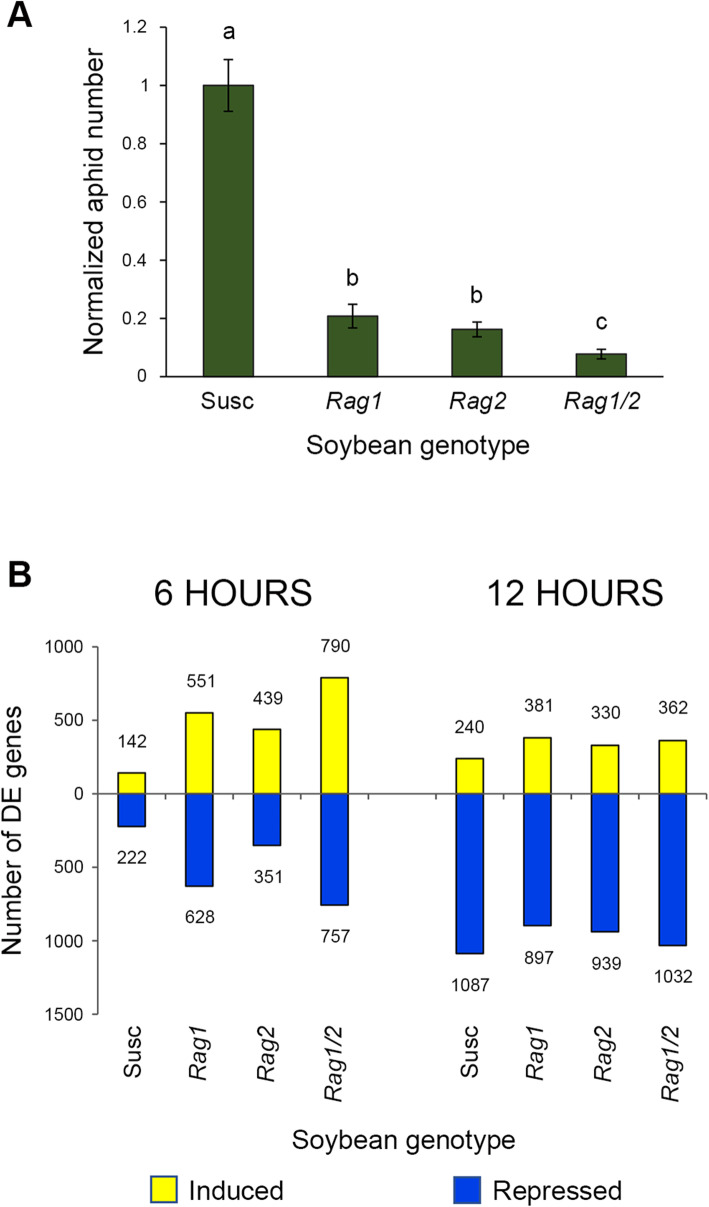
Background: Pyramiding different resistance genes into one plant genotype confers enhanced resistance at the phenotypic level, but the molecular mechanisms underlying this effect are not well-understood. In soybean, aphid resistance is conferred by Rag genes. We compared the transcriptional response of four soybean genotypes to aphid feeding to assess how the combination of Rag genes enhanced the soybean resistance to aphid infestation.

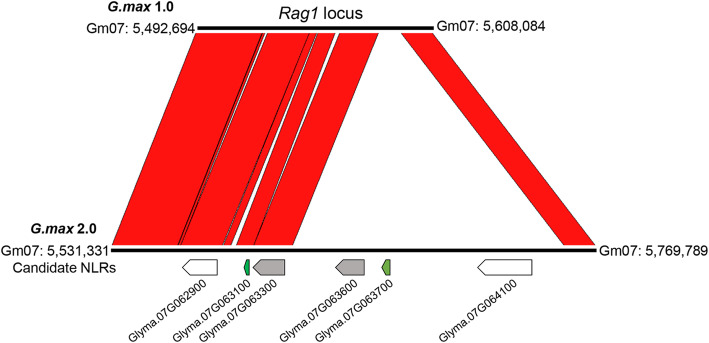
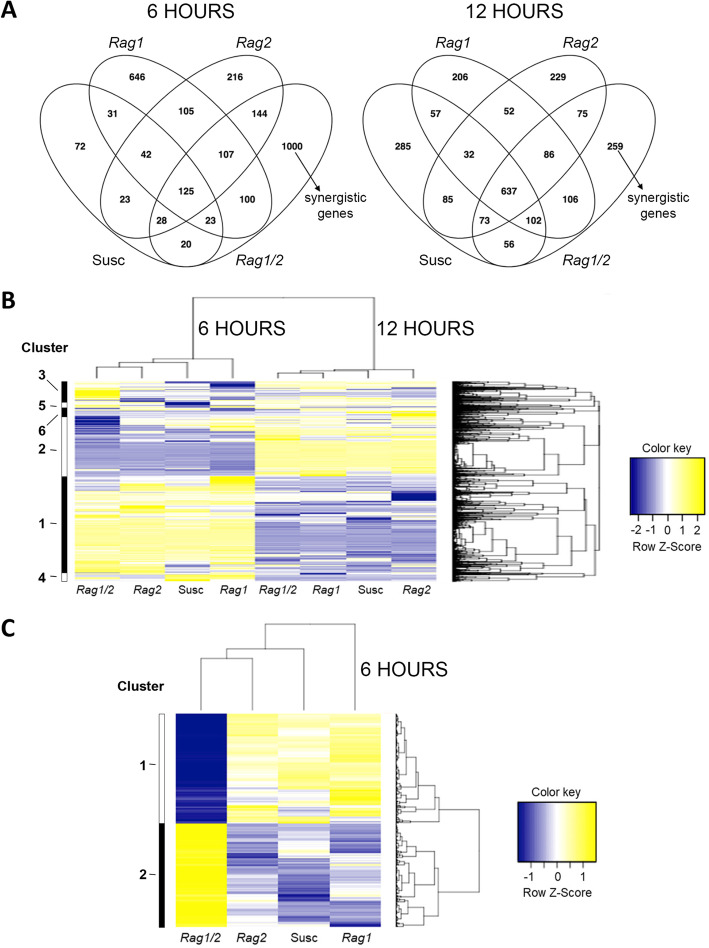
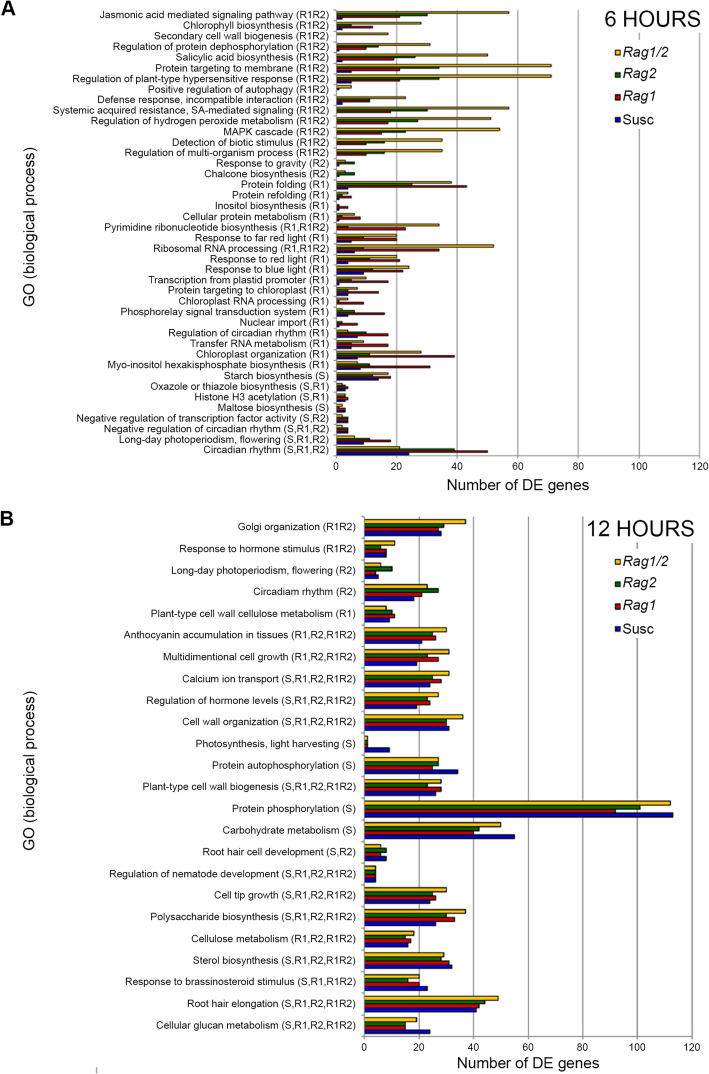
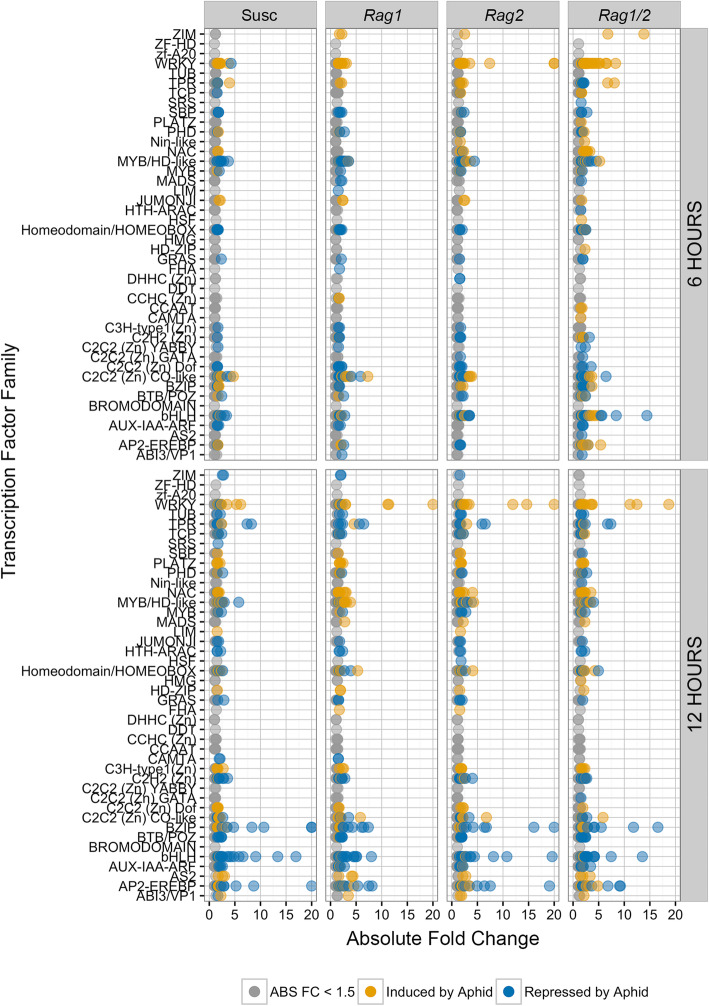
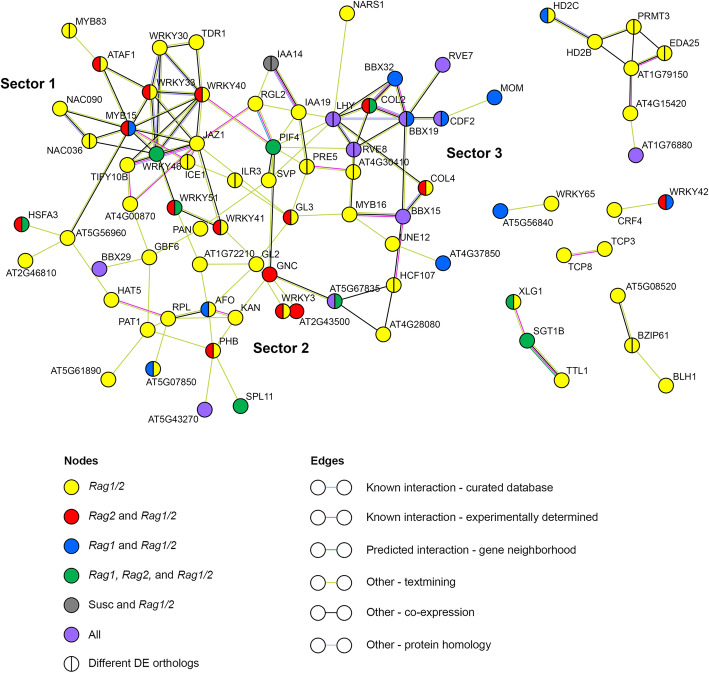
Results: A strong synergistic interaction between Rag1 and Rag2, defined as genes differentially expressed only in the pyramid genotype, was identified. This synergistic effect in the Rag1/2 phenotype was very evident early (6 h after infestation) and involved unique biological processes. However, the response of susceptible and resistant genotypes had a large overlap 12 h after aphid infestation. Transcription factor (TF) analyses identified a network of interacting TF that potentially integrates signaling from Rag1 and Rag2 to produce the unique Rag1/2 response. Pyramiding resulted in rapid induction of phytochemicals production and deposition of lignin to strengthen the secondary cell wall, while repressing photosynthesis. We also identified Glyma.07G063700 as a novel, strong candidate for the Rag1 gene.

Conclusions: The synergistic interaction between Rag1 and Rag2 in the Rag1/2 genotype can explain its enhanced resistance phenotype. Understanding molecular mechanisms that support enhanced resistance in pyramid genotypes could facilitate more directed approaches for crop improvement.

Keywords: Aphid resistance; Gene pyramiding; RNA sequencing; Rag genes; Soybean; Soybean aphids; Synergistic effect.


Conflict of interest statement

The authors declare that they have no competing interests.

Figures

Fig. 1
Fig. 1
A. aphid resistance phenotypes of the genotypes used in this study. Phenotyping results for the four soybean genotypes obtained using no-choice experiments conducted in growth chambers. Data was normalized to the susceptible control, IA3027. Statistical data analysis for each comparison was done using Student’s t-tests (Two-Sample Assuming Unequal Variances). Error bars represent the standard error. Different letters indicate statistically significant differences (p < 0.05). B. Global changes in the soybean transcriptional response to aphids. Total number of DE genes for aphid versus mock comparisons for each soybean genotype at each time point is shown as induced genes (positive fold change) and repressed genes (negative fold change). Total number of induced and repressed genes for each comparison are indicated next to each of the bars
Fig. 2
Fig. 2
Comparison of the Rag1 locus in versions 1 and 2 of the Williams 82 genome. The top line represents the sequence of the Rag1 locus in version 1 of the soybean genome as reported by Kim et al. (2010). The bottom line represents the Rag1 locus in version 2 of the Williams 82 genome assembly. Conserved regions are represented by red shading. Candidate NLRs are represented as arrows and color-coded as follows: not differentially expressed (white), expressed more in the susceptible genotype (grey) or expressed more in the resistant genotypes (green)
Fig. 3
Fig. 3
The pyramid genotype has a unique transcriptome response. A. DE genes in each genotype after aphid infestation for 6 h (left) and 12 h (right) unique to each genotype or shared among different genotypes. The DE genes unique to the Rag1/2 response were designated as the “synergistic genes” set. B. Clustering heatmap showing expression patterns for the 4646 genes differentially expressed after aphid infestation in any genotype after 6 h or 12 h. Each column represents the aphid versus mock comparison for each soybean genotype and time point combination. Each row represents a gene. Genes included in this figure are differentially expressed for at least one comparison. Z-scores were calculated for each gene in all comparisons. Soybean genotypes are designated as: Sus: Susceptible, R1: Rag1, R2: Rag2, and R1R2: Rag1/2. C. Heatmap corresponding to the 1000 genes differentially expressed exclusively in the pyramid genotype at 6 h after aphid infestation, referred in the text as the synergistic response
Fig. 4
Fig. 4
Distinct biological processes are regulated early in the pyramid response to aphids. Comparison of GO terms for biological processes significantly modified after 6 h (A) or 12 h (B) of infestation by soybean aphids in the susceptible (blue bars), Rag1 (red bars), Rag2 (green bars) and Rag1/2 (yellow bars) soybean genotypes. On the Y axis, soybean genotypes for which specific GO terms (biological process) were significantly overrepresented (p ≤ 0.05) are indicated in parenthesis. S: Susceptible, R1: Rag1, R2: Rag2, and R1R2: Rag1/2
Fig. 5
Fig. 5
The pyramid response includes a large number of transcription factors (TF). Expression patterns of TF that were differentially expressed between aphid-treated and mock-treated samples for each soybean genotype at both time points were plotted (with and absolute fold change larger than 1.5). The x axis indicates absolute fold change in gene expression, and the y axis shows TF families. Several differentially expressed transcription factors per family are plotted for each comparison
Fig. 6
Fig. 6
Transcription factor networks in the 6 h pyramid response are regulated by Rag1 and Rag2. Protein-protein interaction network for TF differentially regulated in the Rag1/2 genotype after 6 h of aphid infestation. The network was built using the closest Arabidopsis homolog for each soybean TF. Colors indicate whether each TF was DE in the pyramid only or in the pyramid and other genotypes in the 6 h response. Split circles indicate more than one soybean homolog corresponding to the same Arabidopsis TF

References

    1. Kourelis J, van der Hoorn RAL. Defended to the nines: 25 years of resistance gene cloning identifies nine mechanisms for R protein function. Plant Cell. 2018;30(2):285–299. doi: 10.1105/tpc.17.00579. - DOI - PMC - PubMed
    1. Upson JL, Zess EK, Białas A, C-h W, Kamoun S. The coming of age of EvoMPMI: evolutionary molecular plant–microbe interactions across multiple timescales. Curr Opin Plant Biol. 2018;44:108–116. doi: 10.1016/j.pbi.2018.03.003. - DOI - PubMed
    1. Cui H, Tsuda K, Parker JE. Effector-triggered immunity: from pathogen perception to robust defense. Annu Rev Plant Biol. 2015;66(1):487–511. doi: 10.1146/annurev-arplant-050213-040012. - DOI - PubMed
    1. Lachowiec J, Queitsch C, Kliebenstein DJ. Molecular mechanisms governing differential robustness of development and environmental responses in plants. Ann Bot. 2015;117(5):795–809. doi: 10.1093/aob/mcv151. - DOI - PMC - PubMed
    1. Wu C-H, Abd-El-Haliem A, Bozkurt TO. Belhaj K, Terauchi R, Vossen JH, Kamoun S. NLR network mediates immunity to diverse plant pathogens. Proc Natl Acad Sci. 2017;114(30):8113–8118. doi: 10.1073/pnas.1702041114. - DOI - PMC - PubMed

LinkOut - more resources