. 2021 Dec 11;11(1):203.
doi: 10.1186/s13578-021-00706-1.

Single-cell RNA-sequencing reveals distinct immune cell subsets and signaling pathways in IgA nephropathy

Affiliations

Single-cell RNA-sequencing reveals distinct immune cell subsets and signaling pathways in IgA nephropathy

Honghui Zeng et al. Cell Biosci. .

Abstract

Background: IgA nephropathy (IgAN) is the most common primary glomerulonephritis globally. Increasing evidence suggests the importance of host immunity in the development of IgAN, but its dynamics during the early stage of IgAN are still largely unclear.

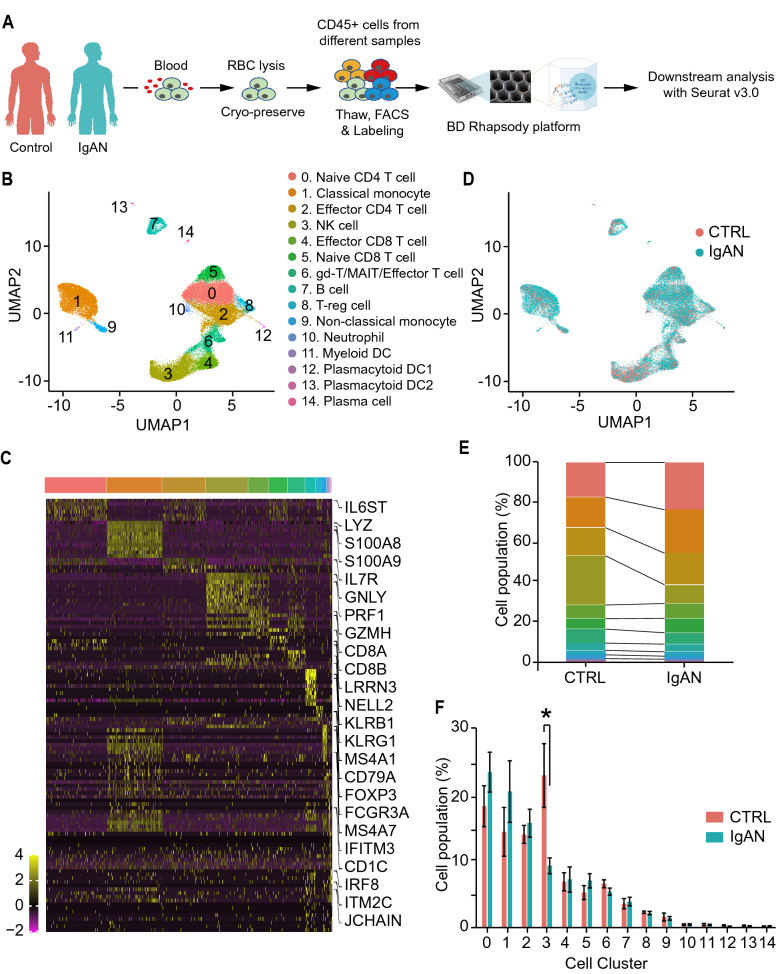
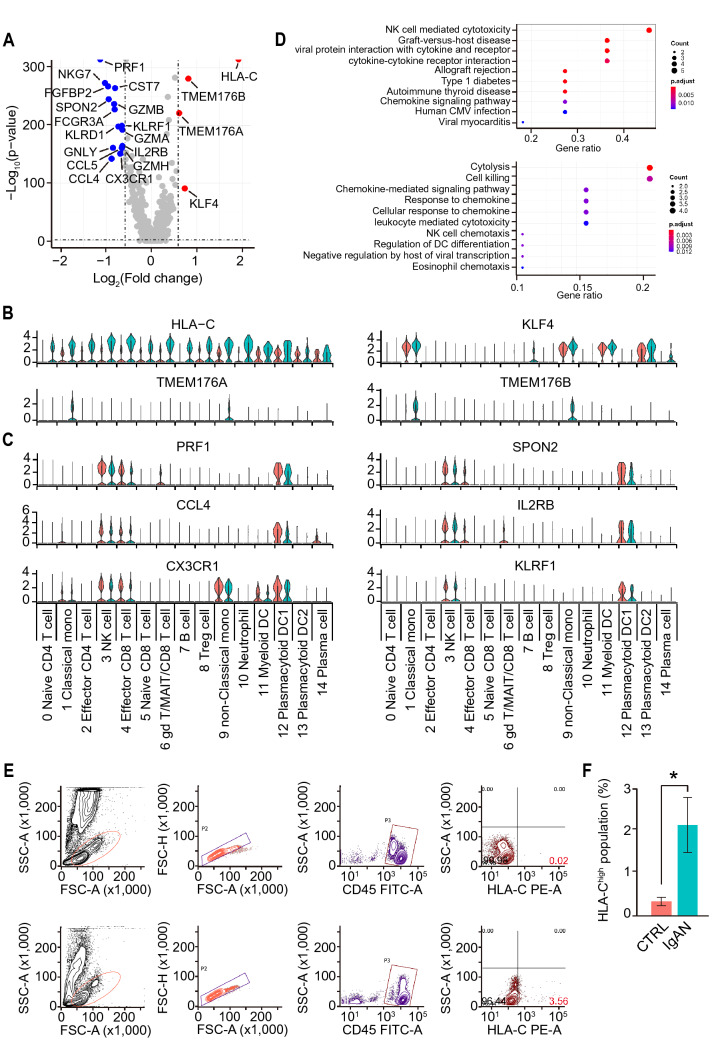
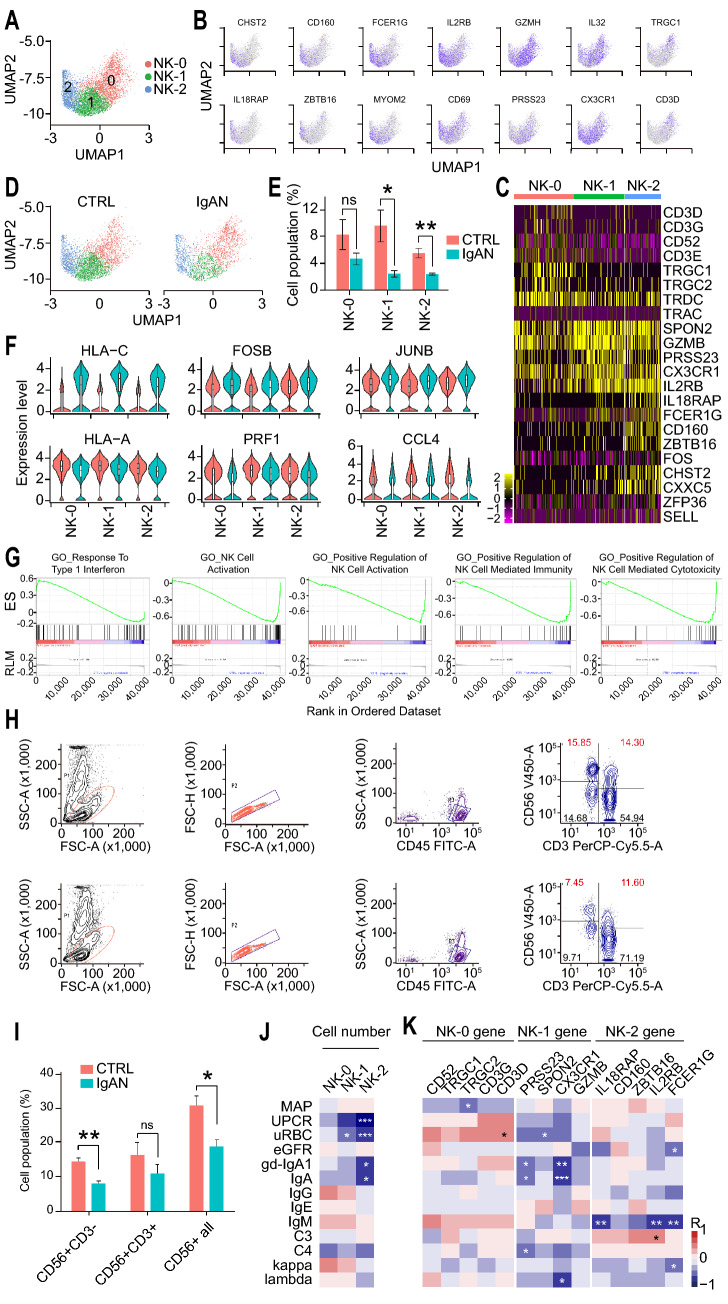
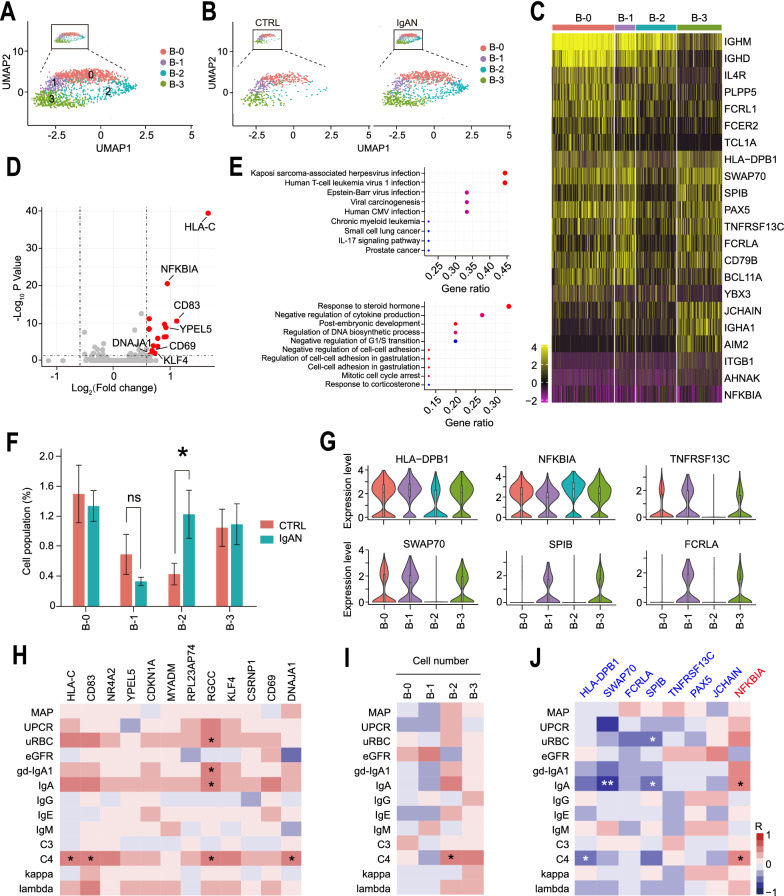
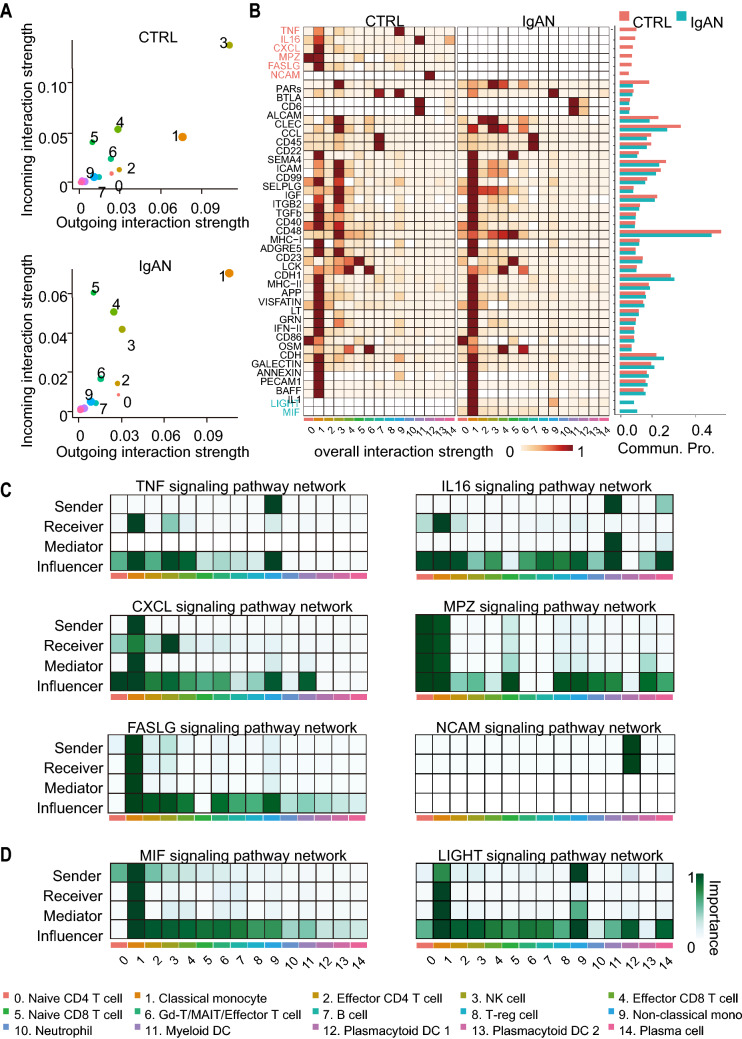
Results: Here we successfully resolved the early transcriptomic changes in immune cells of IgAN by conducting single-cell RNA-sequencing (scRNA-seq) with peripheral blood mononuclear cells. The differentially expressed genes (DEGs) between control and IgAN were predominantly enriched in NK cell-mediated cytotoxicity and cell killing pathways. Interestingly, we discovered that the number and cytotoxicity of NK cells are significantly reduced in IgAN patients, where both the number and marker genes of NK cells were negatively associated with the clinical parameters, including the levels of urine protein creatinine ratio (UPCR), serum galactose-deficient IgA1 and IgA. A distinctive B cell subset, which had suppressed NFκB signaling was predominantly in IgAN and positively associated with disease progression. Moreover, the DEGs of B cells were enriched in different viral infection pathways. Classical monocytes also significantly changed in IgAN and a monocyte subset expressing interferon-induced genes was positively associated with the clinical severity of IgAN. Finally, we identified vast dynamics in intercellular communications in IgAN.

Conclusions: We dissected the immune landscape of IgAN at the single-cell resolution, which provides new insights in developing novel biomarkers and immunotherapy against glomerulonephritis.

Keywords: B cells; IgA nephropathy; Immune cell landscape; Monocytes; Natural killer cells; Single-cell RNA seq.


Conflict of interest statement

The authors declare no conflict of interest.

Figures

Fig. 1
Fig. 1
Single-cell landscape of peripheral blood mononuclear cells (PBMCs) from healthy control donors and IgAN patients. A Schematic flowchart of scRNA-seq experimental design of this study. Control (CTRL) n = 6; IgAN n = 10. B, C UMAP illustration of integrated scRNA-seq data from CTRL and IgAN colored by cell-type annotation (B) and cells of origin (C). D Heatmap of top ten marker genes of each cell cluster. E Stacked bar graphs of the cell-type composition in PBMCs from CTRL and IgAN. F Bar graphs of each cell cluster population between CTRL and IgAN. CTRL n = 6; IgAN n = 10; Mean ± SEM; *p < 0.05
Fig. 2
Fig. 2
scRNA-seq discovered the differentially expressed genes (DEGs) in PBMCs from control and IgAN. A Volcano plot of both up- (Red circles) and down-regulated (Blue circles) DEGs in IgAN PBMCs compared with those in CTRL. B, C Violin plots of the up- (B) and down-regulated (C) DE genes in each cell cluster from CTRL (Red violin) and IgAN (Blue violin). D KEGG pathway (Upper) and GO enrichment (Lower) analysis of both up-regulated and down-regulated DEGs. E Flow cytometry validation of HLA-Chigh PBMCs from CTRL (Upper) and IgAN (Lower). F Statistical analysis of HLA-Chigh PBMCs from CTRL and IgAN. CTRL n = 7; IgAN n = 12; Mean ± SEM; *p < 0.01
Fig. 3
Fig. 3
scRNA-seq revealed a decreased number and impaired function of NK cells in IgAN. A UMAP illustration of refined NK cell clusters from CTRL and IgAN annotated by their markers genes: NK-0 (Red circles), NK-1 (Green circles), NK-2 (Blue circles). B Representative feature plots of the marker genes for NK cell subset annotation. C Heatmap of the marker genes contributed from each NK cell subsets. D Individual UMAP illustration of NK cells by cells of origin. E Statistical analysis of each NK cell subset between CTRL and IgAN. CTRL n = 6; IgAN n = 10; Mean ± SEM; *p < 0.05, **p < 0.01. F Violin plots of the DEGs in each NK cell subset between CTRL (Red violin) and IgAN (Blue violin). G Enrichment plots from gene set enrichment analysis (GSEA) of GO categories in NK cells between CTRL and IgAN. H Flow cytometry validation of the CD56 + CD3 ± NK cells in CTRL and IgAN. I Statistical analysis of the cell percentage of CD56 + CD3-, CD56 + CD3 + , and total CD56 + cells between CTRL (Red) and IgAN (Blue). CTRL n = 4; IgAN n = 4; Mean ± SEM; *p < 0.05; **p < 0.01. J Heatmap of the Spearman correlation of IgAN clinical parameters with the cell numbers of each NK subset. Red and blue boxes indicate positive and negative correlations, respectively. *p < 0.05; ***p < 0.001. L Heatmap of the Spearman correlation of IgAN clinical parameters with the expression levels of marker genes in each NK subset. Red and blue boxes indicate positive and negative correlations, respectively. *p < 0.05; **p < 0.01; ***p < 0.001
Fig. 4
Fig. 4
scRNA-seq identified candidate genes and pathways of B cells associated with IgAN. A UMAP illustration of refined B cell clusters annotated by their transcriptomic profiles: B-0 (Red circles), B-1 (Purple circles), B-2 (Blue circles), B-3 (Green circles). B Individual UMAP illustrations showing the refined B cell clusters from CTRL and IgAN. C Heatmap of the marker genes contributed from each B cell subset. D Volcano plot showing the up-regulated DEGs in IgAN B cells compared with that in CTRL. E KEGG pathway (Upper) and GO enrichment (Lower) analysis of the DE genes in CTRL and IgAN B cells. F Statistical analysis of each B cell subset between CTRL and IgAN. CTRL n = 6; IgAN n = 10; Mean ± SEM, *p < 0.05. G Representative violin plots of the marker genes in B cell subsets from CTRL and IgAN. HJ Heatmap of the Spearman correlation of IgAN clinical parameters with the expression levels of DEGs (H), the numbers of each B cell subset (I), and the marker genes of B-2 subset (J). Red and blue boxes indicate positive and negative correlations, respectively. *p < 0.05; **p < 0.01
Fig. 5
Fig. 5
scRNA-seq identified DE genes of classical monocytes closely associated with the clinical parameters of IgAN. A UMAP illustration of refined monocyte cell clusters from CTRL and IgAN annotated by their marker genes: cMono-0 (Red circles), cMono-1 (Green circles), cMono-2 (Blue circles), cMono-3 (Purple circles). B Heatmap of the marker genes contributed from each classical monocyte subsets. C Individual UMAP illustration of classical monocytes by cells of origin. D Statistical analysis of each classical monocyte subset between CTRL and IgAN. CTRL n = 6; IgAN n = 10; Mean ± SEM. E Volcano plot showing both up- (Red circles) and down-regulated (Blue circles) DE genes in IgAN classical monocytes compared with that in CTRL. F, G Representative violin plots of newly discovered (F) and previously reported (G) DEGs in IgAN classical monocytes. H Heatmap of the Spearman correlation of IgAN clinical parameters with the expression levels of up- (Red circles) and down-regulated (Blue circles) DEGs in classical monocytes. Red and blue boxes indicate positive and negative correlations, respectively. *p < 0.05; **p < 0.01
Fig. 6
Fig. 6
CellChat analysis of the intercellular communication networks in PBMCs from CTRL and IgAN. A Scatter plots of the incoming and outgoing interaction strengths in each cluster of CTRL (Upper) and IgAN (Lower). B Heatmap shows the relative communication strength of the inferred signaling pathways in each cluster of CTRL and IgAN. The bar graph shows the overall information flow in each cluster of CTRL and IgAN. The signaling pathways colored by red and blue are enriched in CTRL and IgAN, respectively. C, D Relative contribution heatmaps of the dominant sender, receiver, mediator, and influencer in the inferred signaling pathways enriched in CTRL (C) and IgAN (D), respectively

References

    1. Lai KN, Tang SCW, Schena FP, Novak J, Tomino Y, Fogo AB, et al. IgA nephropathy. Nat Rev Dis Prim. 2016;2:16001. doi: 10.1038/nrdp.2016.1. - DOI - PubMed
    1. Roberts ISD. Pathology of IgA nephropathy. Nat Rev Nephrol. 2014;8:445–454. doi: 10.1038/nrneph.2014.92. - DOI - PubMed
    1. Wyatt RJ, Julian BA. MEdical progress: IgA nephropathy. N Engl J Med. 2013;368(25):2402–2414. doi: 10.1056/NEJMra1206793. - DOI - PubMed
    1. Rodrigues JC, Haas M, Reich HN. IgA Nephropathy epidemiology of IgA Nephropathy. Clin J Am Soc Nephrol. 2017;12(4):677–686. doi: 10.2215/CJN.07420716. - DOI - PMC - PubMed
    1. Suzuki H, Kiryluk K, Novak J, Moldoveanu Z, Herr AB, Renfrow MB, et al. The pathophysiology of IgA nephropathy. J Am Soc Nephrol. 2011;10:1795–1803. doi: 10.1681/ASN.2011050464. - DOI - PMC - PubMed

LinkOut - more resources