

COVID-19 wastewater epidemiology: a model to estimate infected populations
- PMID: 34895497
- PMCID: PMC8654376
- DOI: 10.1016/S2542-5196(21)00230-8
COVID-19 wastewater epidemiology: a model to estimate infected populations
Abstract
Background: Wastewater-based epidemiology provides an opportunity for near real-time, cost-effective monitoring of community-level transmission of SARS-CoV-2. Detection of SARS-CoV-2 RNA in wastewater can identify the presence of COVID-19 in the community, but methods for estimating the numbers of infected individuals on the basis of wastewater RNA concentrations are inadequate.
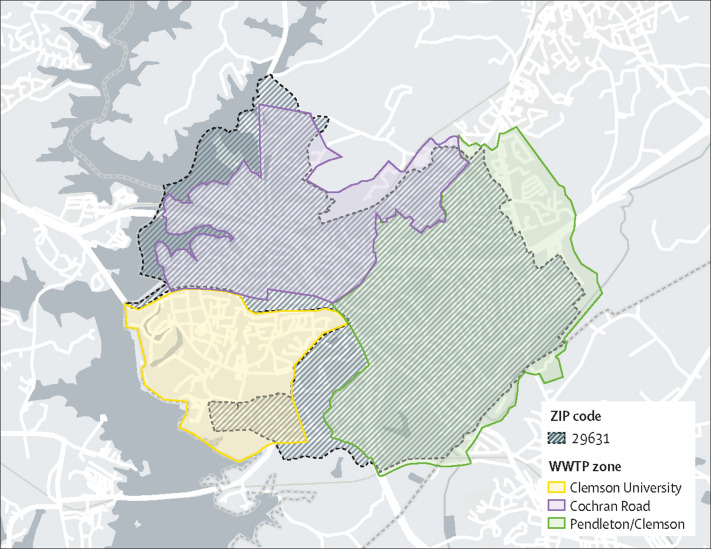
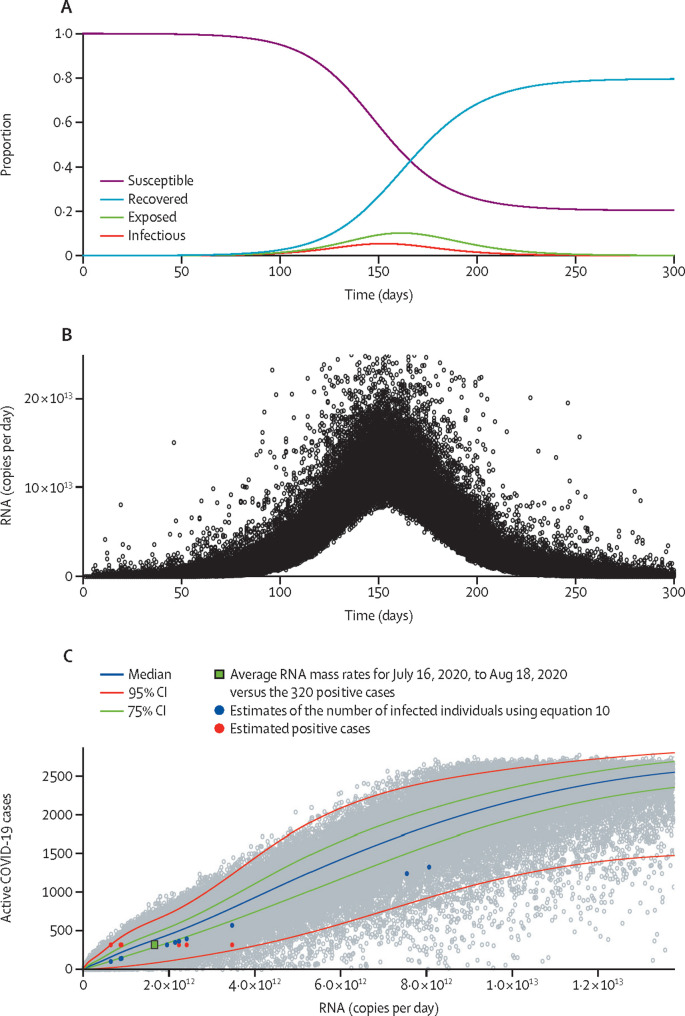
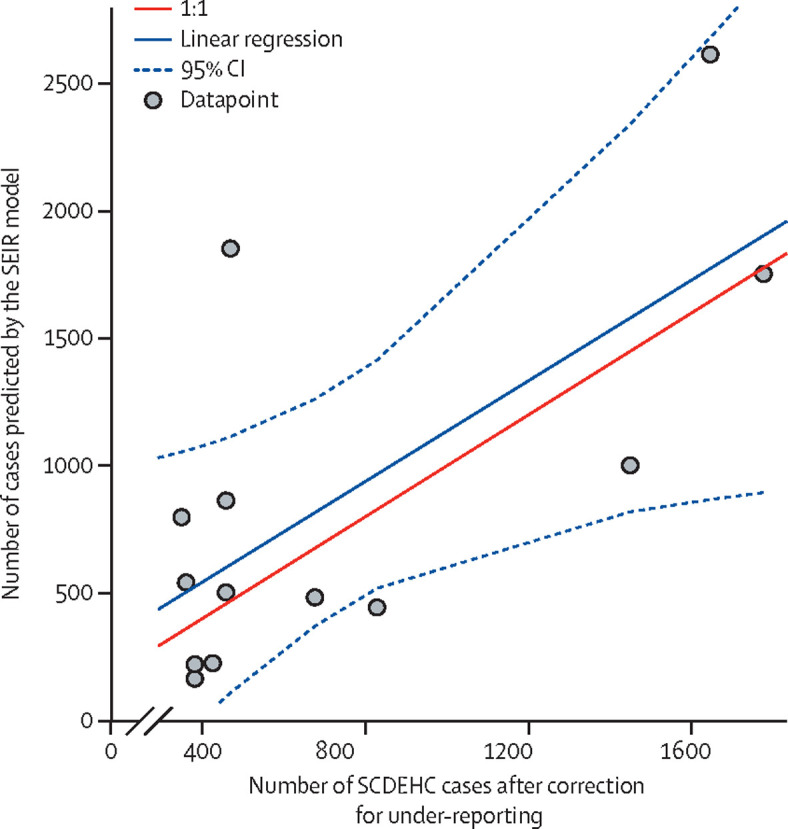
Methods: This is a wastewater-based epidemiology study using wastewater samples that were collected weekly or twice a week from three sewersheds in South Carolina, USA, between either May 27 or June 16, 2020, and Aug 25, 2020, and tested for SARS-CoV-2 RNA. We developed a susceptible-exposed-infectious-recovered (SEIR) model based on the mass rate of SARS-CoV-2 RNA in the wastewater to predict the number of infected individuals, and have also provided a simplified equation to predict this. Model predictions were compared with the number of confirmed cases identified by the Department of Health and Environmental Control, South Carolina, USA, for the same time period and geographical area.
Findings: We plotted the model predictions for the relationship between mass rate of virus release and numbers of infected individuals, and we validated this prediction on the basis of estimated prevalence from individual testing. A simplified equation to estimate the number of infected individuals fell within the 95% confidence limits of the model. The rate of unreported COVID-19 cases, as estimated by the model, was approximately 11 times that of confirmed cases (ie, ratio of estimated infections for every confirmed case of 10·9, 95% CI 4·2-17·5). This rate aligned well with an independent estimate of 15 infections for every confirmed case in the US state of South Carolina.
Interpretation: The SEIR model provides a robust method to estimate the total number of infected individuals in a sewershed on the basis of the mass rate of RNA copies released per day. This approach overcomes some of the limitations associated with individual testing campaigns and thereby provides an additional tool that can be used to inform policy decisions.
Funding: Clemson University, USA.
Copyright © 2021 The Author(s). Published by Elsevier Ltd. This is an Open Access article under the CC BY-NC-ND 4.0 license. Published by Elsevier Ltd.. All rights reserved.
Conflict of interest statement
Declaration of interests We declare no competing interests.
Figures
Comment in
-
Wastewater surveillance: an effective and adaptable surveillance tool in settings with a low prevalence of COVID-19.Lancet Planet Health. 2022 Feb;6(2):e87-e88. doi: 10.1016/S2542-5196(22)00009-2. Lancet Planet Health. 2022. PMID: 35150632 Free PMC article. No abstract available.
References
Publication types
MeSH terms
Substances
LinkOut - more resources
Full Text Sources
Medical
Miscellaneous
