

SARS-CoV-2 genome quantification in wastewaters at regional and city scale allows precise monitoring of the whole outbreaks dynamics and variants spreading in the population
- PMID: 34896511
- PMCID: PMC8656174
- DOI: 10.1016/j.scitotenv.2021.152213
SARS-CoV-2 genome quantification in wastewaters at regional and city scale allows precise monitoring of the whole outbreaks dynamics and variants spreading in the population
Abstract
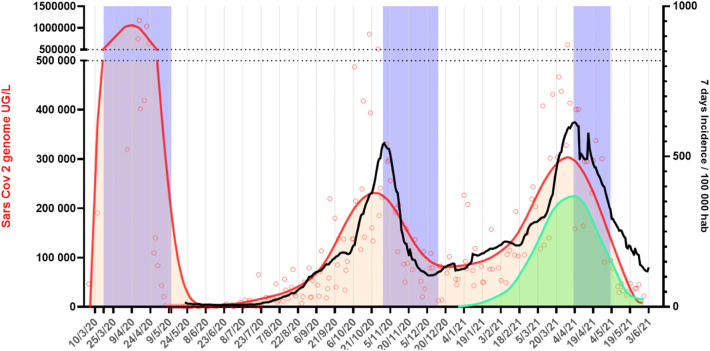
SARS-CoV-2 is a coronavirus causing a globalized outbreak called COVID-19. SARS-CoV-2 transmission is associated with inhalation of contaminated respiratory droplets and could causes severe complications. Until today several "waves" of infections have been observed despite implementation of strict health policies. Decisions for such sanitary measures are based on population health monitoring. Unfortunately, for COVID-19, a significant proportion of individuals are asymptomatic but play a role in the virus transmission. To overcome these limitations, several strategies were developed including genome quantification in wastewater that could allow monitoring of the health status of population, since shedding of SARS-CoV-2 in patient stool is frequent. Wastewater-based epidemiology (WBE) was established and several countries implemented this approach to allow COVID-19 outbreak monitoring. In France, the OBEPINE project performed a quantitative analysis of SARS-CoV-2 in raw wastewater samples collected from major wastewater treatment plants (WWTP) since March 2020. In the greater Paris area 1101 samples (507 for five WWTP and 594 for sewer) were collected. This 16 months monitoring allows us to observe the outbreak dynamics. Comparison of WBE indicators with health data lead to several important observation; the good level of correlation with incidence rates, the average 3 days lead time, and the sensitivity (WBE change when incidence is > to 7/100000 inhabitants). We also compared the local monitoring (city level) with the regional monitoring, to help cluster identification. Moreover, variants of concern (VOC) emerged due to the selection pressure. We developed a specific RT-qPCR method targeting the deletion H69-V70 in the spike protein, using this deletion as a proxy of the B.1.1.7 presence in the wastewater. With this data we demonstrate the predominant role played by this strain in the third wave. All these results allow a better description and understanding of the pandemic and highlight the role of such WBE indicators.
Keywords: COVID-19; Epidemiology; Quantification; RT-qPCR; SARS-CoV-2; Variant monitoring; Wastewater.
Copyright © 2021 Elsevier B.V. All rights reserved.
Conflict of interest statement
Declaration of competing interest The authors declare that they have no known competing financial interests or personal relationships that could have appeared to influence the work reported in this paper.
Figures


References
-
- Ahmed W., Angel N., Edson J., Bibby K., Bivins A., O’Brien J.W., Choi P.M., Kitajima M., Simpson S.L., Li J., Tscharke B., Verhagen R., Smith W.J.M., Zaugg J., Dierens L., Hugenholtz P., Thomas K.V., Mueller J.F. First confirmed detection of SARS-CoV-2 in untreated wastewater in Australia: a proof of concept for the wastewater surveillance of COVID-19 in the community. Sci. Total Environ. 2020;728 doi: 10.1016/j.scitotenv.2020.138764. - DOI - PMC - PubMed
-
- Ahmed W., Bivins A., Bertsch P.M., Bibby K., Choi P.M., Farkas K., Gyawali P., Hamilton K.A., Haramoto E., Kitajima M., Simpson S.L., Tandukar S., Thomas K., Mueller J.F. Surveillance of SARS-CoV-2 RNA in wastewater: methods optimisation and quality control are crucial for generating reliable public health information. Curr. Opin. Environ. Sci. Health. 2020 doi: 10.1016/j.coesh.2020.09.003. - DOI - PMC - PubMed
-
- Ahmed W., Tscharke B., Bertsch P.M., Bibby K., Bivins A., Choi P., Clarke L., Dwyer J., Edson J., Nguyen T.M.H., O’Brien J.W., Simpson S.L., Sherman P., Thomas K.V., Verhagen R., Zaugg J., Mueller J.F. SARS-CoV-2 RNA monitoring in wastewater as a potential early warning system for COVID-19 transmission in the community: a temporal case study. Sci. Total Environ. 2021;761 doi: 10.1016/j.scitotenv.2020.144216. - DOI - PMC - PubMed
MeSH terms
Substances
Supplementary concepts
LinkOut - more resources
Full Text Sources
Medical
Miscellaneous
