. 2022 Mar 3;220(3):iyab229.
doi: 10.1093/genetics/iyab229.

Efficient ancestry and mutation simulation with msprime 1.0

Affiliations

Efficient ancestry and mutation simulation with msprime 1.0

Franz Baumdicker et al. Genetics. .

Abstract

Stochastic simulation is a key tool in population genetics, since the models involved are often analytically intractable and simulation is usually the only way of obtaining ground-truth data to evaluate inferences. Because of this, a large number of specialized simulation programs have been developed, each filling a particular niche, but with largely overlapping functionality and a substantial duplication of effort. Here, we introduce msprime version 1.0, which efficiently implements ancestry and mutation simulations based on the succinct tree sequence data structure and the tskit library. We summarize msprime's many features, and show that its performance is excellent, often many times faster and more memory efficient than specialized alternatives. These high-performance features have been thoroughly tested and validated, and built using a collaborative, open source development model, which reduces duplication of effort and promotes software quality via community engagement.

Keywords: Ancestral Recombination Graphs; coalescent; mutations; simulation.


Figures

Figure 1
Figure 1
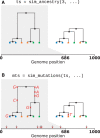
Visualization of the separation between ancestry and mutation simulation. (A) The result of an invocation of sim_ancestry is two trees along a 1 kb chunk of genome relating three diploid samples. Each diploid individual consists of two genomes (or nodes), indicated by color. (B) This ancestry is provided as the input to sim_mutations, which adds mutations. Graphics produced using tskit’s draw_svg method.
Figure 2
Figure 2
An example tree sequence describing genealogies and sequence variation for four samples at 10 sites on a chromosome of 20 bases long. Information is stored in a set of tables (the tables shown here include only essential columns, and much more information can be associated with the various entities). The node table stores information about sampled and ancestral genomes. The edge table describes how these genomes are related along a chromosome, and defines the genealogical tree at each position. The site and mutation tables together describe sequence variation among the samples. The genotype matrix and tree topologies shown on the left are derived from these tables.
Figure 3
Figure 3
Time required to run sim_mutations on tree sequences generated by sim_ancestry (with a population size of 104 and recombination rate of 108) for varying (haploid) sample size and sequence length. We ran 10 replicate mutation simulations each for three different mutation rates, and report the average CPU time required (Intel Core i7-9700). (A) Holding sequence length fixed at 10 megabases and varying the number of samples (tree tips) from 10 to 100,000. (B) Holding number of samples fixed at 1000, and varying the sequence length from 1 to 100 megabases.
Figure 4
Figure 4
Comparison of simulation performance using msprime (sim_ancestry), SimBac, and fastSimBac for varying (haploid) sample sizes, and the current estimates for E. coli parameters (Lapierre et al. 2016): a 4.6 Mb genome, Ne=1.8×10⁸, gene conversion rate of 8.9×10¹¹ per base and mean tract length of 542. We report (A) the total CPU time and (B) maximum memory usage averaged over five replicates (Intel Xeon E5-2680 CPU). We did not run SimBac beyond first two data points because of the very long running times.
Figure 5
Figure 5
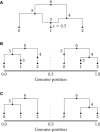
(A) A simple ARG in which a recombination occurs at position 0.3; (B) the equivalent topology depicted as a tree sequence, including the recombination node; (C) the same tree sequence topology “simplified” down to its minimal tree sequence representation. Note the original node IDs have been retained for clarity.
Figure 6
Figure 6
Comparison of selective sweep simulation performance in msprime (sim_ancestry) and discoal (Intel Xeon Gold 6148 CPU). We report the average CPU time and maximum memory usage when simulating three replicates for 100 diploid samples in a model with a single selective sweep in its history, where the beneficial allele had a selection coefficient of s =0.05, a per-base recombination rate of 108, population size of N=104, and sequence length varying from 100 kb–3000 kb.
Figure 7
Figure 7
Comparison of DTWF simulation performance in msprime (sim_ancestry) and ARGON (Intel Xeon E5-2680 CPU). We ran simulations with a population size of 104 and recombination rate of 108, with 500 diploid samples and varying sequence length. We report (A) total CPU time and (B) maximum memory usage; each point is the average over five replicate simulations. We show observations for ARGON, msprime’s DTWF implementation (“DTWF”) and a hybrid simulation of 100 generations of the DTWF followed by the standard coalescent with recombination (“Hybrid”). We ran ARGON with a mutation rate of 0 and with minimum output options, with a goal of measuring only ancestry simulation time. Memory usage for msprime’s DTWF and hybrid simulations are very similar.
Figure 8
Figure 8
Running time of sim_ancestry for (A) small and (B) larger simulations on an Intel i7-6600U CPU. Each point is the run time of one simulation, for various values of effective population size (Ne), chromosome length in Morgans (L), and number of diploid samples (n). Run time scales quadratically with the product of Ne and L, shown on the horizontal axis. For example, (A) shows that 1000 samples of 1 Morgan-length chromosomes from a population of Ne=2,000 diploids would take about 2 s, and (equivalently) that the same number of 0.01 Morgan segments with Ne=200,000 would take the same time. Since recombination rate in these simulations was 108, L is the number of base pairs divided by 108. The black lines are quadratic fits separately in each panel and sample size. Vertical gray lines show the approximate values of NeL for chromosome 1 in three species, using values from the stdpopsim catalog (Adrion et al. 2020a).

Similar articles

Cited by

References

    1. Adrion JR, Cole CB, Dukler N, Galloway JG, Gladstein AL, et al.2020a. A community-maintained standard library of population genetic models. Elife. 9:e54967. - PMC - PubMed
    1. Adrion JR, Galloway JG, Kern AD.. 2020b. Predicting the landscape of recombination using deep learning. Mol Biol Evol. 37:1790–1808. - PMC - PubMed
    1. Arenas M. 2012. Simulation of molecular data under diverse evolutionary scenarios. PLoS Comput Biol. 8:e1002495. - PMC - PubMed
    1. Arenas M, Posada D.. 2007. Recodon: coalescent simulation of coding DNA sequences with recombination, migration and demography. BMC Bioinformatics. 8:458. - PMC - PubMed
    1. Árnason E. 2004. Mitochondrial cytochrome b DNA variation in the high-fecundity Atlantic cod: trans-Atlantic clines and shallow gene genealogy. Genetics. 166:1871–1885. - PMC - PubMed

Publication types