. 2022 Jan 11;50(1):92-107.
doi: 10.1093/nar/gkab1177.

Dynamic modulation of enhancer responsiveness by core promoter elements in living Drosophila embryos

Affiliations

Dynamic modulation of enhancer responsiveness by core promoter elements in living Drosophila embryos

Moe Yokoshi et al. Nucleic Acids Res. .

Abstract

Regulatory interactions between enhancers and core promoters are fundamental for the temporal and spatial specificity of gene expression in development. The central role of core promoters is to initiate productive transcription in response to enhancer's activation cues. However, it has not been systematically assessed how individual core promoter elements affect the induction of transcriptional bursting by enhancers. Here, we provide evidence that each core promoter element differentially modulates functional parameters of transcriptional bursting in developing Drosophila embryos. Quantitative live imaging analysis revealed that the timing and the continuity of burst induction are common regulatory steps on which core promoter elements impact. We further show that the upstream TATA also affects the burst amplitude. On the other hand, Inr, MTE and DPE mainly contribute to the regulation of the burst frequency. Genome editing analysis of the pair-rule gene fushi tarazu revealed that the endogenous TATA and DPE are both essential for its correct expression and function during the establishment of body segments in early embryos. We suggest that core promoter elements serve as a key regulatory module in converting enhancer activity into transcription dynamics during animal development.


Figures

Figure 1.
Figure 1.
Inr, MTE and DPE mainly control bursting frequency. (A) Schematic representation of the Drosophila synthetic core promoter (DSCP). (B) Schematic representation of the yellow reporter gene containing the 155-bp DSCP, the 1.5-kb sna shadow enhancer, and 24× MS2 RNA stem loops within the 5′ UTR. (C) Inr, MTE and DPE were mutated as indicated. (D) Representative trajectories of transcription activity of the MS2 reporter genes with WT (left), mInr (middle left), mMTE (middle right) and mDPE DSCP (right) in individual nuclei. AU; arbitrary unit. (E) MS2 trajectories for all analyzed nuclei. Each row represents the MS2 trajectory for a single nucleus. A total of 403, 435, 509 and 444 ventral-most nuclei, respectively, were analyzed from three independent embryos for the reporter genes with WT (left), mInr (middle left), mMTE (middle right) and mDPE DSCP (right). Nuclei were ordered by their onset of transcription in nc14. AU; arbitrary unit. (F) Boxplots showing the distribution of total output (left), burst amplitude (middle) and burst duration (right). The box indicates the lower (25%) and upper (75%) quantile and the open circle indicates the median. Whiskers extend to the most extreme, non-outlier data points. A total of 403, 435, 509 and 444 ventral-most nuclei, respectively, were analyzed from three independent embryos for the reporter genes with WT, mInr, mMTE and mDPE DSCP. Median values relative to the WT reporter are shown at the bottom. The P-values of two-sided Wilcoxon rank sum test are shown at the top. AU; arbitrary unit. (G) Histograms showing the distribution of burst frequency. A total of 403, 435, 509 and 444 ventral-most nuclei, respectively, were analyzed from three independent embryos for the reporter genes with WT (top), mInr (upper middle), mMTE (lower middle) and mDPE DSCP (bottom). (HI) Boxplots showing the distribution of the timing of first burst (H) and the burst frequency normalized by the length of time after the first burst (I). The box indicates the lower (25%) and upper (75%) quantile and the open circle indicates the median. Whiskers extend to the most extreme, non-outlier data points. A total of 403, 435, 509 and 444 ventral-most nuclei, respectively, were analyzed from three independent embryos for the reporter genes with WT, mInr, mMTE and mDPE DSCP. Median values relative to the WT reporter are shown at the bottom. The P-values of two-sided Wilcoxon rank sum test are shown at the top.
Figure 2.
Figure 2.
TATA modulates bursting amplitude and frequency. (A) TATA was mutated as indicated. Modified core promoter was placed under the control of the sna shadow enhancer as illustrated in Figure 1B. (B) Representative trajectories of transcription activity of the MS2 reporter genes with WT (left) and mTATA DSCP (right) in individual nuclei. AU; arbitrary unit. (C) MS2 trajectories for all analyzed nuclei. Each row represents the MS2 trajectory for a single nucleus. A total of 401 and 406 ventral-most nuclei, respectively, were analyzed from three independent embryos for the reporter genes with WT (left) and mTATA DSCP (right). Nuclei were ordered by their onset of transcription in nc14. AU; arbitrary unit. (D) Boxplots showing the distribution of total output (left), burst amplitude (middle) and burst duration (right). The box indicates the lower (25%) and upper (75%) quantile and the open circle indicates the median. Whiskers extend to the most extreme, non-outlier data points. A total of 401 and 406 ventral-most nuclei, respectively, were analyzed from three independent embryos for the reporter genes with WT and mTATA DSCP. Median values relative to the WT reporter are shown at the bottom. The P-values of two-sided Wilcoxon rank sum test are shown at the top. AU; arbitrary unit. (E) Histograms showing the distribution of burst frequency. A total of 401 and 406 ventral-most nuclei, respectively, were analyzed from three independent embryos for the reporter genes with WT (top) and mTATA DSCP (bottom). (FG) Boxplots showing the distribution of the timing of first burst (F) and the burst frequency normalized by the length of time after the first burst (G). The box indicates the lower (25%) and upper (75%) quantile and the open circle indicates the median. Whiskers extend to the most extreme, non-outlier data points. A total of 401 and 406 ventral-most nuclei, respectively, were analyzed from three independent embryos for the reporter genes with WT and mTATA DSCP. Median values relative to the WT reporter are shown at the bottom. The P-values of two-sided Wilcoxon rank sum test are shown at the top.
Figure 3.
Figure 3.
Engineering of an endogenous TATA-less core promoter. (A) Endogenous lab core promoter contains Inr and DPE, but lacks TATA. The sna shadow enhancer was used for the analysis. (B) Two nucleotides substitution was introduced to contain an optimal TATA. (C) Representative trajectories of transcription activity of the MS2 reporter genes with unmodified (left) and modified lab core promoter (right) in individual nuclei. AU; arbitrary unit. (D) MS2 trajectories for all analyzed nuclei. Each row represents the MS2 trajectory for a single nucleus. A total of 344 and 348 ventral-most nuclei, respectively, were analyzed from three independent embryos for the reporter genes with unmodified (left) and modified lab core promoter (right). Nuclei were ordered by their onset of transcription in nc14. AU; arbitrary unit. (E) Boxplots showing the distribution of total output (left), burst amplitude (middle) and burst duration (right). The box indicates the lower (25%) and upper (75%) quantile and the open circle indicates the median. Whiskers extend to the most extreme, non-outlier data points. A total of 344 and 348 ventral-most nuclei, respectively, were analyzed from three independent embryos for the reporter genes with unmodified and modified lab core promoter. Median values relative to the unmodified lab core promoter are shown at the bottom. The P-values of two-sided Wilcoxon rank sum test are shown at the top. AU; arbitrary unit. (F) Histograms showing the distribution of burst frequency. A total of 344 and 348 ventral-most nuclei, respectively, were analyzed from three independent embryos for the reporter genes with unmodified (top) and modified lab core promoter (bottom). (GH) Boxplots showing the distribution of the timing of first burst (G) and the burst frequency normalized by the length of time after the first burst (H). The box indicates the lower (25%) and upper (75%) quantile and the open circle indicates the median. Whiskers extend to the most extreme, non-outlier data points. A total of 344 and 348 ventral-most nuclei, respectively, were analyzed from three independent embryos for the reporter genes with unmodified and modified lab core promoter. Median values relative to the unmodified lab core promoter are shown at the bottom. The P-values of two-sided Wilcoxon rank sum test are shown at the top.
Figure 4.
Figure 4.
Zelda facilitates rapid induction of transcriptional bursting. (A) DSCP was modified to mutate GAGA site or add three optimal Zelda binding sites. The sna shadow enhancer was used for the analysis. (B) Representative trajectories of transcription activity of the MS2 reporter genes with WT (left), mGAGA (middle) and Zelda DSCP (right) in individual nuclei. AU; arbitrary unit. (C) MS2 trajectories for all analyzed nuclei. Each row represents the MS2 trajectory for a single nucleus. A total of 403, 458 and 458 most ventral-nuclei, respectively, were analyzed from three individual embryos for the reporter genes with WT (left), mGAGA (middle) and Zelda DSCP (right). Nuclei were ordered by their onset of transcription in nc14. Panel of WT is the same as the panel in Figure 1E. AU; arbitrary unit. (D) Boxplots showing the distribution of total output (left), burst amplitude (middle) and burst duration (right). The box indicates the lower (25%) and upper (75%) quantile and the open circle indicates the median. Whiskers extend to the most extreme, non-outlier data points. A total of 403, 458 and 458 most ventral-nuclei, respectively, were analyzed from three independent embryos for the reporter genes with WT, mGAGA and Zelda DSCP. Median values relative to the WT DSCP reporter are shown at the bottom. The P-values of two-sided Wilcoxon rank sum test are shown at the top. Plot of WT is the same as the plot in Figure 1F. AU; arbitrary unit. (E) Histograms showing the distribution of burst frequency. A total of 403, 458 and 458 ventral-most nuclei, respectively, were analyzed from three independent embryos for the reporter genes with WT (top), mGAGA (middle) and Zelda DSCP (bottom). Plot of WT is the same as the plot in Figure 1G. (FG) Boxplots showing the distribution of the timing of first burst (F) and the burst frequency normalized by the length of time after the first burst (G). The box indicates the lower (25%) and upper (75%) quantile and the open circle indicates the median. Whiskers extend to the most extreme, non-outlier data points. A total of 403, 458 and 458 ventral-most nuclei, respectively, were analyzed from three independent embryos for the reporter genes with WT, mGAGA and Zelda DSCP. Median values relative to the WT reporter are shown at the bottom. The P-values of two-sided Wilcoxon rank sum test are shown at the top. Plot of WT is the same as the plot in Figure 1H and I. (H) Autocorrelation analysis of MS2 trajectories of the reporter genes with WT and Zelda DSCP. A total of 403 and 458 most ventral nuclei, respectively, were analyzed. Each trace indicates mean autocorrelation value from all analyzed nuclei. Random represents mean autocorrelation value calculated from time-shuffled MS2 trajectories of the WT reporter. Autocorrelation values were calculated with 16.8 s timestep and normalized to 1 at the smallest lag time.
Figure 5.
Figure 5.
Zelda compensates weak activity of TATA-less core promoters. (A) Schematic representation of mTATA and Zelda/mTATA DSCP. The sna shadow enhancer was used for the analysis. (B) Representative trajectories of transcription activity of the MS2 reporter genes with mTATA (left) and Zelda/mTATA DSCP (right) in individual nuclei. AU; arbitrary unit. (C) MS2 trajectories for all analyzed nuclei. Each row represents the MS2 trajectory for a single nucleus. A total of 343 and 359 ventral-most nuclei, respectively, were analyzed from three independent embryos for the reporter genes with mTATA (left) and Zelda/mTATA DSCP (right). Nuclei were ordered by their onset of transcription in nc14. AU; arbitrary unit. (D) Boxplots showing the distribution of total output (left), burst amplitude (middle) and burst duration (right). The box indicates the lower (25%) and upper (75%) quantile and the open circle indicates the median. Whiskers extend to the most extreme, non-outlier data points. A total of 371, 343 and 359 ventral-most nuclei, respectively, were analyzed from three independent embryos for the reporter genes with WT, mTATA and Zelda/mTATA DSCP. Median values relative to the WT reporter are shown at the bottom. The P-values of two-sided Wilcoxon rank sum test are shown at the top. (E) Histograms showing the distribution of burst frequency. A total of 371, 343 and 359 ventral-most nuclei, respectively, were analyzed from three independent embryos for the reporter genes with WT (top), mTATA (middle) and Zelda/mTATA DSCP (bottom). (F, G) Boxplots showing the distribution of the timing of first burst (F) and the burst frequency normalized by the length of time after the first burst (G). The box indicates the lower (25%) and upper (75%) quantile and the open circle indicates the median. Whiskers extend to the most extreme, non-outlier data points. A total of 371, 343 and 359 ventral-most nuclei, respectively, were analyzed from three independent embryos for the reporter genes with WT, mTATA and Zelda/mTATA DSCP. Median values relative to the WT reporter are shown at the bottom. The P-values of two-sided Wilcoxon rank sum test are shown at the top.
Figure 6.
Figure 6.
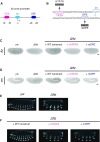
TATA and DPE are both required for proper ftz expression and function. (A) ftz core promoter contains TATA, Inr and DPE. (B) TATA and DPE were mutated as indicated. (C) Fluorescent in situ hybridization of ftz. Embryos at late nc14 are shown. yw embryo is shown as a control. ftz-MS2 constructs were integrated into the attP site at the Δftz allele. Images are cropped and rotated to align embryos (anterior to the left and posterior to the right). Scale bar indicates 50 μm. (D) Fluorescent in situ hybridization of en. Embryos after germband extension are shown. yw embryo is shown as a control. Images are cropped and rotated to align embryos (anterior to the left and posterior to the right). Brightness of each embryo was differentially adjusted for visualization of en expression pattern. Scale bar indicates 50 μm. (E) Dark-field micrographs showing cuticle preparations of yw (left) and Δftz (right) larvae. (F) Dark-field micrographs showing cuticle preparations of Δftz larvae containing WT (left), mTATA (middle) and mDPE ftz-MS2 transgene (right).
Figure 7.
Figure 7.
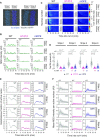
TATA and DPE differentially regulate ftz transcription. (A, left) False-coloring of nuclei at stripe 1 (cyan) and stripe 2 (blue). (A, right) False-coloring of nuclei at stripe 5 (cyan) and stripe 6 (blue). The maximum projected image of a histone marker (His2Av-mRFP) is shown in gray. Images are oriented with anterior to the left. Scale bar indicates 20 μm. (B) Representative trajectories of transcription activity of ftz-MS2 complementation alleles in individual nuclei. AU; arbitrary unit. (C) MS2 trajectories for all analyzed nuclei. Each row represents the MS2 trajectory for a single nucleus. A total of 234, 236 and 227 nuclei at stripe 1, 248, 241 and 242 nuclei at stripe 2, 243, 238 and 240 nuclei at stripe 5, and 232, 239 and 240 nuclei at stripe 6 were analyzed from three independent embryos for the ftz-MS2 with WT, mTATA and mDPE core promoter, respectively. Nuclei were ordered by their onset of transcription in nc14. AU; arbitrary unit. (D) Boxplots showing the distribution of total output. The box indicates the lower (25%) and upper (75%) quantile and the open circle indicates the median. Whiskers extend to the most extreme, non-outlier data points. A total of 234, 236 and 227 nuclei at stripe 1, 248, 241 and 242 nuclei at stripe 2, 243, 238 and 240 nuclei at stripe 5, and 232, 239 and 240 nuclei at stripe 6 were analyzed from three independent embryos for the ftz-MS2 with WT, mTATA and mDPE core promoter, respectively. Median values relative to the ftz-MS2 with WT core promoter are shown at the bottom. The P-values of two-sided Wilcoxon rank sum test are shown at the top. AU; arbitrary unit. (E) Instantaneous fraction of actively transcribing nuclei at each expression domain. A total of 234, 236 and 227 nuclei at stripe 1, 248, 241 and 242 nuclei at stripe 2, 243, 238 and 240 nuclei at stripe 5, and 232, 239 and 240 nuclei at stripe 6 were analyzed from three independent embryos for the ftz-MS2 with WT, mTATA and mDPE core promoter, respectively. (F) Mean MS2 intensity per actively transcribing nucleus at each expression domain. A total of 234, 236 and 227 nuclei at stripe 1, 248, 241 and 242 nuclei at stripe 2, 243, 238 and 240 nuclei at stripe 5, and 232, 239 and 240 nuclei at stripe 6 were analyzed from three independent embryos for the ftz-MS2 with WT, mTATA and mDPE core promoter, respectively. Shades represent the standard deviation of the mean across active nuclei at a given time.

References

    1. Bartman C.R., Hsu S.C., Hsiung C.C., Raj A., Blobel G.A.. Enhancer regulation of transcriptional bursting parameters revealed by forced chromatin looping. Mol. Cell. 2016; 62:237–247. - PMC - PubMed
    1. Fukaya T., Lim B., Levine M.. Enhancer control of transcriptional bursting. Cell. 2016; 166:358–368. - PMC - PubMed
    1. Larsson A.J.M., Johnsson P., Hagemann-Jensen M., Hartmanis L., Faridani O.R., Reinius B., Segerstolpe A., Rivera C.M., Ren B., Sandberg R.. Genomic encoding of transcriptional burst kinetics. Nature. 2019; 565:251–254. - PMC - PubMed
    1. Vo Ngoc L., Kassavetis G.A., Kadonaga J.T.. The RNA polymerase II core promoter in Drosophila. Genetics. 2019; 212:13–24. - PMC - PubMed
    1. Goldberg M.L. Sequence Analysis of Drosophila Histone Genes. 1979; Stanford, CA: Stanford University; Ph.D. Dissertation.

Publication types

LinkOut - more resources