. 2022 Mar;109(5):1337-1350.
doi: 10.1111/tpj.15628. Epub 2022 Jan 16.

Taming the massive genome of Scots pine with PiSy50k, a new genotyping array for conifer research

Affiliations

Taming the massive genome of Scots pine with PiSy50k, a new genotyping array for conifer research

Chedly Kastally et al. Plant J. 2022 Mar.

Abstract

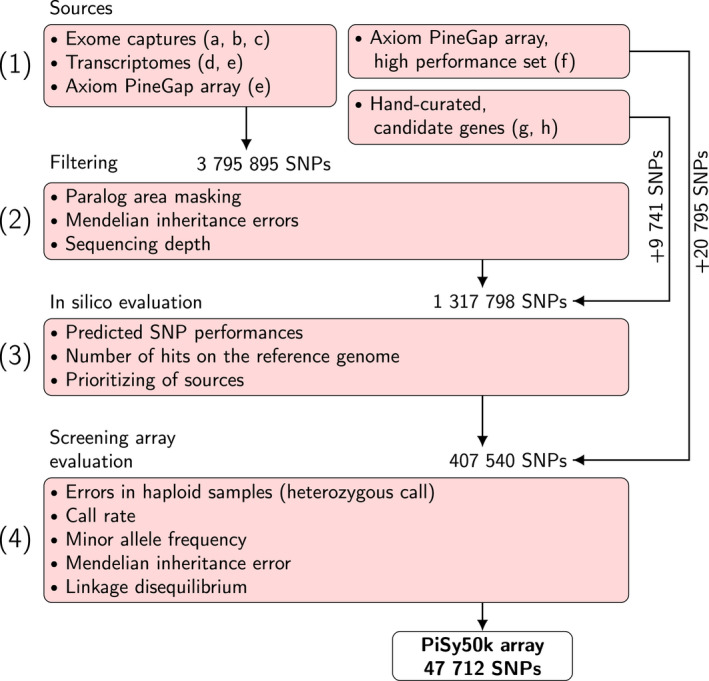
Pinus sylvestris (Scots pine) is the most widespread coniferous tree in the boreal forests of Eurasia, with major economic and ecological importance. However, its large and repetitive genome presents a challenge for conducting genome-wide analyses such as association studies, genetic mapping and genomic selection. We present a new 50K single-nucleotide polymorphism (SNP) genotyping array for Scots pine research, breeding and other applications. To select the SNP set, we first genotyped 480 Scots pine samples on a 407 540 SNP screening array and identified 47 712 high-quality SNPs for the final array (called 'PiSy50k'). Here, we provide details of the design and testing, as well as allele frequency estimates from the discovery panel, functional annotation, tissue-specific expression patterns and expression level information for the SNPs or corresponding genes, when available. We validated the performance of the PiSy50k array using samples from Finland and Scotland. Overall, 39 678 (83.2%) SNPs showed low error rates (mean = 0.9%). Relatedness estimates based on array genotypes were consistent with the expected pedigrees, and the level of Mendelian error was negligible. In addition, array genotypes successfully discriminate between Scots pine populations of Finnish and Scottish origins. The PiSy50k SNP array will be a valuable tool for a wide variety of future genetic studies and forestry applications.

Keywords: Pinus sylvestris; genetic diversity; genotyping; pedigree; single-nucleotide polymorphism.


Conflict of interest statement

The authors declare that they have no conflicts of interest associated with this work.

Figures

Figure 1
Figure 1
Flow chart of the PiSy50k array design. We proceeded in four steps: (1) the collection of single‐nucleotide polymorphisms (SNPs) from eight sources (a, ProCoGen haploid; b, ProCoGen diploid; c, UOULU exomeFEB2019; d, UOULU RNA‐seq; e, UKCEH2; f, UKCEH1; g, UOULU candidate; h, LUKE PacBio; Table 1); (2) filtering to remove SNPs from paralogous genomic areas, SNPs with low sequencing depth or Mendelian errors; (3) evaluation to retain the best set of 407 540 markers (screening set); and (4) filtering based on the screening array performance to select the 47 712 markers retained in the PiSy50k array.
Figure 2
Figure 2
The proportions of conversion types of each marker source in (a) the screening array and (b) the PiSy50k array. Abbreviations: CRBT, call rate below threshold; MHR, mono high resolution; NMH, no minor homozygote; OTV, off‐target variant; PHR, poly high resolution. Numbers to the right of the bars indicate the total number of SNPs per marker source.
Figure 3
Figure 3
Minor allele frequency (MAF) spectra of the screening and PiSy50k arrays. (a) MAF for the screening population sample (n = 466) and 56 693 single‐nucleotide polymorphisms (SNPs, conversion types poly high resolution (PHR) and no minor homozygote (NMR)) without missing data in the screening array. The red line illustrates the expected neutral MAF (Tajima, 1989). Note the log scale on the y‐axis. (b) MAF based on the PiSy50k array, including 38 302 SNPs genotyped in 90 plus trees across three Finnish breeding populations (red line) and 42 exome captures of Scots pine trees sampled in four natural populations of Finland (Tyrmi et al., 2020). To allow comparison, we down‐sampled both distributions to 30 samples. The vertical dashed line marks the filter threshold of 0.05 used during the array design, below which SNPs were partly excluded. As expected, there is a deficiency of rare alleles in the data obtained from PiSy50k, as a result of ascertainment bias.
Figure 4
Figure 4
Position and density of 1619 single‐nucleotide polymorphisms (SNPs) from the PiSy50k array on the Pinus taeda linkage map (Westbrook et al., 2015). The vertical grey lines represent the 12 linkage groups in P. taeda, whereas the horizontal colored lines indicate the marker positions and densities. This plot was made with the r package chromplot 1.12.0 (Oróstica and Verdugo, 2016).
Figure 5
Figure 5
Relatedness analyses of 10 families (including 18 parents and 135 offspring) using the PiSy50k array. (a) Kinship coefficients (Manichaikul et al., 2010) and proportion of sites where individuals share no allele (IBS0) between all pairs and using 39 678 single‐nucleotide polymorphisms (SNPs) (poly high resolution (PHR) and no minor homozygote (NMR)). Expected relationships between pairs are outlined: parent–offspring in purple, full sibs in blue, half sibs in green and unrelated pairs in yellow. (b) Heat map of the kinship coefficients between all pairs of the 135 offspring.
Figure 6
Figure 6
Principal component analysis (PCA) using 39 678 polymorphic single‐nucleotide polymorphisms (SNPs) from the PiSy50k array genotyped in 122 trees from seven areas in Finland (90) and Scotland (32). PCA including (a) all 122 samples from Finland and Scotland, (b) 32 samples collected across 21 localities grouped into four geographical areas of Scotland or (c) 90 samples from southern, central and northern Finland (30 samples each). Scot N, E, W and S: northern, eastern, western and southern Scotland. Fin S, C and N: southern, central and northern Finland.

References

    1. Alberto, F.J. , Aitken, S.N. , Alía, R. , González‐Martínez, S.C. , Hänninen, H. , Kremer, A. et al. (2013) Potential for evolutionary responses to climate change – evidence from tree populations. Global Change Biology, 19, 1645–1661. - PMC - PubMed
    1. Andrews, K.R. , Good, J.M. , Miller, M.R. , Luikart, G. & Hohenlohe, P.A. (2016) Harnessing the power of RADseq for ecological and evolutionary genomics. Nature Reviews Genetics, 17, 81–92. - PMC - PubMed
    1. Avia, K. , Kärkkäinen, K. , Lagercrantz, U. & Savolainen, O. (2014) Association of FLOWERING LOCUS T/TERMINAL FLOWER 1‐like gene FTL2 expression with growth rhythm in Scots pine (Pinus sylvestris). New Phytologist, 204, 159–170. - PubMed
    1. Bernard, A. , Marrano, A. , Donkpegan, A. , Brown, P.J. , Leslie, C.A. , Neale, D.B. et al. (2020) Association and linkage mapping to unravel genetic architecture of phenological traits and lateral bearing in Persian walnut (Juglans regia L.). BMC Genomics, 21, 203. - PMC - PubMed
    1. Bernhardsson, C. , Zan, Y. , Chen, Z. , Ingvarsson, P.K. & Wu, H.X. (2020) Development of a highly efficient 50K SNP genotyping array for the large and complex genome of Norway spruce (Picea abies L. Karst) by whole genome re‐sequencing and its transferability to other spruce species. Molecular Ecology Resources, 21(3), 880–896. 10.1111/1755-0998.13292 - DOI - PMC - PubMed