

KRAS signaling in malignant pleural mesothelioma
- PMID: 34898002
- PMCID: PMC8819314
- DOI: 10.15252/emmm.202013631
KRAS signaling in malignant pleural mesothelioma
Abstract
Malignant pleural mesothelioma (MPM) arises from mesothelial cells lining the pleural cavity of asbestos-exposed individuals and rapidly leads to death. MPM harbors loss-of-function mutations in BAP1, NF2, CDKN2A, and TP53, but isolated deletion of these genes alone in mice does not cause MPM and mouse models of the disease are sparse. Here, we show that a proportion of human MPM harbor point mutations, copy number alterations, and overexpression of KRAS with or without TP53 changes. These are likely pathogenic, since ectopic expression of mutant KRASG12D in the pleural mesothelium of conditional mice causes epithelioid MPM and cooperates with TP53 deletion to drive a more aggressive disease form with biphasic features and pleural effusions. Murine MPM cell lines derived from these tumors carry the initiating KRASG12D lesions, secondary Bap1 alterations, and human MPM-like gene expression profiles. Moreover, they are transplantable and actionable by KRAS inhibition. Our results indicate that KRAS alterations alone or in accomplice with TP53 alterations likely play an important and underestimated role in a proportion of patients with MPM, which warrants further exploration.
Keywords: BAP1; KRAS; NF2; TP53; asbestos.
© 2021 The Authors. Published under the terms of the CC BY 4.0 license.
Conflict of interest statement
IP works as a Senior Director in AstraZeneca Pharmaceutical in a non‐related field with the publication. The remaining authors declare no competing financial interests.
Figures
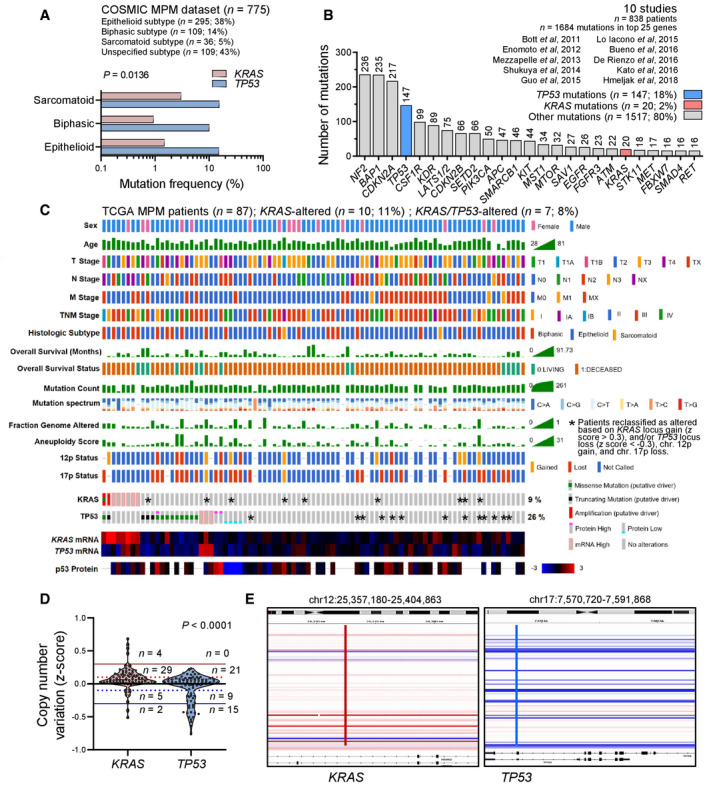
- A
KRAS and TP53 mutation frequencies in MPM from the catalogue of somatic mutations in cancer (COSMIC) stratified by histologic subtype (n = 775 patients).
- B
Top 25 mutated genes from 10 molecular studies of human MPM (n = 838 patients).
- C–E
KRAS and TP53 alterations in the cancer genome atlas (TCGA) pan‐cancer MPM dataset (n = 86 patients). Shown are clinical and molecular data plot with alteration frequencies (C) and patients reclassified as KRAS‐ or TP53‐altered (asterisks), copy number variation data summary (D), and segments of the KRAS and TP53 loci (E).
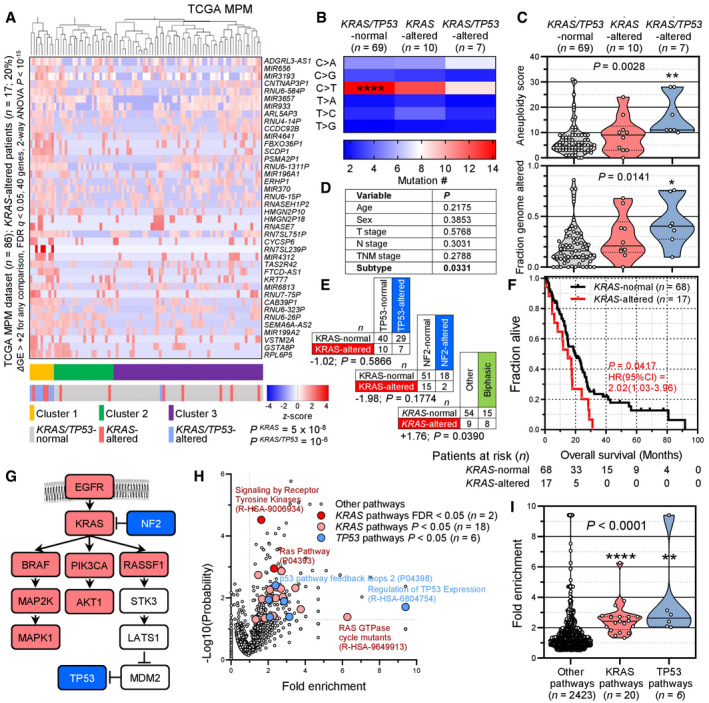
- A–F
Molecular and clinical features of the cancer genome atlas (TCGA) pan‐cancer MPM patients (n = 87) stratified by the presence of KRAS standalone (n = 10) and combined KRAS/TP53 (n = 7) alterations. Shown are unsupervised hierarchical clustering of n = 86 patients (gene expression data were not available for one patient) by 40 genes significantly overexpressed in KRAS/TP53‐altered over KRAS‐altered over KRAS/TP53‐normal patients (A) and data summaries of mononucleotide change signatures (B), of indices of genomic instability and mutation burden (C), of clinical features and KRAS/TP53/NF2 co‐mutation frequency (D, E), and of overall survival (F).
- G
KRAS/TP53 pathway adapted from Matallanas et al (2011) and Tikoo et al (1994). Color‐coded genes were identified by TCGA and PANTHER pathway analyses.
- H, I
PANTHER and Reactome KRAS and TP53 pathways significantly altered in the cancer genome atlas (TCGA) pan‐cancer MPM patients. Shown are volcano plot of fold‐enrichment versus −log10(probability) (H), and data summary of fold‐enrichment of KRAS and TP53 versus all other pathways with fold‐enrichment > 0.5 (I).
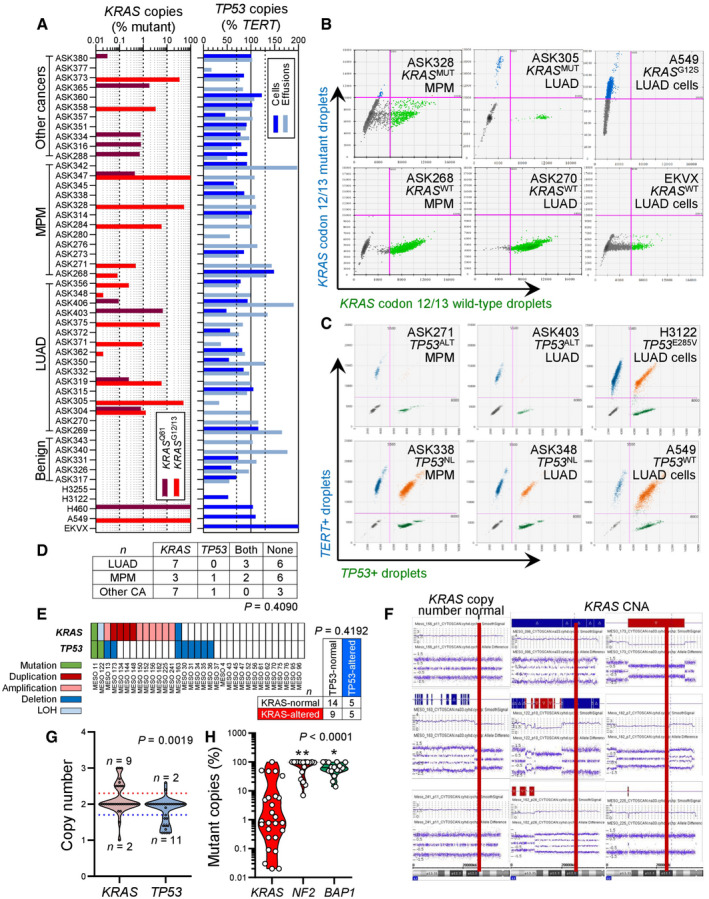
- A–D
Pleural fluid cell pellets and supernatants from 45 patients (called ASK #) with pleural effusion from Munich, Germany (Klotz et al, 2019a, 2019b), were subjected to digital droplet polymerase chain reaction (ddPCR) for the detection of mutant (MUT) copies of KRAS codon 12/13 (KRAS G12/13) and KRAS codon 61 (KRAS Q61), as well as copies of TP53 and TERT. Diagnoses were benign pleural effusion (n = 5), lung adenocarcinoma (LUAD; n = 16), MPM (n = 12), and other extrathoracic cancers (n = 12). The assays were designed for detection of down to 1:20,000 copies using EKVX (KRAS WT TP53 G610T), A549 (KRAS G12S TP53 WT), NCI‐H460 (KRAS Q61H TP53 WT), NCI‐H3122 (KRAS WT TP53 E285V), and NCI‐H3255 (KRAS WT TP53 G560‐1A) human LUAD cells as controls. Shown are individual patient (KRAS plot) and individual sample (TP53 plot) allelic frequencies with color code and limits of normal TP53 allelic frequency as vertical dashed lines in the TP53 plot (A), representative gated dotplots of codon 12/13 KRAS ddPCR (B) and TP53/TERT (C), and results summary table (D). Any number of KRAS‐mutant droplets detected in any sample (KRAS plot in A) and any patient that failed to achieve normal TP53 ploidy by any sample (TP53 plot in A) was deemed altered.
- E–G
Results summary (E), representative KRAS CNA segments (F), and data summary of individual cell line CNA z‐score (G) from Affymetrix CytoScanHD Arrays of 33 primary MPM cell lines (called MESO #) from Nantes, France (GEO dataset GSE134349). Red lines denote the KRAS locus on chromosome 12p12.1.
- H
Data summary of mutant allelic frequency of KRAS compared with NF2 and BAP1 in all mutated samples from (A–G).
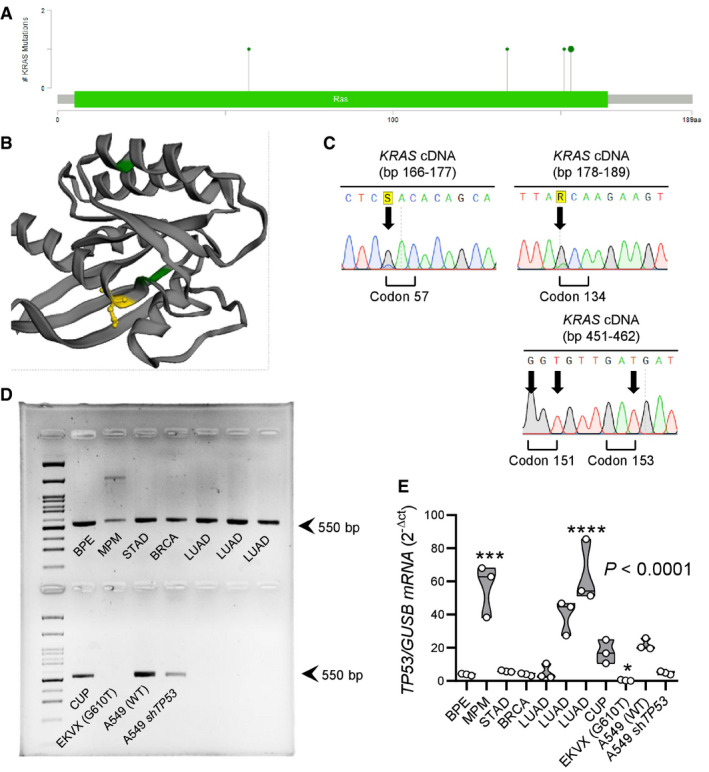
Lollipop plot showing the four different missense KRAS mutations found (D57H, A134T, R151G, and E153D).
3D rendering of KRAS protein showing the three KRAS mutations predicted by OncoKB to be non‐functional (green color) and the E153D mutation predicted by OncoKB to be oncogenic (yellow color).
Representative Sanger sequencing traces. Arrows indicate point mutations.
TP53 RT–PCR in comparison to cancer cell lines and other patients with malignant pleural effusion. Note the decreased band intensity in the patient with MPM.
TP53 qPCR in comparison to cancer cell lines and other patients with malignant pleural effusion. Note the markedly increased TP53 transcript abundance in the patient with MPM that, together with (D), indicates a TP53 mutation.
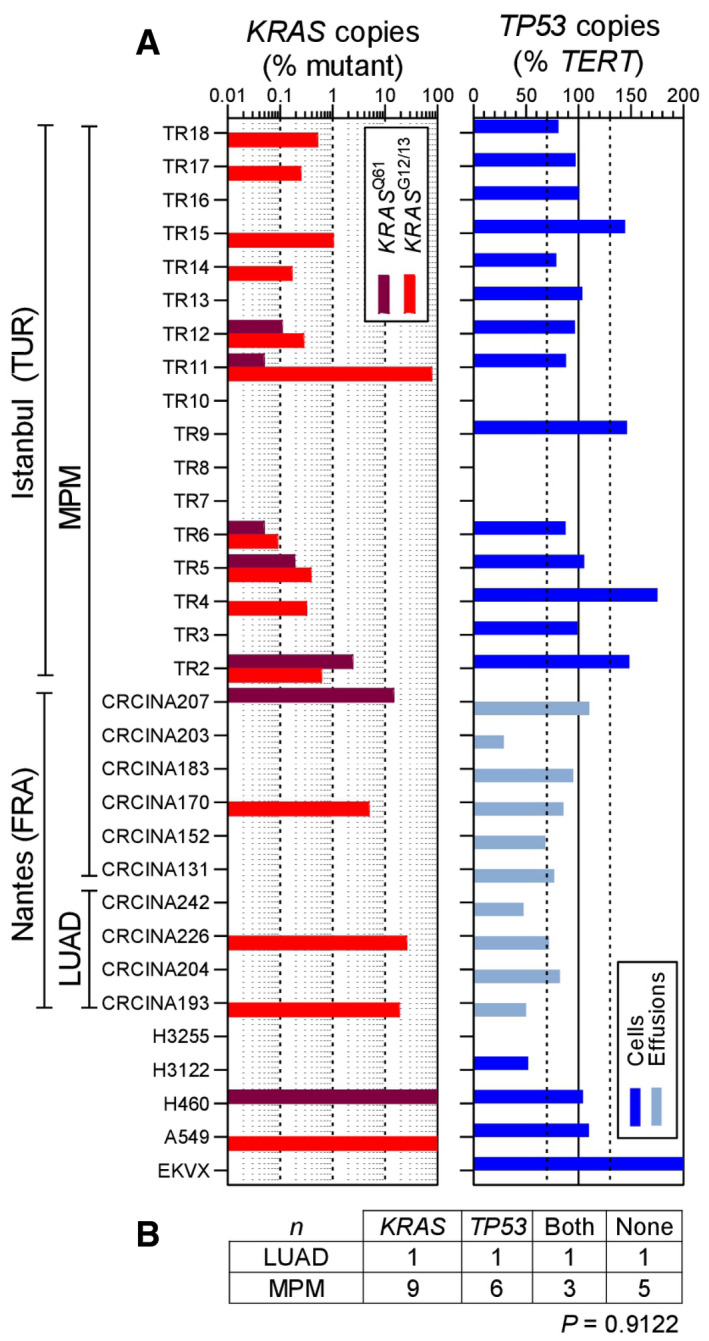
- A, B
Pleural fluid cell pellets and supernatants from 10 patients (called CRCINA #) with pleural effusion from Nantes, France (Gueugnon et al, ; Smeele et al, 2018), and pleural tumor samples from 17 patients (called TR#) with MPM from Istanbul, Turkey, were subjected to digital droplet polymerase chain reaction (ddPCR) for the detection of mutant (MUT) copies of KRAS codon 12/13 (KRAS G12/13) and KRAS codon 61 (KRAS Q61), as well as copies of TP53 and TERT. Diagnoses were lung adenocarcinoma (LUAD; n = 4) and MPM (n = 23). The assays were designed for detection of down to 1:20,000 copies using EKVX (KRAS WT TP53 G610T), A549 (KRAS G12S TP53 WT), NCI‐H460 (KRAS Q61H TP53 WT), NCI‐H3122 (KRAS WT TP53 E285V), and NCI‐H3255 (KRAS WT TP53 G560‐1A) human LUAD cells as controls. Shown are individual patient (KRAS plot) and individual sample (TP53 plot) allelic frequencies with color code and limits of normal TP53 allelic frequency as vertical dashed lines in the TP53 plot (A) and results summary table (B). Any number of KRAS‐mutant droplets detected in any sample (KRAS plot in A) and any patient that failed to achieve normal TP53 ploidy by any sample (TP53 plot in A) was deemed altered.
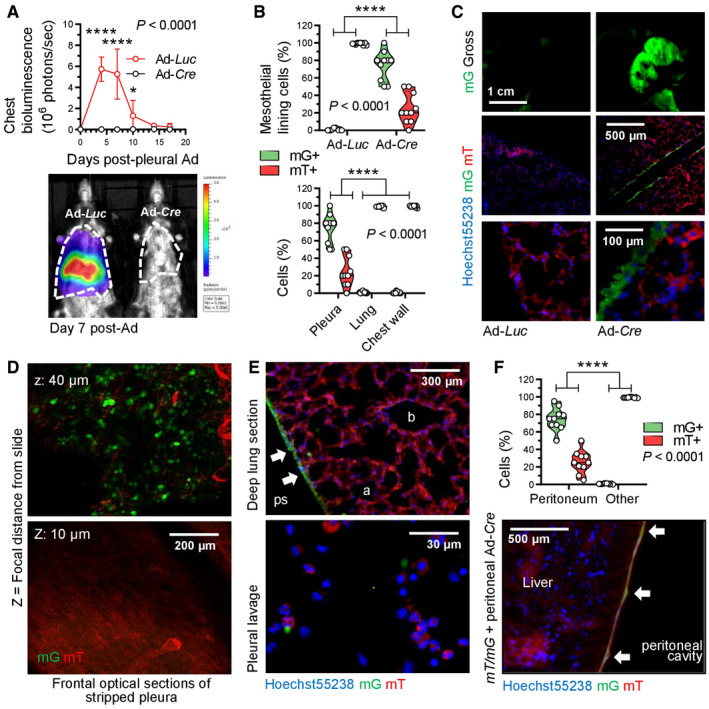
Data summary of chest light emission (top; n = 5 mice/group) and representative bioluminescence images (bottom). Note cessation of transient Ad‐Luc expression by day 14.
Data summary of mG+ and mT+ mesothelial, lung, and chest wall cell percentage (n = 10 mice/group; B), representative macroscopic (top) and microscopic (middle, bottom) fluorescent images (C), optical frontal sections of stripped parietal pleura placed apical side up on glass slides (D), and deep lung sections (E, top) and fluorescent image of pleural lavage cells (E, bottom). z, focal plane distance from slide. a, alveoli; b, bronchi; ps, pleural space; arrows, recombined mesothelium.
Data summary of mG+ and mT+ mesothelial and deeper located (other) abdominal cell percentage (n = 10 mice/group) and representative merged microscopic fluorescent image of peritoneal surface mesothelium showing Cre‐recombined mesothelium (arrows).
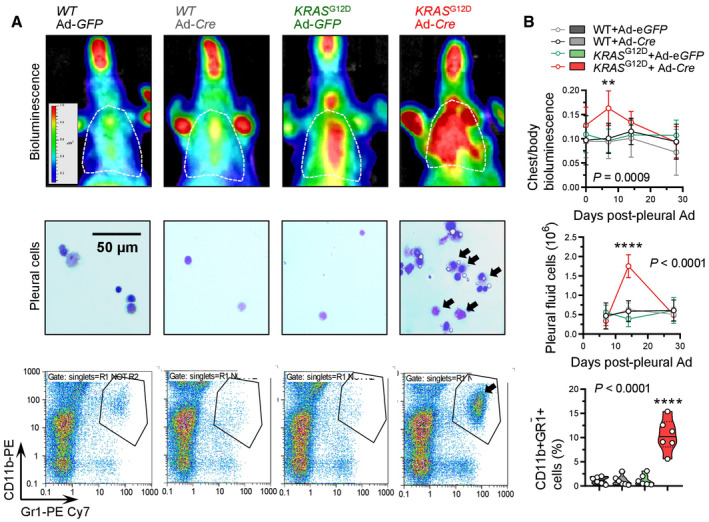
Representative chest bioluminescence images taken 2 weeks post‐Ad (top), pleural lavage cytocentrifugal specimens stained with May–Gruenwald–Giemsa (middle), and dotplots of CD11b and Gr1 expression by flow cytometry (bottom). Dotted lines in top panels denote the chest. Arrows in middle and bottom panels indicate increased mononuclear cells.
Summary of longitudinal chest light emission and total pleural cell number (dotplots), legend to dotplots, as well as of CD11b+Gr1+ pleural cells at day 14 post‐Ad (violin plot).
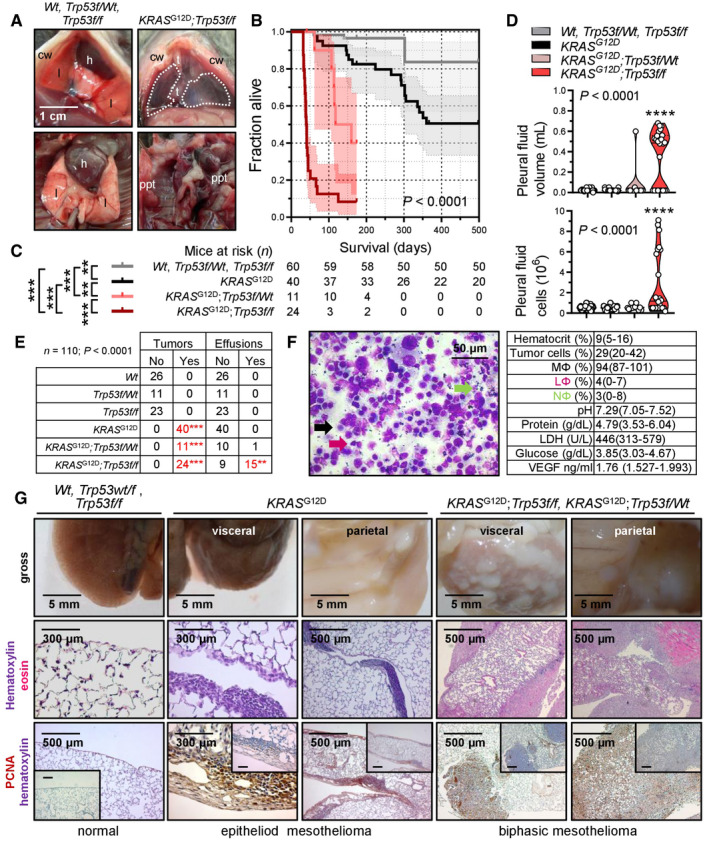
Representative photographs of the thorax before (top) and after (bottom) chest opening (t, tumors; l, lungs; cw, chest wall; h, heart; dashed lines, effusion; ppt, parietal pleural tumors).
Kaplan–Meier survival plot.
Survival table.
Data summary of pleural effusion volume and nucleated cells (n is given in table in [C]).
Incidence of pleural tumors and effusions.
Representative May–Gruenwald–Giemsa‐stained pleural fluid cytocentrifugal specimen from a KRAS G12D;Trp53f/f mouse showing macrophages (MΦ, black arrow), lymphocytes (LΦ, purple arrow), and neutrophils (NΦ, green arrow) and summary of cellular and biochemical features of effusions of KRAS G12D;Trp53f/f mice (n = 10).
Gross macroscopic and microscopic images of visceral and parietal tumors stained with hematoxylin and eosin or PCNA (n is given in table in [E]).
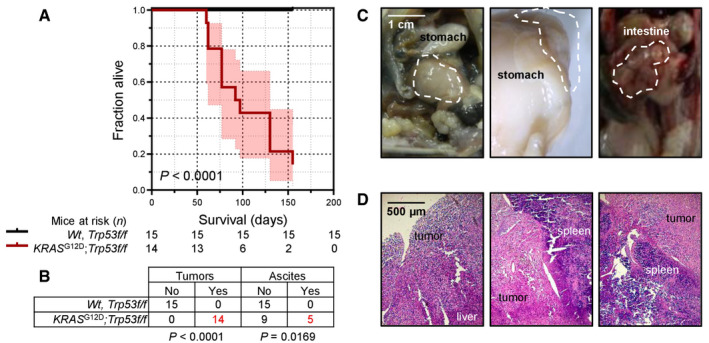
Kaplan–Meier survival plot and survival table.
Tumor and ascites incidence table.
Representative macroscopic images of peritoneal tumors (dashed outlines).
Representative hematoxylin‐and‐eosin‐stained tissue sections of peritoneal tumors.
- A
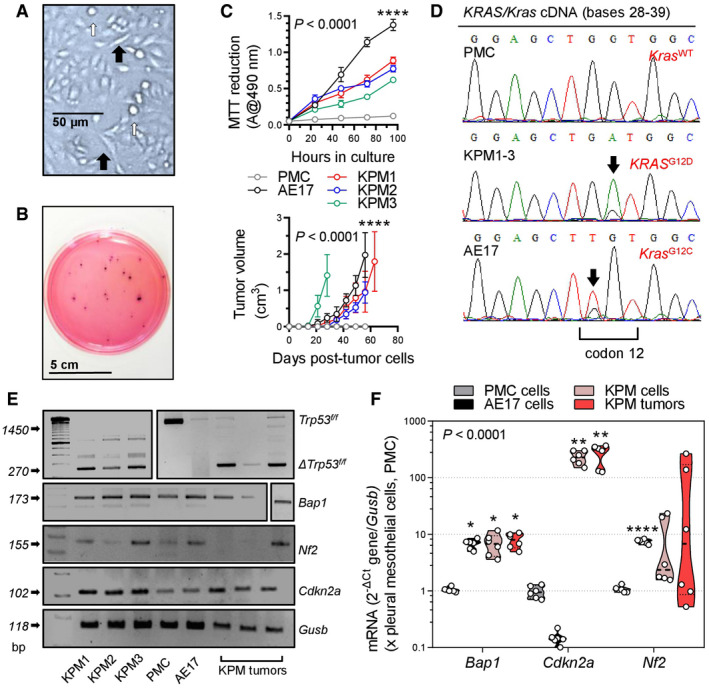
KPM cell culture showing anoikis (white arrows) and spindle‐shaped morphology (black arrows).
- B
Representative colonies of KPM1 cells (7.5 × 10³ cells/vessel) seeded on a soft agar‐containing 60‐mm petri dish and stained with crystal violet after a month (n = 3/group).
- C
Data summaries from in vitro MTT reduction (top; 2 × 10⁴ cells/well; n = 6 independent experiments) and in vivo subcutaneous tumor growth after injection of 106 cells per C57BL/6 mouse (bottom; n = 5/group).
- D
KRAS/Kras mRNA Sanger sequencing shows wild‐type Kras (Kras WT) of PMC and mutant murine Kras/human KRAS alleles (KRAS G12D and Kras G12C) of KPM and AE17 cells (arrows).
- E, F
RT–PCR (E) and qPCR (F) of KPM cells and parental tumors show Trp53f/f allele deletion (Δ) and Bap1 and Cdkn2a overexpression compared with PMC.
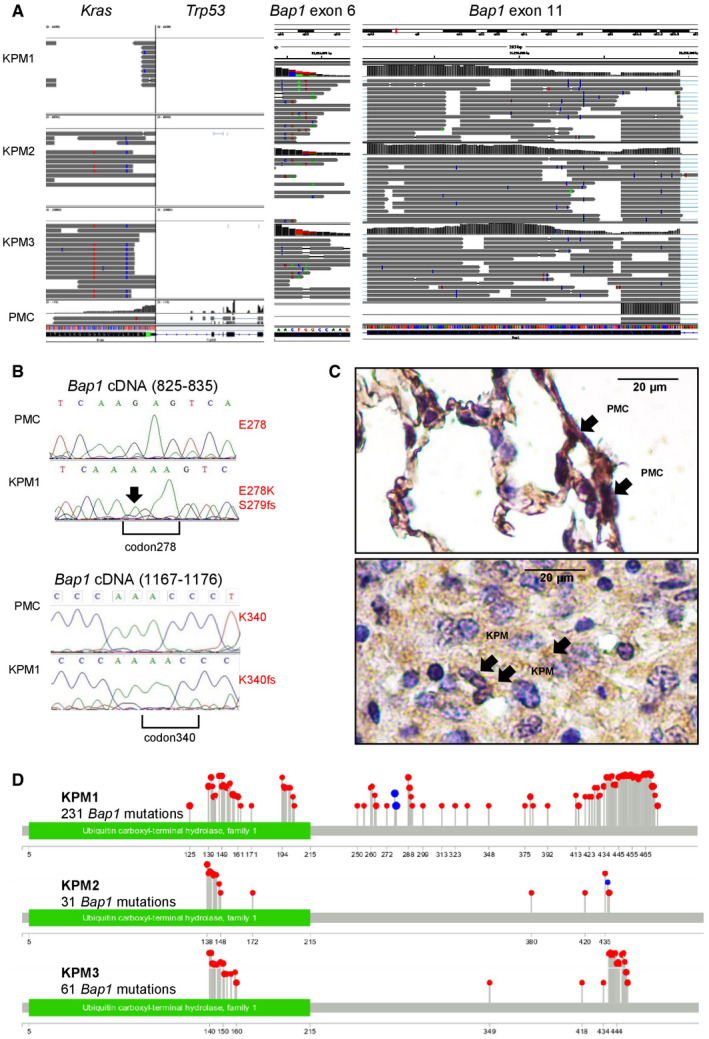
Coverage and alignment plot from RNA sequencing. Alignments are represented as gray polygons with reads mismatching the reference indicated by color. Loci with a large percentage of mismatches relative to the reference are flagged in the coverage plot as color‐coded bars. Alignments with inferred small insertions or deletions are represented with vertical or horizontal bars, respectively.
Bap1 mRNA Sanger sequencing shows a G>A transition (arrow) at c.829 that generates a missense mutation in codon E278K (top), as well as a single nucleotide insertion in position c.831 with a consequent frameshift mutation in codon S279insA and a single nucleotide insertion resulting to a frameshift mutation in codon K340insA at c.1072 (bottom).
Representative immunohistochemical images of BAP1 immunoreactivity (brown) of lungs with normal PMC and mouse tumors caused by transplanted KPM cells counterstained with hematoxylin (blue). Arrows indicate nuclear BAP1 staining.
Lollipop plot for each KPM cell line visualizing all Bap1 mutations detected. Red and blue lollipops with their numbers represent, respectively, missense mutations and insertions causing frameshift with their positions after the ATG start codon.
- A
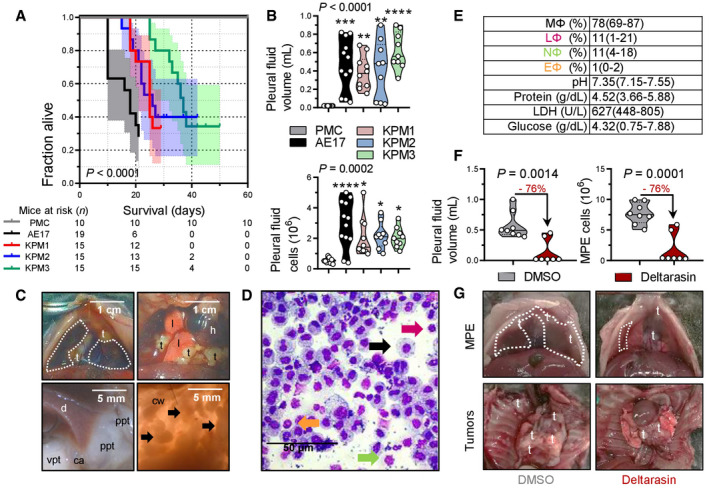
Kaplan–Meier survival plot with survival table.
- B
Data summary of pleural effusion volume and total cells (n = 10, 12, 10, 9, and 9 mice/group, respectively, from left to right).
- C
Images of the chest before and after opening, showing effusion (dashed lines), visceral (vpt), and parietal (ppt) pleural tumors on the costophrenic angle (ca), the diaphragm (d), and the chest wall (cw, arrows). t, tumors; l, lungs; h, heart.
- D
May–Gruenwald–Giemsa‐stained pleural cells (macrophages, MΦ: black arrow; lymphocytes, LΦ: purple arrow; neutrophils, NΦ: green arrow; eosinophils, EΦ: orange arrow).
- E
Effusion cytology and biochemistry data summary (total n = 10 mice; n = 4, 3, and 3 effusions from mice injected with KPM1, KPM2, and KPM3 cells, respectively, were analyzed and shown are pooled data).
- F, G
C57BL/6 mice received pleural KPM1 cells followed by a single intrapleural injection of liposomes containing 1% DMSO or 15 mg/kg deltarasin in 1% DMSO at day 9 post‐tumor cells. Shown are data summaries of MPE volume (n = 8 and 7 DMSO and deltarasin‐treated mice/group, respectively) and pleural fluid nucleated cells at day 19 post‐KPM1 cells (F), as well as representative images of pleural effusions (dashed lines) and tumors (t in [G]).
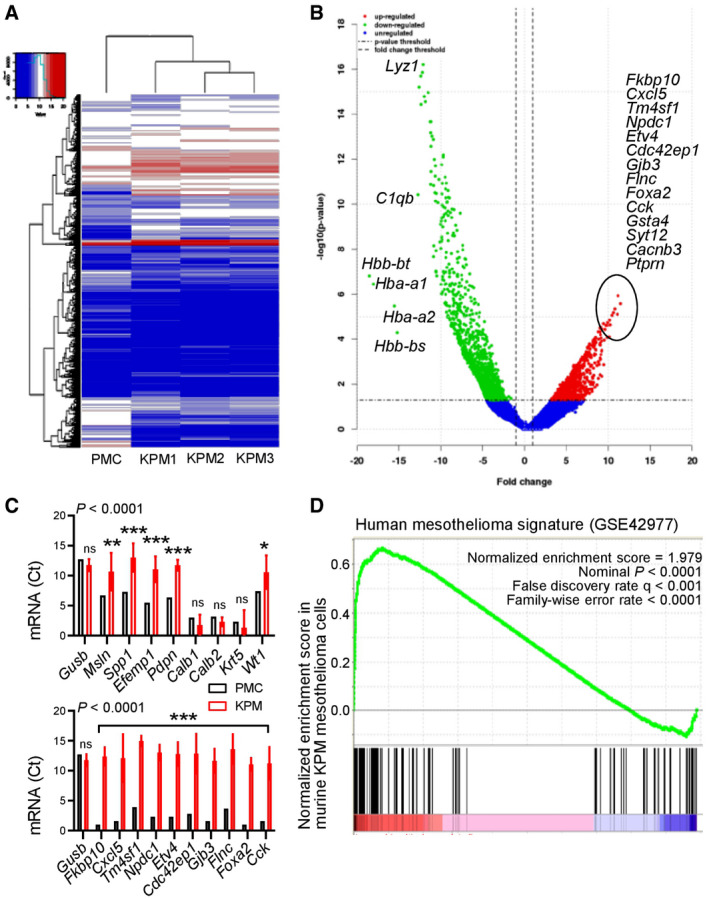
Unsupervised hierarchical clustering shows distinctive gene expression of KPM versus PMC.
Volcano plot showing some top KPM versus PMC differentially expressed genes.
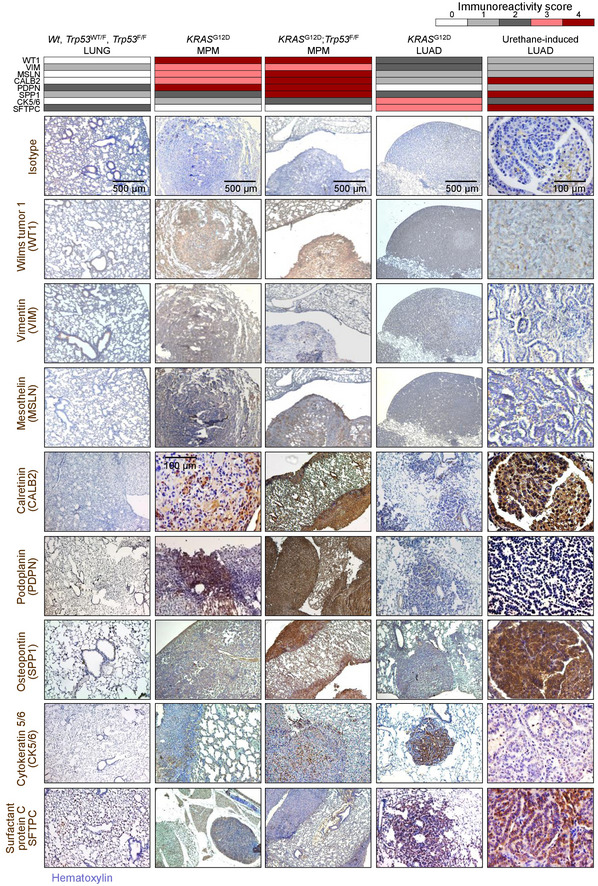
KPM and PMC expression of classic mesothelioma markers (top) and top KPM versus PMC overexpressed genes (bottom).
Gene set enrichment analysis, including enrichment score and nominal probability value of the 150 gene‐signature specifically over‐represented in human mesothelioma compared with other thoracic malignancies derived from 113 patients (GSE42977) within the transcriptome of KPM cells versus PMC shows significant enrichment of the human mesothelioma signature in KPM cells.
References
Publication types
MeSH terms
Substances
Associated data
- Actions
- Actions
LinkOut - more resources
Full Text Sources
Medical
Molecular Biology Databases
Research Materials
Miscellaneous
