. 2021 Dec;11(12):e661.
doi: 10.1002/ctm2.661.

METTL1 promotes hepatocarcinogenesis via m7 G tRNA modification-dependent translation control

Affiliations

METTL1 promotes hepatocarcinogenesis via m7 G tRNA modification-dependent translation control

Zhihang Chen et al. Clin Transl Med. 2021 Dec.

Abstract

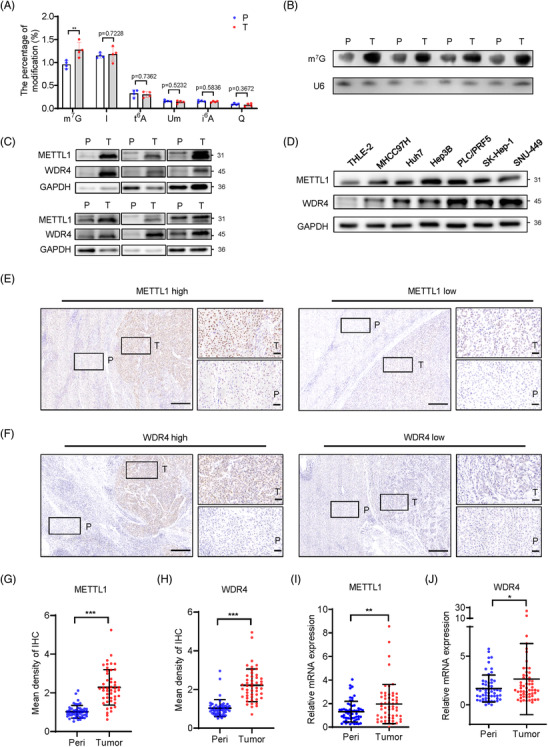
Background: N7 -methylguanosine (m7 G) modification is one of the most common transfer RNA (tRNA) modifications in humans. The precise function and molecular mechanism of m7 G tRNA modification in hepatocellular carcinoma (HCC) remain poorly understood.

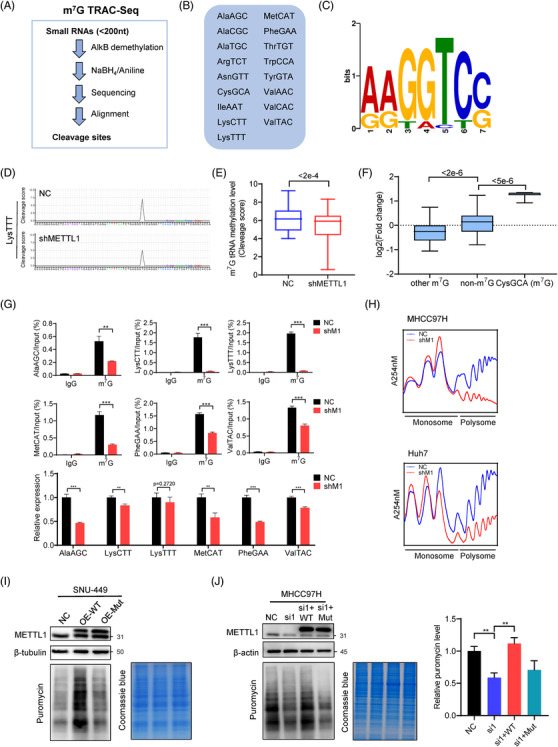
Methods: The prognostic value and expression level of m7 G tRNA methyltransferase complex components methyltransferase-like protein-1 (METTL1) and WD repeat domain 4 (WDR4) in HCC were evaluated using clinical samples and TCGA data. The biological functions and mechanisms of m7 G tRNA modification in HCC progression were studied in vitro and in vivo using cell culture, xenograft model, knockin and knockout mouse models. The m7 G reduction and cleavage sequencing (TRAC-seq), polysome profiling and polyribosome-associated mRNA sequencing methods were used to study the levels of m7 G tRNA modification, tRNA expression and mRNA translation efficiency.

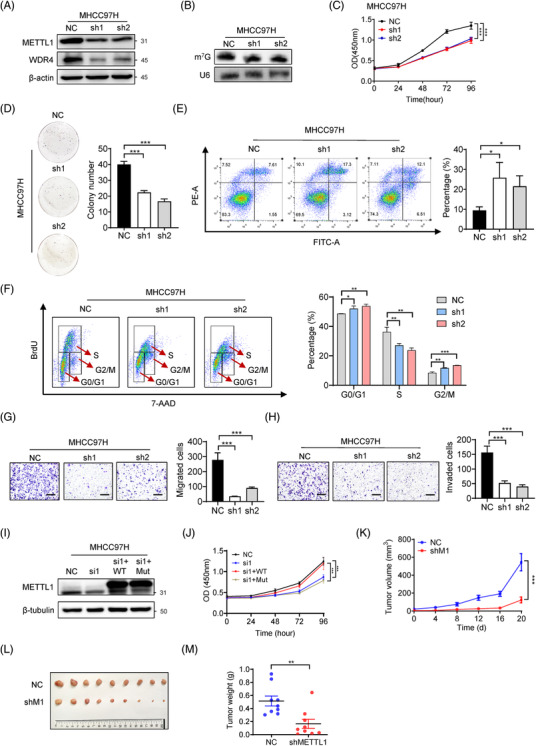
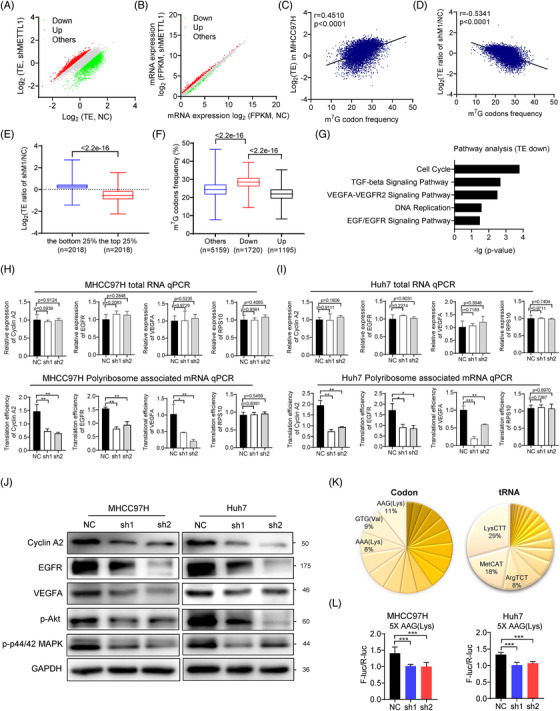
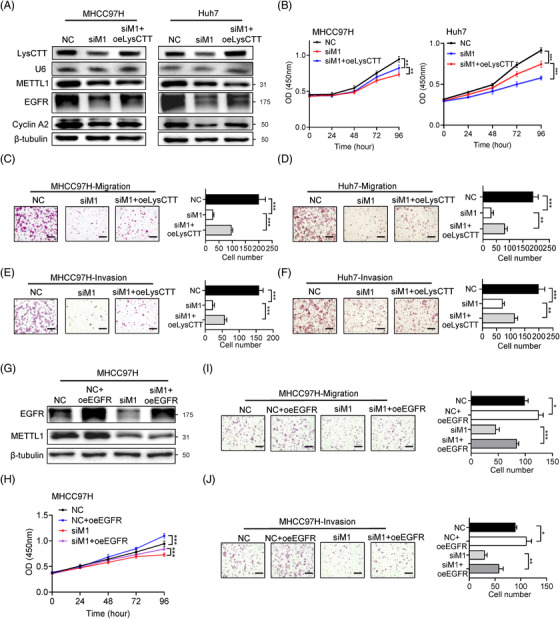
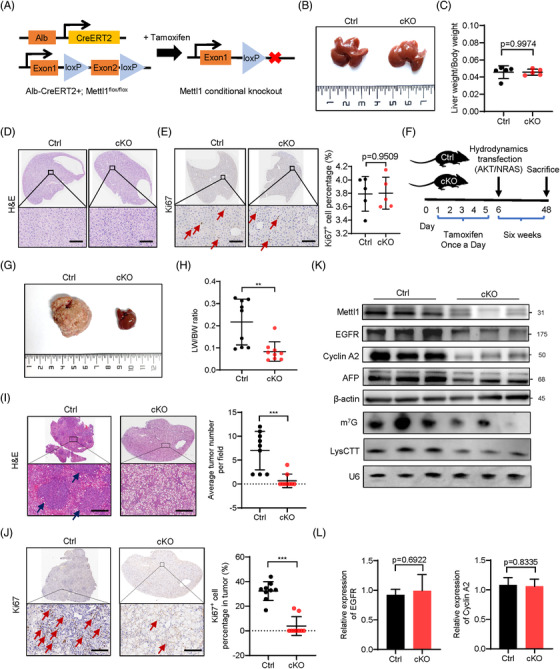
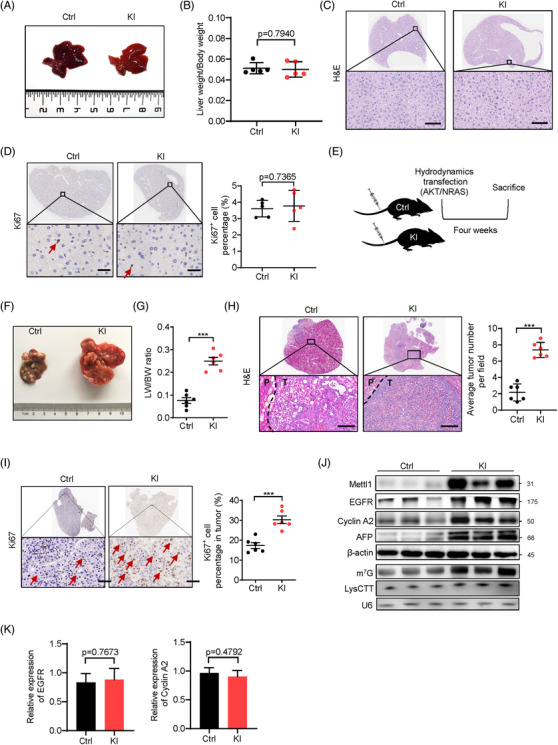
Results: The levels of METTL1 and WDR4 are elevated in HCC and associated with advanced tumour stages and poor patient survival. Functionally, silencing METTL1 or WDR4 inhibits HCC cell proliferation, migration and invasion, while forced expression of wild-type METTL1 but not its catalytic dead mutant promotes HCC progression. Knockdown of METTL1 reduces m7 G tRNA modification and decreases m7 G-modified tRNA expression in HCC cells. Mechanistically, METTL1-mediated tRNA m7 G modification promotes the translation of target mRNAs with higher frequencies of m7 G-related codons. Furthermore, in vivo studies with Mettl1 knockin and conditional knockout mice reveal the essential physiological function of Mettl1 in hepatocarcinogenesis using hydrodynamics transfection HCC model.

Conclusions: Our work reveals new insights into the role of the misregulated tRNA modifications in liver cancer and provides molecular basis for HCC diagnosis and treatment.

Keywords: N7-methylguanosine; hepatocellular carcinoma; tRNA modifications; translation control; tumour progression.


Conflict of interest statement

The authors have declared that no conflict of interest exists.

Figures

FIGURE 1
FIGURE 1
m7G tRNA modification and its catalyzing enzyme components METTL1 and WDR4 are elevated in HCC. (A) The percentage of m7G tRNA modification and other tRNA modifications in four pairs of HCC tissues and corresponding normal liver tissues identified by liquid chromatography‐coupled mass spectrometry. Paired Student's t test was used (n = 4). (B) Northwestern blot of m7G tRNA modification in four pairs of HCC tissues and corresponding normal liver tissues. U6 northern blot serves as a loading control. (C) Western blot of METTL1 and WDR4 in six pairs of HCC tissues and corresponding peritumoural tissues. GAPDH serves as a loading control. (D) Western blot of METTL1 and WDR4 in HCC cell lines. A normal liver cell line THLE‐2 was used as a normal control and GAPDH serves as a loading control. (E, F) Representative images of METTL1 (E) and WDR4 (F) IHC staining in HCC specimens. The mean density of IHC staining less than median was defined as low, while more than median was defined as high. Scale bar, 250 μm. (G, H) Quantification of METTL1 (G) and WDR4 (H) IHC staining intensity in HCC specimens. Paired Student's t test was used (n = 48). (I, J) qRT‐PCR analysis of METTL1 (I) and WDR4 (J) mRNA expression in HCC specimens. Wilcoxon signed rank test was used (n = 57). Data presented as mean ± SD. *p < .05, **p < .01, ***p < .001 by Student's t test or the Mann–Whitney U test unless specified. Abbreviations: IHC, immunohistochemistry; I, inosine; i6A, N6‐isopentenyladenosine; P, peri‐tumour tissue; Peri, peri‐tumour tissue; Q, queuosine; T, tumour tissue; t6A, N6‐threonylcarbamoyladenosine; Um, 2′‐O‐methyluridine
FIGURE 2
FIGURE 2
Inhibition of METTL1 impairs HCC progression in vitro and in xenograft model. (A) The knockdown effect of METTL1 in MHCC97H cells was confirmed by western blot. (B) The downregulation of m7G tRNA modification was confirmed by northwestern blot. (C) CCK‐8 assay of METTL1 knockdown and control MHCC97H cells. Data presented as mean ± SD (six technical replicates). (D) Representative images and quantification of clone formation in METTL1 depleted and control MHCC97H cells. Data presented as mean ± SD (three technical replicates). (E) Representative images and quantification of cell apoptosis assays in MHCC97H cells with or without METTL1 knockdown. Data presented as mean ± SD (three technical replicates). (F) Cell cycle analysis and quantification of METTL1 depleted and control MHCC97H cells. Data presented as mean ± SD (three technical replicates). (G) Representative images and quantification of migration in METTL1 depleted and control MHCC97H cells. Scale bar, 500 μm. Data presented as mean ± SD (three technical replicates). (H) Representative images and quantification of invasion in METTL1 depleted and control MHCC97H cells. Scale bar, 500 μm. Data presented as mean ± SD (three technical replicates). (I) Validation of the rescue of METTL1 by western blot in MHCC97H cells. siMETTL1‐1 was used. (J) CCK‐8 assay of METTL1 knockdown MHCC97H cells with rescue expression of wild‐type METTL1 or the mutant. (K) Growth of subcutaneous transplanted tumours in NC and shMETTL1 group. Tumour sizes were measured every 4 days. Data presented as mean ± SEM (n = 9). shMETTL1‐2 was used. (L) Overview of subcutaneous transplanted tumours in NC and shMETTL1 group. (M) Tumour weights formed in NC and shMETTL1 group at the time of sacrifice. Data presented as mean ± SEM (n = 9). *p < .05, **p < .01, ***p < .001 by Student's t test, one‐way ANOVA or the Mann–Whitney U test unless specified. All the in vitro assays were biologically repeated for three times. Abbreviations: Mut, mutant METTL1; NC, negative control; sh1, shMETTL1‐1; sh2, shMETTL1‐2; shM1, shMETTL1; si1, siMETTL1‐1; WT, wild‐type METTL1
FIGURE 3
FIGURE 3
METTL1 regulates m7G tRNA methylome, tRNA expression and global mRNA translation. (A) Flowchart of m7G TRAC‐Seq. (B) List of m7G‐modified tRNA identified in MHCC97H cells. (C) Sequence motif in the m7G sites identified by TRAC‐seq. (D) Representative images of cleavage scores of indicated tRNA in MHCC97H cells with or without METTL1 knockdown. (E) Global m7G tRNA methylation level of MHCC97H cells with or without METTL1 knockdown. Wilcoxon signed‐rank test was used. (F) Expression level of m7G‐modified and non‐m7G‐modified tRNAs revealed by TRAC‐seq. Fold change was calculated as the ratio of tRNA expression level of shMETTL1 group to the control group. (G) Validation of the downregulated expression of m7G‐modified tRNAs upon METTL1 depletion by m7G methylated tRNA immunoprecipitation qPCR. Relative expression of specific tRNA was obtained using input samples and U6 served as an internal control. The shMETTL1‐2 was used in this experiment (three technical replicates). (H) Polysome profiling of Huh7 and MHCC97H with or without METTL1 knockdown. shMETTL1‐2 was used in this experiment. (I) Global translation of SNU‐449 cells with overexpression of wild‐type or mutant METTL1. Coomassie brilliant blue staining of the gel was used as control. (J) Puromycin intake assay of siMETTL1 MHCC97H cells rescued by wild‐type METTL1 or its catalytic dead mutant. Coomassie brilliant blue staining of the gel was used as control. Quantitation of the bands was showed (three biological replicates). siMETTL1‐1 was used. Data presented as mean ± SD. *p < .05, **p < .01, ***p < .001 by Student's t test or the Mann–Whitney U test unless specified. Abbreviations: Mut, mutant METTL1; NC, negative control; shM1, shMETTL1; si1, siMETTL1‐1; WT, wild‐type METTL1
FIGURE 4
FIGURE 4
m7G tRNA modification regulates HCC mRNA translation in a codon‐dependent manner. (A) Scatterplot of translation efficiency (TE) in the MHCC97 cells with or without METTL1 knockdown. TE was calculated as the ratio of the polyribosome signals to the input signals. (B) Scatterplot of mRNA expression in the MHCC97 cells with or without METTL1 knockdown. (C) Correlation of m7G‐related codons frequency and translation efficiency in MHCC97H. Pearson correlation analysis was used. (D) Correlation of m7G‐related codons frequency and translation ratio. Translation ratio was calculated as the ratio of the translation efficiency of shMETTL1 group to the control group. Pearson correlation analysis was used. (E) Translation ratio of mRNAs in low (n = 2018) and high (n = 2018) m7G‐related codon frequency groups. (F) Frequencies of m7G‐related codons in TE‐decreased genes (n = 1720), TE‐increased genes (n = 1195) and other genes (n = 5159). (G) Pathway analysis using the TE‐decreased genes upon METTL1 knockdown. (H, I) Relative expression and translation efficiency (TE) of Cyclin A2, EGFR and VEGFA mRNA in METTL1 depleted and control MHCC97H (H) and Huh7 (I) cells. β‐Actin was used as an internal control. TE was calculated as the ratio of the polyribosome signals to input signals. RPS10 was used as a negative control. Data presented as mean ± SD (three technical replicates). (J) Western blot of Cyclin A2, EGFR, VEGFA, p‐Akt and p‐p44/42 MAPK in METTL1 depleted and control Huh7 and MHCC97H cells. GAPDH was used as a loading control. (K) Left, m7G tRNAs decoded‐codons frequency of TE down mRNAs identified by polyribosome‐mRNA‐seq. Right, the expression profile of m7G tRNAs in MHCC97H cells. (L) 5X AAG (Lys) codon sequences were inserted in the front of firefly luciferase coding region. Depletion of METTL1 resulted in decreased luciferase activity compared to that in the controls in Huh7 and MHCC97H cells. The control reporter without any insertion was used to normalize the translation differences. Data presented as mean ± SD (three technical replicates). *p < .05, **p < .01, ***p < .001 by Student's t test, one‐way ANOVA or the Mann–Whitney U test unless specified. Polyribosome‐mRNA‐seq was biologically repeated for three times. All the in vitro assays were biologically repeated for three times. Abbreviations: NC, negative control; sh1, shMETTL1‐1; sh2, shMETTL1‐2; TE, translation efficiency
FIGURE 5
FIGURE 5
Overexpression of LysCTT and EGFR rescues HCC malignant phenotype. (A) Validation of the LysCTT, METTL1, EGFR, Cyclin A2 expression and METTL1 depletion by northern and western blots in MHCC97H and Huh7 cells. (B) CCK‐8 assay of METTL1 knockdown MHCC97H and Huh7 cells with or without overexpression of LysCTT. Data presented as mean ± SD (six technical replicates). (C, D) Representative images and quantification of migration in METTL1‐knockdown MHCC97H (C) and Huh7 (D) cells with or without overexpression of LysCTT. Scale bar, 500 μm. Data presented as mean ± SD (three technical replicates). (E, F) Representative images and quantification of invasion in METTL1‐knockdown MHCC97H (E) and Huh7 (F) cells with or without overexpression of LysCTT. Scale bar, 500 μm. Data presented as mean ± SD (three technical replicates). (G) Validation of the EGFR overexpression and METTL1 depletion by western blot in MHCC97H cells. (H) CCK‐8 assay of METTL1 knockdown MHCC97H cells with or without overexpression of EGFR. Data presented as mean ± SD (six technical replicates). (I) Representative images and quantification of migration in METTL1‐knockdown MHCC97H cells with or without overexpression of EGFR. Scale bar, 500 μm. Data presented as mean ± SD (three technical replicates). (J) Representative images and quantification of invasion in METTL1‐knockdown MHCC97H cells with or without overexpression of EGFR. Scale bar, 500 μm. Data presented as mean ± SD (three technical replicates). *p < .05, **p < .01, ***p < .001 by Student's t test, one‐way ANOVA or the Mann–Whitney U test unless specified. All the in vitro assays were biologically repeated for three times. Abbreviations: NC, negative control; oeEGFR, overexpression of EGFR; oeLysCTT, overexpression of LysCTT; siM1, siMETTL1‐1
FIGURE 6
FIGURE 6
Liver‐specific knockout of Mettl1 inhibits HCC tumourigenesis in vivo. (A) The schematic diagram of the construction of Mettl1 conditional liver‐specific knockout mice. (B) Representative image of livers harvested from Mettl1‐cKO and control group. (C) Comparison of ratio of liver weight to body weight between Mettl1‐cKO and control group. Data presented as mean ± SD (n = 5). (D) Representative images of H&E staining of control and Mettl1‐cKO mouse livers. Scale bar: 100 μm. (E) IHC staining of Ki‐67 in control and Mettl1‐cKO mouse livers. Arrows point to Ki67‐positive cells. Scale bar:100 μm. Data presented as mean ± SD (n = 5). (F) General view of hydrodynamics transfection experiment in Mettl1 conditional knockout mice and control. (G) Representative image of livers harvested from Mettl1‐cKO and control group. (H) Comparison of tumour burden between Mettl1‐cKO and control group by ratio of liver weight to body weight (LW/BW). Data presented as mean ± SD (n = 9). (I) Representative images of H&E staining of control and Mettl1‐cKO mouse livers. Arrows point to tumour lesions. Scale bar: 250 μm. The number of tumour foci in these mouse livers was evaluated. Data presented as mean ± SD (n = 9). (J) Left panel, representative images of IHC staining of Ki‐67. Arrows point to Ki67‐positive cells. Scale bar:100 μm. Right panel, the statistical analyses. Data presented as mean ± SD (n = 9). (K) Western blot of Mettl1, EGFR, Cyclin A2 and AFP in tumour tissues from control group and Mettl1‐cKO group. β‐Actin was used as a loading control. Downregulation of m7G tRNA modification and LysCTT in Mettl1‐cKO group was confirmed by northwestern blot and northern blot. U6 was used as a loading control. (L) qRT‐PCR analysis of Cyclin A2 and EGFR mRNA levels in tumour tissues from control group and Mettl1‐cKO group. Data presented as mean ± SD (n = 3). *p < .05, **p < .01, ***p < .001 by Student's t test, one‐way ANOVA or the Mann–Whitney U test unless specified. All the in vitro assays were biologically repeated for three times. Abbreviations: cKO, conditional knockout; Ctrl, control
FIGURE 7
FIGURE 7
Overexpression of METTL1 promotes HCC progression in vivo. (A) Representative image of livers harvested from Mettl1‐KI and control group. (B) Comparison of ratio of liver weight to body weight between Mettl1‐KI and control group. Data presented as mean ± SD (n = 5). (C) Representative images of H&E staining of control and Mettl1‐KI mouse livers. Scale bar: 100 μm. (D) IHC staining of Ki‐67 in control and Mettl1‐KI mouse livers. Arrows point to Ki67‐positive cells. Scale bar: 50 μm. Data presented as mean ± SD (n = 5). (E) General view of hydrodynamics transfection experiment. AKT and NRAS plasmids along with SB transposase were injected into control and Mettl1 knockin mice (Mettl1‐KI mice). The mice were sacrificed after 4 weeks. n = 6. (F) Representative image of livers harvested from Mettl1‐KI and control group. (G) Comparison of tumourigenic capacity between Mettl1‐KI and control group by ratio of liver weight to body weight (LW/BW). Data presented as mean ± SD (n = 6). (H) Representative images of H&E staining of control and Mettl1‐KI mouse livers. Scale bar: 100 μm. The number of tumour foci in these mouse livers was evaluated. P, peri‐tumour; T, tumour. Data presented as mean ± SD (n = 6). (I) IHC staining of Ki‐67. Scale bar: 50 μm. Arrows point to Ki67‐positive cells. Data presented as mean ± SD (n = 6). (J) Western blot of Mettl1, EGFR, Cyclin A2 and AFP in tumour tissues from control group and Mettl1‐KI group. β‐Actin was used as a loading control. Upregulation of m7G tRNA modification and LysCTT in Mettl1‐KI group was confirmed by northwestern blot and northern blot. U6 was used as a loading control. (K) qRT‐PCR analysis of Cyclin A2 and EGFR mRNA levels in tumour tissues from control group and Mettl1‐KI group. Data presented as mean ± SD (n = 3). *p < .05, **p < .01, ***p < .001 by Student's t test, one‐way ANOVA or the Mann–Whitney U test unless specified. All the in vitro assays were biologically repeated for three times. Abbreviations: Ctrl, control; KI, knockin

References

    1. Bray F, Ferlay J, Soerjomataram I, et al. Global cancer statistics 2018: GLOBOCAN estimates of incidence and mortality worldwide for 36 cancers in 185 countries. CA Cancer J Clin. 2018;68:394‐424. - PubMed
    1. Villanueva A. Hepatocellular carcinoma. N Engl J Med. 2019;380:1450‐1462. - PubMed
    1. Lee DH, Lee JM, Lee JY, et al. Radiofrequency ablation of hepatocellular carcinoma as first‐line treatment: long‐term results and prognostic factors in 162 patients with cirrhosis. Radiology. 2014;270:900‐909. - PubMed
    1. Roayaie S, Jibara G, Tabrizian P, et al. The role of hepatic resection in the treatment of hepatocellular cancer. Hepatology. 2015;62:440‐451. - PubMed
    1. Dawson MA, Kouzarides T. Cancer epigenetics: from mechanism to therapy. Cell. 2012;150:12‐27. - PubMed

Publication types