Review
. 2022 Feb;9(4):e2102924.
doi: 10.1002/advs.202102924. Epub 2021 Dec 13.

2D Material-Based Optical Biosensor: Status and Prospect

Affiliations
Review

2D Material-Based Optical Biosensor: Status and Prospect

Zong-Lin Lei et al. Adv Sci (Weinh). 2022 Feb.

Abstract

The combination of 2D materials and optical biosensors has become a hot research topic in recent years. Graphene, transition metal dichalcogenides, black phosphorus, MXenes, and other 2D materials (metal oxides and degenerate semiconductors) have unique optical properties and play a unique role in the detection of different biomolecules. Through the modification of 2D materials, optical biosensor has the advantages that traditional sensors (such as electrical sensing) do not have, and the sensitivity and detection limit are greatly improved. Here, optical biosensors based on different 2D materials are reviewed. First, various detection methods of biomolecules, including surface plasmon resonance (SPR), fluorescence resonance energy transfer (FRET), and evanescent wave and properties, preparation and integration strategies of 2D material, are introduced in detail. Second, various biosensors based on 2D materials are summarized. Furthermore, the applications of these optical biosensors in biological imaging, food safety, pollution prevention/control, and biological medicine are discussed. Finally, the future development of optical biosensors is prospected. It is believed that with their in-depth research in the laboratory, optical biosensors will gradually become commercialized and improve people's quality of life in many aspects.

Keywords: 2D materials; evanescent wave; fluorescence resonance energy transfer; optical biosensor; surface plasmon resonance.


Conflict of interest statement

The authors declare no conflict of interest.

Figures

Figure 1
Figure 1
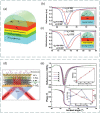
The basic framework of 2D material‐based optical biosensor.
Figure 2
Figure 2
Different coupling structures of optical sensor. a) Otto configuration in prism coupling. b) Kretschmann configuration in prism coupling. c) Waveguide coupling. d) Grating coupling. e) Unclad/etched sensing structure in optical fiber coupling. f) Sensing structure in D‐shaped fiber coupling. Reproduced with permission.[ 21 ] Copyright 2020, Elsevier.
Figure 3
Figure 3
a) Diagram of fluorescence resonance energy transfer (FRET). b) The function diagram of energy transfer efficiency E and r/R 0. Reproduced with permission.[ 28 ] Copyright 2017, Elsevier. c,d) Selectivity of 2D materials as fluorescence quenching agents. Reproduced with permission.[ 33 ] Copyright 2013, American Chemical Society.
Figure 4
Figure 4
a) Schematic diagram of three‐layer evanescent wave‐based fiber optic sensor for hemoglobin detection using graphene layer. Reproduced with permission.[ 38 ] Copyright 2018, Elsevier. b) Schematic diagram of evanescent wave fluorescence sensor.
Figure 5
Figure 5
a) Graphene and its derivatives, including the 0D, 1D, and 2D allotropes of graphene. Reproduced with permission.[ 47 ] Copyright 2012, Wiley‐VCH. b) Transmission spectrum of monolayer graphene. c) Photoluminescence of single‐layer and multilayer graphene films. Reproduced with permission.[ 48 ] Copyright 2017, Wiley‐VCH. d) Angle‐dependent reflectance ratio plots of different thicknesses of reduced graphene oxide. Reproduced with permission.[ 50 ] Copyright 2014, American Chemical Society. e) Coordination characterization of triangular prism (2H), octahedron (1T), or dimer (1T′). f) Photoluminescence and Raman spectra of four typical single‐layer semiconductor transition metal dichalcogenides. Reproduced with permission.[ 53 ] Copyright 2013, Springer Nature. g) Typical Raman spectra and high‐ and low‐frequency internal vibration modes of black phosphorus. Reproduced with permission.[ 58 ] Copyright 2017, Wiley‐VCH. h) TEM images of MXene nanosheets. i) Single‐layer and double‐layer MXene images. Reproduced with permission.[ 59 ] Copyright 2011, Wiley‐VCH. j) Crystal structure of antimonene. k) Raman spectra of few‐layer Sb and bulk Sb. Reproduced with permission.[ 60 ] Copyright 2017, Wiley‐VCH.
Figure 6
Figure 6
Top‐down and bottom‐up approaches of 2D materials.
Figure 7
Figure 7
Optical biosensors based on graphene and its derivatives. a) Schematic diagram of the designed graphene‐bimetal SPR biosensor. The Au–Ag bimetal is formed by coating silver and gold films on a titanium film layer. b) Electric field distribution on the graphene‐bimetal sensing surface. Reproduced with permission.[ 97 ] Copyright 2018, Elsevier. c) Kretschmann configuration of graphene oxide–Au substrate. Reproduced with permission.[ 98 ] Copyright 2015, American Chemical Society. d) SPR biosensor chip based on copper dielectric plasma interface. Reproduced with permission.[ 100 ] Copyright 2018, American Chemical Society. e) Schematic diagram of immune‐sensor for ultrasensitive unlabeled antibody‐antigen in dual‐peak long‐period grating. Reproduced with permission.[ 101 ] Copyright 2017, Elsevier. f) Graphene gold hybrid plasma biosensor. ssDNA molecules are adsorbed on graphene monolayers by π stacking between aromatic rings and carbon atoms in honeycomb lattice. g) Variation of normalized electric field intensity of graphene with different layers. h) Change of transmission spectrum of graphene sensor in detecting ssDNA concentration. Reproduced with permission.[ 102 ] Copyright 2017, Wiley‐VCH.
Figure 8
Figure 8
a) Four‐cone fiber probe. b) Five‐cone fiber probe. c) Eight‐cone fiber probe. d) Experimental setup. Reproduced with permission.[ 104 ] Copyright 2020, Elsevier.
Figure 9
Figure 9
Graphene‐based FRET biosensor. a) Experimental setup. b) Structure of fiber mode‐interferometer. c) Fluorescence changes before and after dopamine detection. d) Fluorescence changes before and after detection of ssDNA. Reproduced with permission.[ 105 ] Copyright 2016, Springer Nature. e) Chemical mechanism of biothiol detection based on FRET system. Reproduced with permission.[ 108 ] Copyright 2020, Elsevier.
Figure 10
Figure 10
Various biosensors based on graphene and its derivatives. a) Bright‐field images of mouse cerebral cortex under cranial window. Reproduced with permission.[ 109 ] Copyright 2014, Springer Nature. b) Tilted fiber grating based on graphene. Reproduced with permission.[ 110 ] Copyright 2016, Optical Society of America. c) Graphene oxide sheets‐SPR sensor attached graphene. Reproduced with permission.[ 111 ] Copyright 2018, American Chemical Society. d) Graphene‐based mid‐infrared plasma biosensor. Reproduced with permission.[ 112 ] Copyright 2015, Science. e) Hexagonal optical antenna based on graphene. Reproduced with permission.[ 113 ] Copyright 2018, Springer. f) D‐type photonic crystal fiber surface plasmon resonance biosensor composed of photonic crystal fiber, graphene, and metal. Reproduced with permission.[ 114 ] Copyright 2018, Elsevier. g) The working principle of molecular beacon, the interaction between SurMB‐Joe and graphene oxide and tDNA. Reproduced with permission.[ 116 ] Copyright 2018, MDPI. h) Graphical reaction of ABTS with H2O2 catalyzed by magnetic nanoparticle/nitrogen‐doped grapheme nanocomposites. Reproduced with permission.[ 117 ] Copyright 2016, American Chemical Society. i) Multimode fiber‐photonic crystal fiber‐multimode fiber sensor structure. Reproduced with permission.[ 118 ] Copyright 2018, Elsevier.
Figure 11
Figure 11
a) Schematic diagram of 2D biosensor based on 2D materials. b) Effect of MoS2 and WS2 layers on sensitivity and figure of merit of sensor. c) Effect of MoSe2 and WSe2 layers on sensitivity and figure of merit of sensor. Reproduced with permission.[ 119 ] Copyright 2018, Elsevier.
Figure 12
Figure 12
a) Normalized layer‐dependent photoluminescence spectra of MoS2. Reproduced with permission.[ 123 ] Copyright 2019, Springer Nature. b) Schematic diagram of interaction between dopamine and MoS2 quantum dots dispersed over MoS2 nanosheets. c) Fluorescence response of MoS2 quantum dots with different concentrations of dopamine. Reproduced with permission.[ 124 ] Copyright 2018, The Royal Society of Chemistry.
Figure 13
Figure 13
a) Structure diagram of optical biosensor based on graphene–MoS2. b) The change of sensitivity with the refractive index of prism. c) Sensitivity changes with MoS2 layers. d) The change of the light reflection intensity with respect to the incident angle at different number of MoS2 layers. e) SPR curve of spectral interrogation with different number of MoS2 layers. Reproduced with permission.[ 126 ] Copyright 2019, Elsevier. f) Highly sensitive Au–MoS2–graphene hybrid SPR sensor. Reproduced with permission.[ 127 ] Copyright 2017, Elsevier. g) Optical biosensor based on hybrid MgF2 prism and graphene–MoS2 layer. Reproduced with permission.[ 128 ] Copyright 2018, Optical Society of America. h) Multilayer optical biosensor. Reproduced with permission.[ 129 ] Copyright 2017, Elsevier.
Figure 14
Figure 14
Optical biosensor based on MoS2 composite. a) Schematic diagram of a proposed SPR sensor configuration. b) Reflection curve of different materials. c) Reflection curves of simultaneous interpreting SPR sensors with different refractive index of sensing layer. d) A comparative study on sensitivity, detection accuracy and quality factor of different materials. Reproduced with permission.[ 130 ] Copyright 2019, Elsevier. e) Optical fiber sensor based on loss mode resonance. Reproduced with permission.[ 132 ] Copyright 2018, Elsevier. f) Optical sensor based on near infrared SPR. Reproduced with permission.[ 134 ] Copyright 2018, Elsevier. g) The construction process of explosion detection biosensor based on nanocomposites.[ 135 ] Copyright 2018, Elsevier.
Figure 15
Figure 15
a) SPR biosensor based on transition metal dichalcogenide. Reproduced with permission.[ 136 ] Copyright 2016, Springer Nature. b) Schematic diagram of the SPR sensor system. c) Resonance angle of the sensor based on bimetal film and graphene, MoS2, or WS2 film relative to the refractive index of the analyte layer. d) Reflectivity varies with the number of layers of graphene, MoS2, and WS2. The illustrations show the minimum reflectivity values for Au, Ag, graphene, MoS2, and WS2. Reproduced with permission.[ 138 ] Copyright 2017, Royal Society of Chemistry. e) Near‐infrared SPR sensor based on 2D heterostructure. Reproduced with permission.[ 141 ] Copyright 2019, MDPI. f) SPR biosensor based on ITO–WS2 hybrid structure. Reproduced with permission.[ 142 ] Copyright 2019, Springer. g) Detection of miRNA using WS2 nanoparticles as fluorescence quencher. Reproduced with permission.[ 143 ] Copyright 2014, American Chemical Society. h) Optical biosensor based on WS2 and MoS2. Reproduced with permission.[ 144 ] Copyright 2017, Springer Nature.
Figure 16
Figure 16
a) Graphene/WSe2 thin‐film optical sensor. b) Graphene /WSe2 nanobelt optical sensor. c) Schematic diagram of SPR reflection spectrum of optical sensor for two different analytes. Reproduced with permission.[ 146 ] Copyright 2020, Springer. d) WSe2/black phosphorus/WSe2 single‐layer sandwich heterostructures are used for fluorescence imaging of biological species. Reproduced with permission.[ 148 ] Copyright 2020, Springer.
Figure 17
Figure 17
a) Near‐infrared plasma sensor with four‐layer structure. Reproduced with permission.[ 149 ] Copyright 2018, Elsevier. b) SPR sensing structure for goat‐antirabbit IgG detection. c) Preparation and modification of MoSe2–Au membrane for IgG immunoassay. d) Response curves of goat antirabbit IgG with different concentrations. Reproduced with permission.[ 150 ] Copyright 2019, Institute of Electrical and Electronics Engineers.
Figure 18
Figure 18
a) Sensitivity test of SPR sensor with black phosphorus/graphene/transition metal dichalcogenides hybrid structure. b) Structure diagram, intensity sensitivity, and phase sensitivity diagram of traditional sensors. c) Structure diagram, intensity sensitivity, and phase sensitivity diagram of sensor based on black phosphorus. Reproduced with permission.[ 152 ] Copyright 2017, Elsevier. d) Biosensor based on halloysite nanotubes, MoS2, and black phosphorus layers structure diagram. e) Variation of reflectivity and phase with incident angle and the number of black phosphorus layers. Illustration shows the SPR curve of black phosphorus film with different thickness, full width at tenth maximum change and detection sensitivity with angle and phase. Reproduced with permission.[ 153 ] Copyright 2019, The Royal Society of Chemistry.
Figure 19
Figure 19
a) Black phosphorus nanosheets coated with peptide micelles. Reproduced with permission.[ 154 ] Copyright 2019, American Chemical Society. b) Lossy‐mode resonance sensor without protective layer N3 (CYTOP). c) Lossy‐mode resonance sensor with CYTOP. Reproduced with permission.[ 124 ] Copyright 2018, American Chemical Society. d) High selectivity detection and sensing platform for BPA based on fluorescence. Reproduced with permission.[ 156 ] Copyright 2020, Elsevier. e) Schematic diagram of protease detection and analysis system. Reproduced with permission.[ 157 ] Copyright 2019, Elsevier. f) Schematic diagram of IFE fluorescence colorimetric detection of Hg2+ based on black phosphorus quantum dots and TPPS. g) Catalytic effect of Hg2+ on the coordination reaction between Mn2+ and TPPS. Reproduced with permission.[ 158 ] Copyright 2017, American Chemical Society.
Figure 20
Figure 20
a) Preparation of Ti3C2T x MXene nanosheets by HF selective etching. b) SEM and HRTEM images of Ti3C2T x MXene delamination after HF corrosion, respectively. c) X‐ray diffraction patterns of initial Ti3AlC2 (black line), HF etched Ti3AlC2 (red line), and exfoliated Ti3C2T x (blue line). d) Variation diagram of normalized light intensity relative to wavelength of optical fiber sensor with MXene layer attached. Reproduced with permission.[ 162 ] Copyright 2020, American Chemical Society.
Figure 21
Figure 21
a) Multilayer SPR biosensor. Reproduced with permission.[ 164 ] Copyright 2020, Elsevier. b) Schematic illustration of the SPR sensor with Ti3C2T x and 2D transition metal dichalcogenides. Reproduced with permission.[ 165 ] Copyright 2019, MDPI. c) Fluorescence quenching and recovery of Ti3C2T x . Reproduced with permission.[ 166 ] Copyright 2018, American Chemical Society. d) Schematic diagram of optical fiber strain sensor. e) Schematic diagram of human posture monitoring, analysis and correction system based on intelligent wearable fabric. Reproduced with permission.[ 167 ] Copyright 2019, The Royal Society of Chemistry.
Figure 22
Figure 22
a) Fabrication of a microRNA sensor integrated with antimonene nanosheets. b) Electromagnetic field intensity distribution of individual AuNRs. c) Enhancement of AuNRs local electric field distribution. Reproduced with permission.[ 169 ] Copyright 2019, Springer Nature. d) Schematic diagram and fluorescence change diagram of microRNA detection based on bismuthene nanosheets. Reproduced with permission.[ 171 ] Copyright 2020, The Royal Society of Chemistry. e) Scheme of optical gene engineering neuron system and artificial photoelectric sensor motion device. Reproduced with permission.[ 173 ] Copyright 2019, Springer Nature.
Figure 23
Figure 23
a) Structure diagram of optical biosensor. b) Transmission spectra at different concentrations of BSA. Reproduced with permission.[ 174 ] Copyright 2018, American Chemical Society. c) Structure diagram of the micro‐ring resonator. d) Schematic diagram of optical sensing mechanism. e) Changes in electronic band structure of the synthesized H0.3MoO3; (left) Samples exposed to acidic environment with high H+ dopant concentration; (right) Sample exposed to extreme alkaline environment and all H+ dopants are completely extracted. Reproduced with permission.[ 175 ] Copyright 2019, Wiley‐VCH.
Figure 24
Figure 24
Biological imaging sensor based on 2D materials. a) CMOS–graphene quantum dot image sensor. b) Side view of graphene photoconductor and readout circuit. Reproduced with permission.[ 179 ] Copyright 2017, Springer Nature. c) Artificial neural network photodiode array. d) Practical artificial neural network image device based on WSe2. e) Schematic diagram of optical setting. Reproduced with permission.[ 181 ] Copyright 2020, Springer Nature. f) Schematic diagram of refractive index sensing of living cells on graphene surface. g) Schematic diagram of optical system structure. Reproduced with permission.[ 182 ] Copyright 2018, The Royal Society of Chemistry.
Figure 25
Figure 25
Food safety and environmental pollution prevention/control. a) Schematic diagram of optical biosensor based on SPR. b) SPR spectra of different concentrations of HT‐2 in phosphate‐buffered saline and the variation of amplitude ψ with the concentration of HT‐2. c) SPR spectra of different concentrations of HT‐2 in phosphate‐buffered saline and the variation of phase (Δ) with the concentration of HT‐2. Reproduced with permission.[ 187 ] Copyright 2019, Springer Nature. d) Structure of SPR sensor for bacterial detection. Reproduced with permission.[ 188 ] Copyright 2018, Elsevier. e) Schematic diagram of graphene activated photoplasma cavity based on coiled nanofilm. f) Mode shift of R6G molecular layer thickness with degradation. Reproduced with permission.[ 189 ] Copyright 2019, American Chemical Society. g) Schematic illustration of photocatalytic mechanism of nanocomposites. Reproduced with permission.[ 190 ] Copyright 2019, Elsevier.
Figure 26
Figure 26
a) Reduced graphene oxide‐based optical refractive index sensor for cell detection. Reproduced with permission.[ 50 ] Copyright 2014, American Chemical Society. b) Microfiber sensor with black phosphorus supported gold nano‐interface. Reproduced with permission.[ 193 ] Copyright 2019, AAAS. c) Detection procedure of hypersensitive SPR biosensor for detection of carcinoembryonic antigen. Reproduced with permission.[ 197 ] Copyright 2019, Elsevier. d) Graphene‐coated Au–Ag alloy hollow nanoshell structure. e) SPR peak wavelength of monolayer graphene‐coated Au–Ag alloy hollow nanoshells. f) Density diagram of extinction efficiency as a function of internal radius and Au–Ag shell thickness. Reproduced with permission.[ 195 ] Copyright 2019, American Chemical Society. g) Surface plasmon resonance sensors for DNA hybridization with graphene WS2 coatings. Reproduced with permission.[ 202 ] Copyright 2018, Elsevier. h) Process of synthesizing graphene/ITO nanorods metamaterial/U‐bend anneal sensor. Reproduced with permission.[ 203 ] Copyright 2019, MPDI.
Figure 27
Figure 27
a) MoS2‐modified optical fiber SPR biosensor. b,c) Comparison of different compound specificity of optical fiber SPR biosensor with and without MoS2 coating in PBS solution. Reproduced with permission.[ 7 ] Copyright 2019, Springer Nature. d) Photonic crystal fiber sensor based on anti resonant reflection waveguide. Reproduced with permission.[ 207 ] Copyright 2017, Optical Society of America. e) Schematic diagram of high density curved image sensor array. f) Design of high density bending image sensor array. Reproduced with permission.[ 210 ] Copyright 2017, Springer Nature. g) Design of mechanical sensor system in somatosensory system. Reproduced with permission.[ 211 ] Copyright 2020, Springer Nature.
Figure 28
Figure 28
Application of optical biosensor based on 2D materials.
Figure 29
Figure 29
The roadmap of 2D materials based optical biosensors.

References

    1. O'Brien C., Varty K., Ignaszak A., Microsyst. Nanoeng. 2021, 7, 16. - PMC - PubMed
    1. Westerveld W. J., Mahmud‐Ul‐Hasan M., Shnaiderman R., Ntziachristos V., Rottenberg X., Severi S., Rochus V., Nat. Photonics 2021, 15, 341.
    1. Zhang H., Li X., He F., Zhao M., Ling L., Sci. Rep. 2018, 8, 12021. - PMC - PubMed
    1. Catalán‐Gómez S., Briones M., Cortijo‐Campos S., García‐Mendiola T., Andrés A. d., Garg S., Kung P., Lorenzo E., Pau J. L., Redondo‐Cubero A., Sci. Rep. 2020, 10, 16039. - PMC - PubMed
    1. Yanik A. A., Huang M., Kamohara O., Artar A., Geisbert T. W., Connor J. H., Altug H., Nano Lett. 2010, 10, 4962. - PMC - PubMed

Publication types

MeSH terms

LinkOut - more resources