3D Visualization of the Dynamic Bidirectional Talk Between ER/PR and Her2 Pathways
- PMID: 34898327
- PMCID: PMC8674721
- DOI: 10.1177/15330338211065603
3D Visualization of the Dynamic Bidirectional Talk Between ER/PR and Her2 Pathways
Erratum in
-
Erratum to 3D Visualization of the Dynamic Bidirectional Talk Between ER/PR and Her2 Pathways. Technology in Cancer Research and Treatment 20:1-10. DOI: 10.1177/15330338211065603.Technol Cancer Res Treat. 2022 Jan-Dec;21:15330338221123115. doi: 10.1177/15330338221123115. Technol Cancer Res Treat. 2022. PMID: 36164679 Free PMC article. No abstract available.
Abstract
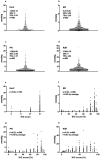
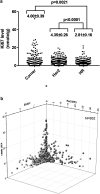
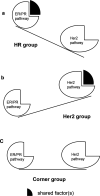
Background: Extensive amounts of archived formalin fixed paraffin embedded (FFPE) human tumor tissues are the ultimate resource to investigate signaling network underlying tumorigenesis in human. Yet, their usage is severely limited for lacking of suitable protein techniques. In this study, a quantitative, objective, absolute, and high throughput immunoblot method, quantitative dot blot (QDB), was explored to address this issue by investigating the putative relationship between estrogen receptor (ER)/progesterone receptor (PR) and human epidermal growth factor receptor 2 (Her2) pathways in breast cancer tumorigenesis. Methods: In this descriptive observational retrospective study, ER, PR, Her2, and Ki67 protein levels were measured absolutely and quantitatively in 852 FFPE breast cancer tissues using the QDB method. ER, PR, and Her2 levels were charted on the X, Y, and Z-axes to observe samples distribution in a 3D scatterplot. Results: A "seesaw" relationship between ER/PR and Her2 pathways was observed in ER-PR-Her2 space, characterized by the expression levels of these 3 proteins. Specimens with strong expressions of ER/PR proteins were found spreading along the ER/PR floor while those with strong Her2 expression were found wrapping around the Her2 axis. Those lacking strong expressions of all 3 proteins were found accumulating at the intersection of the ER, PR, and Her2 axes. Few specimens floated in the ER-PR-Her2 space to suggest the lack of co-expression of all 3 proteins simultaneously. Ki67 levels were found to be significantly reduced in specimens spreading in the ER-PR space. Conclusions: The unique distribution of specimens in ER-PR-Her2 space prior to any clinical intervention provided visual support of bidirectional talk between ER/PR and Her2 pathways in breast cancer specimens. Clinical interventions to suppress these 2 pathways alternatively warrant further exploration for breast cancer patients accordingly. Our study also demonstrated that the QDB method is an effective tool to analyze archived FFPE cancer specimens in biomedical research.
Keywords: FFPE; QDB; biomarker; high throughput; protein quantitation.
Conflict of interest statement
Figures


Similar articles
-
Estrogen receptor, progesterone receptor, and human epidermal growth factor receptor 2 expression in breast cancer FNA cell blocks and paired histologic specimens: A large retrospective study.Cancer Cytopathol. 2016 Nov;124(11):828-835. doi: 10.1002/cncy.21745. Epub 2016 Jun 17. Cancer Cytopathol. 2016. PMID: 27315045
-
Hormonal Receptor, Human Epidermal Growth Factor and Its Association with Breast Cancer Tumor Characteristics in Albania.Cent Eur J Public Health. 2016 Sep;24(3):171-175. doi: 10.21101/cejph.a4085. Cent Eur J Public Health. 2016. PMID: 27760283
-
Expression of DNA methylation marker of paired-like homeodomain transcription factor 2 and growth receptors in invasive ductal carcinoma of the breast.Asian Pac J Cancer Prev. 2014;15(19):8441-5. doi: 10.7314/apjcp.2014.15.19.8441. Asian Pac J Cancer Prev. 2014. PMID: 25339043
-
Breast Cancer Survival Analysis Based on Immunohistochemistry Subtypes (ER/PR/HER2): a Retrospective Cohort Study.Arch Iran Med. 2016 Oct;19(10):680-686. Arch Iran Med. 2016. PMID: 27743431
-
Prognostic values of negative estrogen or progesterone receptor expression in patients with luminal B HER2-negative breast cancer.World J Surg Oncol. 2016 Sep 13;14(1):244. doi: 10.1186/s12957-016-0999-x. World J Surg Oncol. 2016. PMID: 27619909 Free PMC article.
Cited by
-
Decoding the concealed transcriptional signature of the apoptosis-related BCL2 antagonist/killer 1 (BAK1) gene in human malignancies.Apoptosis. 2022 Dec;27(11-12):869-882. doi: 10.1007/s10495-022-01753-w. Epub 2022 Jul 25. Apoptosis. 2022. PMID: 35876934
-
Validation of absolutely quantitated Ki67 and cyclinD1 protein levels for prognosis of Luminal-like breast cancer patients.J Clin Lab Anal. 2022 Aug;36(8):e24601. doi: 10.1002/jcla.24601. Epub 2022 Jul 12. J Clin Lab Anal. 2022. PMID: 35819123 Free PMC article.
References
Publication types
MeSH terms
Substances
LinkOut - more resources
Full Text Sources
Research Materials
Miscellaneous

