. 2022 Jan 1;122(1):21-53.
doi: 10.1097/HP.0000000000001496.

A Method for Estimating the Deposition Density of Fallout on the Ground and on Vegetation from a Low-yield, Low-altitude Nuclear Detonation

Affiliations

A Method for Estimating the Deposition Density of Fallout on the Ground and on Vegetation from a Low-yield, Low-altitude Nuclear Detonation

Harold L Beck et al. Health Phys. .

Abstract

This paper describes a relatively simple model developed from observations of local fallout from US and USSR nuclear tests that allows reasonable estimates to be made of the deposition density (activity per unit area) on both the ground and on vegetation for each radionuclide of interest produced in a nuclear fission detonation as a function of location and time after the explosion. In addition to accounting for decay rate and in-growth of radionuclides, the model accounts for the fractionation (modification of the relative activity of various fission and activation products in fallout relative to that produced in the explosion) that results from differences in the condensation temperatures of the various fission and activation products produced in the explosion. The proposed methodology can be used to estimate the deposition density of all fallout radionuclides produced in a low yield, low altitude fission detonation that contribute significantly to dose. The method requires only data from post-detonation measurements of exposure rate (or beta or a specific nuclide activity) and fallout time-of-arrival. These deposition-density estimates allow retrospective as well as rapid prospective estimates to be made of both external and internal radiation exposure to downwind populations living within a few hundred kilometers of ground zero, as described in the companion papers in this volume.


Conflict of interest statement

The authors declare no conflicts of interest.

Figures

Fig. 1
Fig. 1
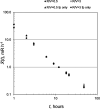
Measured vs. calculated N0 vs. tr = TOA/tmax for NTS tests [d = 1.8, (1-a) = 0.9].
Fig. 2
Fig. 2
Condensation temperatures of various elements relative to melting temperature of soil as a function of time after detonation for a ~10 kt event (Based on Miller 1963). The time scale varies with fission yield, so for a yield of 20 kt, the time at which soil solidifies would be ~6 s and ~ 9 s for an 84 kt event (Appendix A).
Fig. 3
Fig. 3
Example of dependence of (t) on R/V, normalized to R/V = 0.5.
Fig. B1
Fig. B1
Variation of (1-a) with extent of fireball (FB) interaction with ground. X = FB radius-HOB.
Fig. 4
Fig. 4
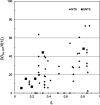
Ratio of DDCs-137/(12) (Bq m−2/mR h−1) vs. R/V for a 239Pu-fueled device (Tesla), a 235U-fueled device (Smoky), and two tests (Trinity and Diablo) where the fission was due to a combination of 235U, 238U, and 239Pu (Appendix B, Table B1).
Fig. A1
Fig. A1
Fission yields (%) for 235U, 238U, and 239Pu (from England and Ryder, 1994).
Fig. A2
Fig. A2
Illustration of variation in activity median diameter (AMD) with tr. Data from Baurmash et al. (1958) for NTS test Apple.
Fig. A3
Fig. A3
Fallout particle size distribution (AMD) vs percentage of activity on particles less than 50 μm. Data from Baurmash et al. (1958) for NTS test Apple.
Fig. A4
Fig. A4
Calculated relative volatility for an 84 kt fission detonation. Data from Miller 1963.
Fig. A5
Fig. A5
Estimated variation of 137Cs/90Sr activity vs. average R/V (normalized to 1.0 at R/V = 1.0).
Fig. B2
Fig. B2
Variation of d with estimated fallout pattern width.
Fig. B3
Fig. B3
Best fit to N0 for NTS test Smoky. Calculated/Measured: mean = 1.02, GM = 1.02, standard deviation = 0.12. d = 1.7, (1-a) = 0.85. Solid line indicates calculated = measured.
Fig. B4
Fig. B4
Fit to N0 for NTS test Boltzmann. Calculated/measured: mean = 1.04, GM = 1.05, standard deviation = 0.15. d = 1.8, 1-a = 0.85. Solid line indicates calculated = measured.
Fig. B5
Fig. B5
Fit to N0 for NTS test Tesla. Calculated/measured: mean = 1.31, GM = 1.44, standard deviation = 0.65. d = 1.4, 1-a = 0.91. Solid line indicates calculated = measured.
Fig. B6
Fig. B6
Fit to N0 data for SNTS test N242. Calculated/measured: mean = 0.94, GM = 0.9, GSD = 1.4. d = 1.6, 1-a = 0.96. Dotted line is best fit to data.
Fig. B7
Fig. B7
Fit to N0 data for SNTS test N148. Fit/measured: mean = 0.98, GM = 0.93, GSD = 1.3. d = 1.6, (1-a) = 0.99. Dotted line is best fit to data.
Fig. B8
Fig. B8
Illustration of fitting N0 measurements using TOA as opposed to distance.
Fig. B9
Fig. B9
Example of increase in N50 with distance from trace axis for NTS test Tesla, tr ~ 0.1. (Data from Baurmash et al. 1958). Negative and positive distances represent different directions from axis.
Fig. B10
Fig. B10
Example of change in median particle size with distance from axis reflecting the decrease in particle size leading to an increase in N50, which implies a decrease in R/V. Data for NTS test Apple at tr ~ 0.2 (Data from Baurmash et al. 1958).
Fig. B11
Fig. B11
Comparison of model estimates of N50 and measured N50 vs. /max for NTS test Tesla for tr= 0.1.
Fig. B12
Fig. B12
Comparison of model estimates of N50 and measured N50 vs /max for NTS test Tesla for tr= 0.33.
Fig. C1
Fig. C1
(t) vs. t for R/V = 0.5 vs R/V = 3 with and without activation products.
Fig. C2
Fig. C2
CT height (above ground level) in km for NTS tests (Data from Hawthorne 1979).
Fig. C3
Fig. C3
Illustration of uncertainty in N0 (circles) and N50 (triangles) at /max = 0.5 due to 10% error in CT or tmax.
Fig. C4
Fig. C4
DDCs-137/(12), Bq m−2/mR h−1 measured downwind from NTS and SNTS vs. corresponding estimated tr at sampling site.
Fig. C6
Fig. C6
Dependence of N0 on (1-a) as d is held fixed (d = 1.6).
Fig. C7
Fig. C7
Dependence of N0 on d as (1-a) is held fixed (1-a = 0.9).
Fig. C5
Fig. C5
Estimated relationship between R/V and N50 (data points) and proposed binned estimates (solid grey lines).

Similar articles

Cited by

References

    1. Anspaugh LR, Bouville A, Thiessen KM, Hoffman FO, Beck HL, Gordeev K, Simon SL. A methodology for calculation of internal dose following exposure to radioactive fallout from the detonation of a nuclear fission device. Health Phys 122(1):84–124; 2022. - PMC - PubMed
    1. Baurmash L, Neel JW, Vance WK, III, Mork HM, Larson KH. Distribution and characterization of fallout and airborne activity from 10 to 160 miles from ground zero, spring 1955. Los Angeles, CA: University of California; WT-1178; 1958.
    1. Beck HL. Exposure rate conversion factors for radionuclides deposited on the ground. New York: US Department of Energy Environmental Measurements Laboratory; EML-378; 1980.
    1. Beck HL, Krey PW. Radiation exposure in Utah from Nevada nuclear tests. Science 220:18–24; 1983. - PubMed
    1. Beck HL, Anspaugh LR. Development of the County Data Base: estimates of exposure rates and times of arrival of fallout in the ORERP Phase II Area: comparison with cumulative deposition-density estimates based on analyses of retrospective and historical soil samples. Las Vegas, NV: US Department of Energy; DOE/NV-320; 1991.

Publication types

Substances