. 2021 Oct 27;28(6):4298-4316.
doi: 10.3390/curroncol28060366.

Assessment of Digital Pathology Imaging Biomarkers Associated with Breast Cancer Histologic Grade

Affiliations

Assessment of Digital Pathology Imaging Biomarkers Associated with Breast Cancer Histologic Grade

Andrew Lagree et al. Curr Oncol. .

Abstract

Background: Evaluating histologic grade for breast cancer diagnosis is standard and associated with prognostic outcomes. Current challenges include the time required for manual microscopic evaluation and interobserver variability. This study proposes a computer-aided diagnostic (CAD) pipeline for grading tumors using artificial intelligence.

Methods: There were 138 patients included in this retrospective study. Breast core biopsy slides were prepared using standard laboratory techniques, digitized, and pre-processed for analysis. Deep convolutional neural networks (CNNs) were developed to identify the regions of interest containing malignant cells and to segment tumor nuclei. Imaging-based features associated with spatial parameters were extracted from the segmented regions of interest (ROIs). Clinical datasets and pathologic biomarkers (estrogen receptor, progesterone receptor, and human epidermal growth factor 2) were collected from all study subjects. Pathologic, clinical, and imaging-based features were input into machine learning (ML) models to classify histologic grade, and model performances were tested against ground-truth labels at the patient-level. Classification performances were evaluated using receiver-operating characteristic (ROC) analysis.

Results: Multiparametric feature sets, containing both clinical and imaging-based features, demonstrated high classification performance. Using imaging-derived markers alone, the classification performance demonstrated an area under the curve (AUC) of 0.745, while modeling these features with other pathologic biomarkers yielded an AUC of 0.836.

Conclusion: These results demonstrate an association between tumor nuclear spatial features and tumor grade. If further validated, these systems may be implemented into pathology CADs and can assist pathologists to expeditiously grade tumors at the time of diagnosis and to help guide clinical decisions.

Keywords: Nottingham grade; biopsy; breast cancer; computational oncology; imaging biomarkers; tumor.


Conflict of interest statement

K.J.J is a speaker/advisor board/consultant for Amgen, Apo Biologix, Eli Lilly, Esai, Genomic Health, Knight Therapeutics, Pfizer, Roche, Seagen, Merck, Novartis, Purdue Pharma and Viatris. K.J.J received research funding: Eli Lilly, Astra Zeneca. All other authors declare no conflict of interest.

Figures
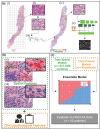
Figure 1
Figure 1
Nottingham grade classification pipeline. (a) (i) A representative H&E stained CNB section is first tiled, followed by stain normalization (ii), then used as input to a CNN (modified VGG19), which predicts the tumor bed probabilities (iii). A heatmap is generated using the tumor bed probabilities (iv). Tiles from the tumor bed are then used as input for the Mask R-CNN, which segments the malignant nuclei (v). (b) Spatial and clinical features are extracted. Spatial features were extracted using the centroids of the segmented nuclei. The spatial features included density features (vi), graph features (vii), and nuclei count. Clinicopathological features, including patient age (years) and receptor status (ER, PR, HER2). (c) Separate machine learning models were trained for spatial and clinical features. The clinical and spatial models were then combined to create an ensemble model. The ensemble model was evaluated on the hold-out (test) set.
Figure 2
Figure 2
Instance segmentation of malignant nuclei by Mask regional convolutional neural network (Mask R-CNN) and representative feature extraction. (a,b) Mask R-CNN performance, evaluated on the hold-out (test) set. The highest, median, and lowest scoring AJI images from the Post-NAT-BRCA dataset are displayed. The predicted cells are color-coded such that green denotes true-positive, blue false-positive, and red false-negative pixels. Average precision over ten intersections over union thresholds is also displayed. (c) Representative H&E images from five patients and their respective malignant nuclei masks are displayed. (d) The Delaunay triangulation features, Voronoi diagram features, and density features were calculated using the centroids of the segmented malignant nuclei. Abbreviations: H&E, hematoxylin and eosin; AJI, Aggregated Jaccard Index.
Figure 3
Figure 3
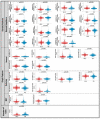
Combined box and whisker and swarm plots of the statistically significant (p < 0.05) spatial features. Abbreviations: stddev, standard deviation; Min, minimum; Max, maximum; MST, Minimum Spanning Tree; a.u., Arbitrary units; G1, 2, Nottingham grade 1 and 2; G3, Nottingham grade 3.
Figure 4
Figure 4
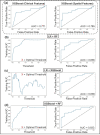
Receiver operating characteristics (ROC) curve and area under the curve (AUC) of the top performing machine learning models trained with clinical and spatial feature sets. (a left) ROC and AUC of XGBoost, the top performing classifier using clinical features. (a right) ROC and AUC of XGBoost, the top performing classifier using spatial features. (bd) The top three performing ensemble models. (b) AUC vs. Threshold of LR+RF, with an optimal threshold of 37% (left). ROC and AUC of LR+RF (right). (c) AUC vs. Threshold of LR+XGBoost, with an optimal threshold of 10% (left). ROC and AUC of LR+XGBoost (right). (d) AUC vs. Threshold of XGBoost+RF, with an optimal threshold of 46% (left). ROC and AUC of XGBoost+RF (right). Abbreviations: ROC, Receiver Operating Characteristic curve; AUC, Area Under the Curve; LR, Logistic regression; RF, random forest classifier; XGBoost, Extreme Gradient Boost.

References

    1. Fitzgibbons P.L., Connolly J.L. Cancer Protocol Templates. [(accessed on 11 August 2021)]. Available online: https://www.cap.org/protocols-and-guidelines/cancer-reporting-tools/canc....
    1. Van Dooijeweert C., van Diest P.J., Ellis I.O. Grading of invasive breast carcinoma: The way forward. Virchows Arch. 2021 doi: 10.1007/s00428-021-03141-2. - DOI - PMC - PubMed
    1. Rakha E.A., El-Sayed M.E., Lee A.H.S., Elston C.W., Grainge M.J., Hodi Z., Blamey R.W., Ellis I.O. Prognostic significance of nottingham histologic grade in invasive breast carcinoma. J. Clin. Oncol. 2008;26:3153–3158. doi: 10.1200/JCO.2007.15.5986. - DOI - PubMed
    1. Cortazar P., Zhang L., Untch M., Mehta K., Costantino J.P., Wolmark N., Bonnefoi H., Cameron D., Gianni L., Valagussa P., et al. Pathological complete response and long-term clinical benefit in breast cancer: The CTNeoBC pooled analysis. Lancet. 2014;384:164–172. doi: 10.1016/S0140-6736(13)62422-8. - DOI - PubMed
    1. Kalli S., Semine A., Cohen S., Naber S.P., Makim S.S., Bahl M. American Joint Committee on Cancer’s Staging System for Breast Cancer, Eighth Edition: What the Radiologist Needs to Know. RadioGraphics. 2018;38:1921–1933. doi: 10.1148/rg.2018180056. - DOI - PubMed

Publication types