. 2021 Dec 13;17(12):e1009670.
doi: 10.1371/journal.pcbi.1009670. eCollection 2021 Dec.

CoRE-ATAC: A deep learning model for the functional classification of regulatory elements from single cell and bulk ATAC-seq data

Affiliations

CoRE-ATAC: A deep learning model for the functional classification of regulatory elements from single cell and bulk ATAC-seq data

Asa Thibodeau et al. PLoS Comput Biol. .

Abstract

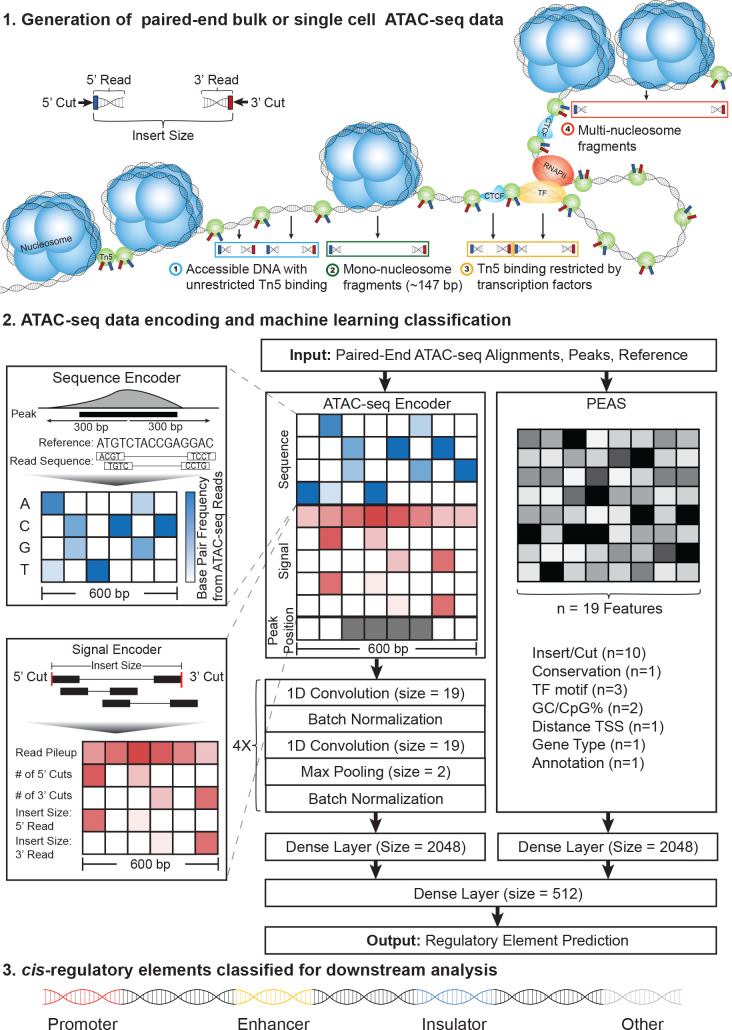
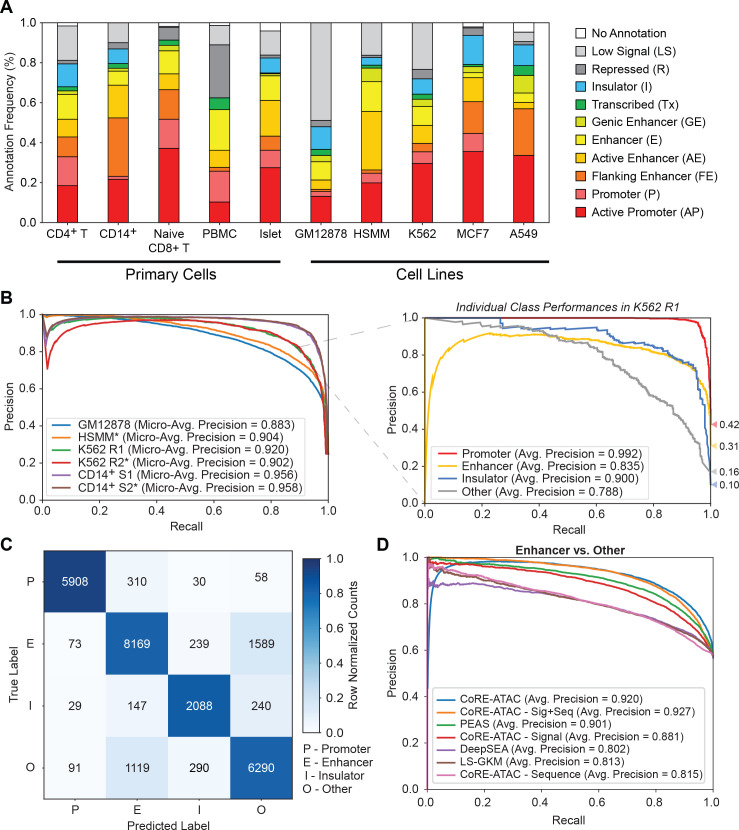
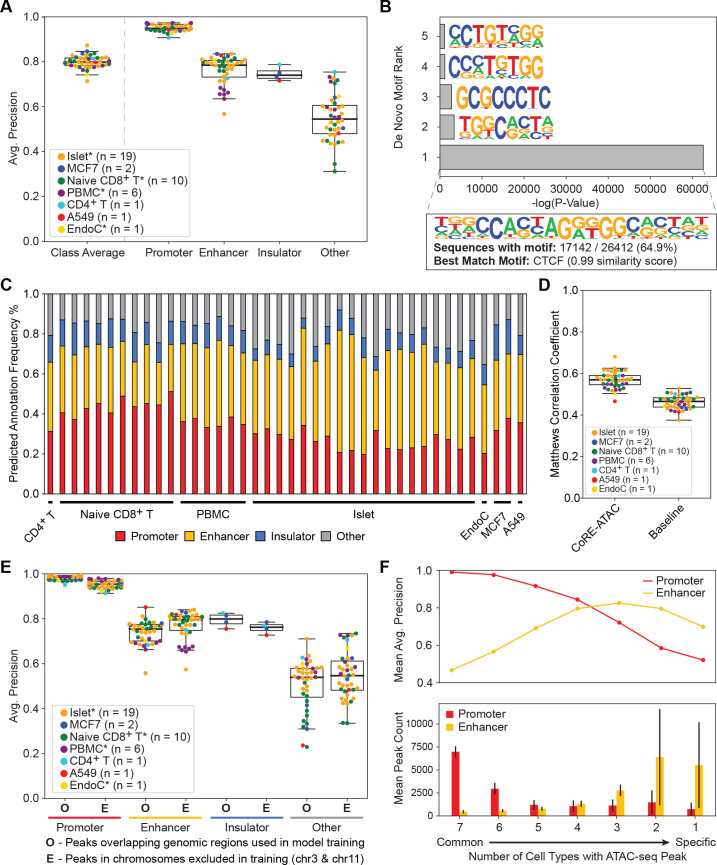
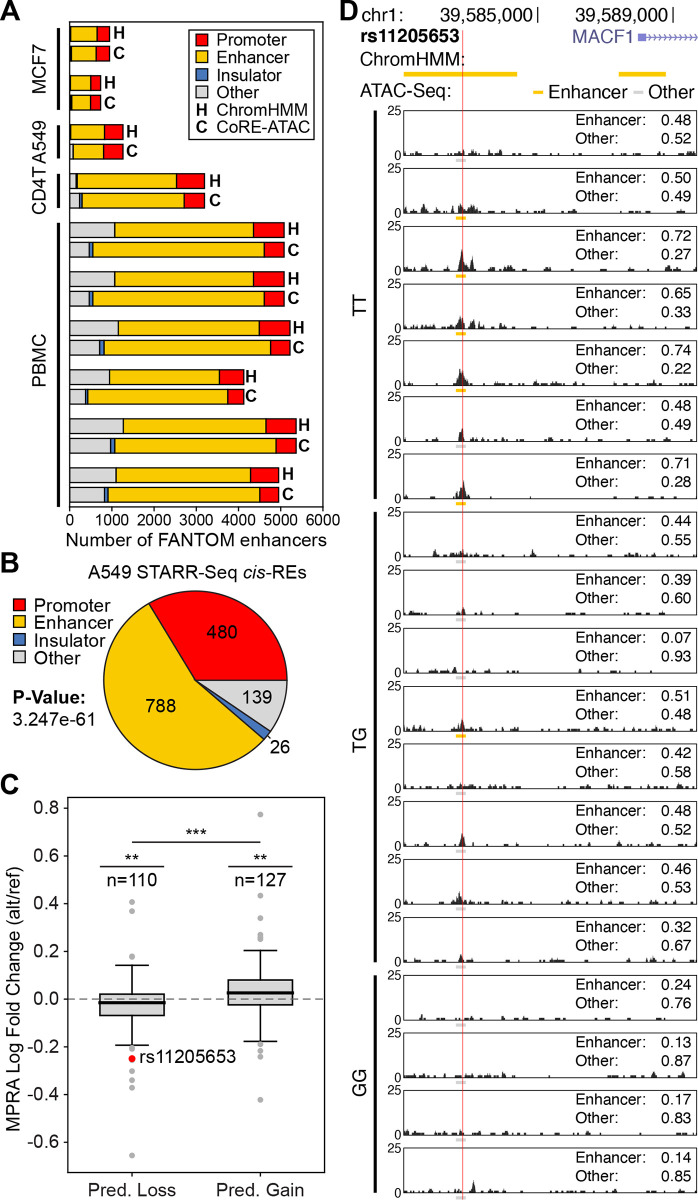
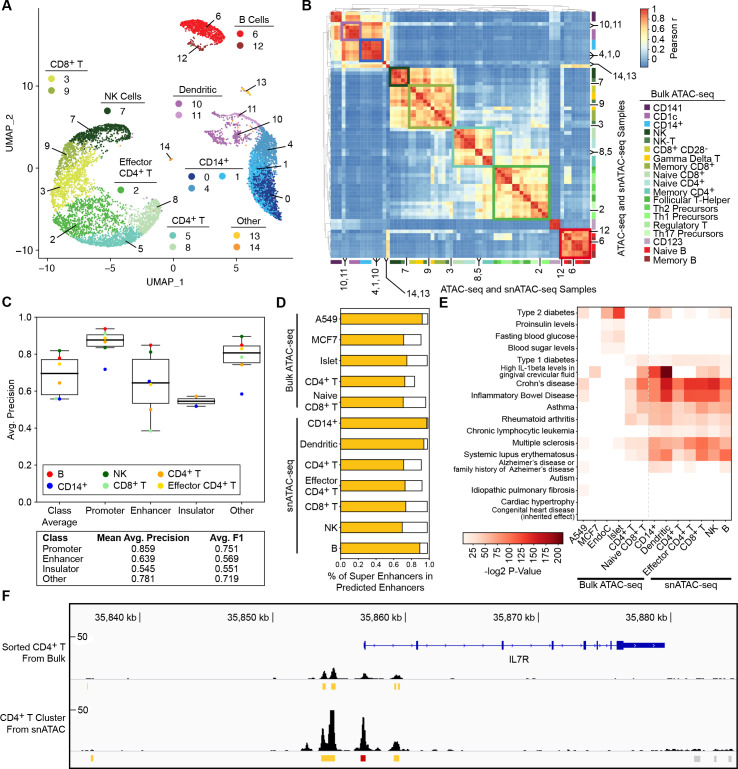
Cis-Regulatory elements (cis-REs) include promoters, enhancers, and insulators that regulate gene expression programs via binding of transcription factors. ATAC-seq technology effectively identifies active cis-REs in a given cell type (including from single cells) by mapping accessible chromatin at base-pair resolution. However, these maps are not immediately useful for inferring specific functions of cis-REs. For this purpose, we developed a deep learning framework (CoRE-ATAC) with novel data encoders that integrate DNA sequence (reference or personal genotypes) with ATAC-seq cut sites and read pileups. CoRE-ATAC was trained on 4 cell types (n = 6 samples/replicates) and accurately predicted known cis-RE functions from 7 cell types (n = 40 samples) that were not used in model training (mean average precision = 0.80, mean F1 score = 0.70). CoRE-ATAC enhancer predictions from 19 human islet samples coincided with genetically modulated gain/loss of enhancer activity, which was confirmed by massively parallel reporter assays (MPRAs). Finally, CoRE-ATAC effectively inferred cis-RE function from aggregate single nucleus ATAC-seq (snATAC) data from human blood-derived immune cells that overlapped with known functional annotations in sorted immune cells, which established the efficacy of these models to study cis-RE functions of rare cells without the need for cell sorting. ATAC-seq maps from primary human cells reveal individual- and cell-specific variation in cis-RE activity. CoRE-ATAC increases the functional resolution of these maps, a critical step for studying regulatory disruptions behind diseases.


Conflict of interest statement

The authors have declared that no competing interests exist.

Figures

Fig 1
Fig 1. Overview of the CoRE-ATAC framework.
Paired-end ATAC-seq data captures different cut and insert size distributions corresponding to the presence or absence of nucleosomes or TFs. ATAC-seq data is encoded into a 10x600 matrix and 19 data features from PEAS algorithm to predict the functionality of an open chromatin region, using both novel and manually selected features. In the final step, CoRE-ATAC classifies cis-REs into 4 functional classes: promoter, enhancer, insulator, and other.
Fig 2
Fig 2. CoRE-ATAC outperforms sequence-based enhancer prediction methods.
CoRE-ATAC predictions were evaluated using held out test data (chromosomes 3 and 11). (A) ChromHMM state distributions for different cell types used in this study. ATAC-seq open chromatin maps correspond to a multitude of cis-RE functional states, corresponding to Active Promoter (AP), Promoter (P), Flanking Enhancer, (FE), Active Enhancer (AE), Enhancer (E), Genic Enhancer (GE), Transcribed (Tx), Insulator (I), Repressed (R) and Low Signal (LS). (B) Micro-average precision values (left) were calculated, summarizing the average precision values for individual class predictions for all cell types used in model training. A breakdown of individual class average precision scores is shown for K562 (right). (C) Combined confusion matrix of model predictions across all cell types used in model training. Note that models are predictive for all class labels: promoters (P), enhancers (E), insulators (I), and other (O). However, mispredictions were more frequently observed between enhancer and other functional classes. (D) Receiver operating characteristic (ROC) curves for different enhancer prediction models: CoRE-ATAC, PEAS, DeepSEA and LS-GKM and CoRE-ATAC’s sequence, signal, and signal+sequence (No PEAS features) models. Models were evaluated for predicting enhancer versus “other” classes for chr3 and chr11 of the GM12878, HSMM, K562, and CD14+ datasets. Note that CoRE-ATAC outperforms alternative methods.
Fig 3
Fig 3. CoRE-ATAC can predict REs across cell-types.
CoRE-ATAC was evaluated in 7 cell types using 40 samples that are not used in model training. (A) Average precision scores for predicting cis-REs. Micro-average precision was used to calculate class average scores. CoRE-ATAC is predictive across cell types and different functional classes with an exception of insulators in islets, which is due to CTCF ChIP-seq quality in islets. (B) De novo motif enrichment results for regions predicted as insulators by CoRE-ATAC but were not annotated as insulators by ChromHMM. Note that these regions are significantly enriched for the CTCF motif (0.983 similarity), suggesting that CoRE-ATAC insulator predictions are functionally relevant.(C) Distribution of CoRE-ATAC predictions. Prediction distributions are similar to those observed by ChromHMM state annotations. (D) Comparison of CoRE-ATAC to baseline/naive predictions based on thresholds for distance to TSS, MACS2 FDR, and number of CTCF motifs. CoRE-ATAC improves upon baseline performances. (E) CoRE-ATAC performances for i) predictions overlapping regions used in model training (O), and ii) predictions within regions that are on held-out test chromosomes (E). Note the performance similarity between these two prediction categories across all classes. (F) CoRE-ATAC model performances (top) and the average number of promoters and enhancers observed (bottom) by cell-type-specificity. We observed that CoRE-ATAC was more effective in predicting common promoters and cell-type-specific enhancers, for which we had more examples represented in the data. CoRE-ATAC’s ability to predict cell-type-specific enhancers demonstrates its usefulness for interrogating individual and cell-type-specific enhancers.
Fig 4
Fig 4. CoRE-ATAC predictions overlap with experimentally detected enhancers.
(A) Overlap of FANTOM enhancer annotationswith CoRE-ATAC (C) and ChromHMM (H) predictions in MCF7, A549, CD4+ T and PBMC samples. CoRE-ATAC predicted the majority of FANTOM enhancers as enhancers or promoters, recapitulating these experimentally identified enhancers. CoRE-ATAC annotations were similar toChromHMM annotations. (B) CoRE-ATAC predictions for active regulatory regions identified by STARR-seq in A549 cell line. The majority of active enhancers identified by STARR-seq were predicted as promoter or enhancer by CoRE-ATAC. (C) MIN6 MPRA log fold change values for genomic regions predicted as losing or gaining cis-RE function based on CoRE-ATAC probabilities for reference and alternative alleles. Significance for predicted loss and predicted gain categories was calculated using student’s t-test for MPRA log fold change values being less than or greater than 0 respectively. Significance comparing the predicted loss and predicted gain of MPRA fold change distributions was calculated using Mann-Whitney U test. We observed concordant direction of effect both for CoRE-ATAC predictions and MPRA activity levels when alternative and reference alleles are compared. (D) Genome browsers of 19 islet samples highlighting a loss of enhancer activity for rs11205653 (also highlighted in (C)) for the alternative allele (G). Values for enhancer and other represent the probability assigned to those classes of cis-REs by CoRE-ATAC. We observe that for 5 out of 7 individuals with the reference allele (TT) CoRE-ATAC predicted enhancer activity, reflecting ChromHMM reference annotations, while for the individuals with GT or GG alleles, we observed an enhancer activity loss for all but one individual based on CoRE-ATAC predictions.
Fig 5
Fig 5. Predicting functionality of REs from clusters of PBMC snATAC-seq data.
(A) Single cell clusters annotated for 7 immune cell types. Two-pass clustering identified a total of 15 cell clusters which we annotated using hierarchical clustering with sorted bulk ATAC-seq data (shown in (B)) to identify 7 different immune cells corresponding to these clusters. (B) Hierarchical clustering of snATACclusters with bulk ATAC-seq data. Numbers and highlighted regions within the heatmap correspond to cell clusters and annotations in (A). 7 immune cell types were observed with both snATAC and bulk ATAC-seq samples. (C) (Top) Average precision values for predicting cis-RE function in snATAC for 6 annotated clusters with available ChromHMM states. Model performances suggest that CoRE-ATAC is an effective tool for interrogating cis-RE activity from snATAC data. (Bottom) Mean average precision and average F1 score values for promoters, enhancers, insulators and other. (D) Percent of super enhancers detected among CoRE-ATAC enhancers, demonstratingCoRE-ATAC’s ability to identify cell-type-specific enhancers that are most relevant to disease. (E) GREGOR SNP enrichment analysis highlighting selected diseases whose SNPs were significantly enriched within the enhancer elements predicted by CoRE-ATAC. Enhancers from PBMCsnATAC-seq were significantly enriched for SNPs associated with immune diseases. (F) Genome browser view of IL7R for bulk ATAC and snATAC samples for CD4+T cells. ATAC-seq read profiles and CoRE-ATAC predictions between snATAC and bulk ATAC were found to be similar to one another, demonstrating CoRE-ATAC as a robust method for cis-RE predictions. Red represents promoter predictions, yellow represent enhancer predictions, and gray represent “other” predictions from CoRE-ATAC.

Similar articles

Cited by

References

    1. Hindorff LA, Sethupathy P, Junkins HA, Ramos EM, Mehta JP, Collins FS, et al.. Potential etiologic and functional implications of genome-wide association loci for human diseases and traits. Proceedings of the National Academy of Sciences. 2009. Jun 9;106(23):9362–7. doi: 10.1073/pnas.0903103106 - DOI - PMC - PubMed
    1. Hnisz D, Abraham BJ, Lee TI, Lau A, Saint-André V, Sigova AA, et al.. Super-Enhancers in the Control of Cell Identity and Disease. Cell. 2013. Nov;155(4):934–47. doi: 10.1016/j.cell.2013.09.053 - DOI - PMC - PubMed
    1. Parker SCJ, Stitzel ML, Taylor DL, Orozco JM, Erdos MR, Akiyama JA, et al.. Chromatin stretch enhancer states drive cell-specific gene regulation and harbor human disease risk variants. Proceedings of the National Academy of Sciences. 2013. Oct 29;110(44):17921–6. doi: 10.1073/pnas.1317023110 - DOI - PMC - PubMed
    1. Gaffney DJ, McVicker G, Pai AA, Fondufe-Mittendorf YN, Lewellen N, Michelini K, et al.. Controls of Nucleosome Positioning in the Human Genome. PLoS Genet. 2012. Nov 15;8(11):e1003036. doi: 10.1371/journal.pgen.1003036 - DOI - PMC - PubMed
    1. Kumasaka N, Knights AJ, Gaffney DJ. Fine-mapping cellular QTLs with RASQUAL and ATAC-seq. Nat Genet. 2016. Feb;48(2):206–13. doi: 10.1038/ng.3467 - DOI - PMC - PubMed

Publication types