

Optimal vaccine allocation for COVID-19 in the Netherlands: A data-driven prioritization
- PMID: 34898617
- PMCID: PMC8699630
- DOI: 10.1371/journal.pcbi.1009697
Optimal vaccine allocation for COVID-19 in the Netherlands: A data-driven prioritization
Abstract
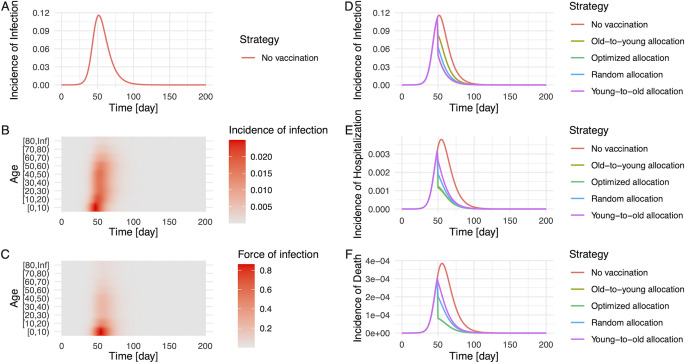
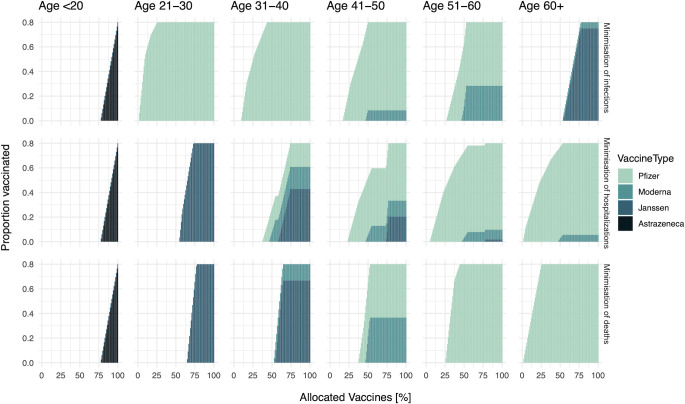
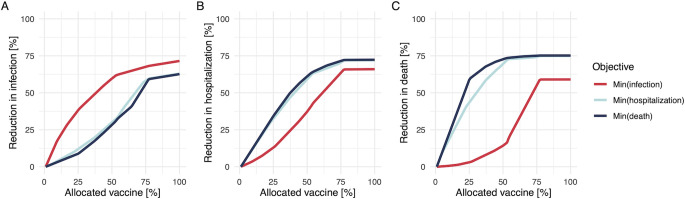
For the control of COVID-19, vaccination programmes provide a long-term solution. The amount of available vaccines is often limited, and thus it is crucial to determine the allocation strategy. While mathematical modelling approaches have been used to find an optimal distribution of vaccines, there is an excessively large number of possible allocation schemes to be simulated. Here, we propose an algorithm to find a near-optimal allocation scheme given an intervention objective such as minimization of new infections, hospitalizations, or deaths, where multiple vaccines are available. The proposed principle for allocating vaccines is to target subgroups with the largest reduction in the outcome of interest. We use an approximation method to reconstruct the age-specific transmission intensity (the next generation matrix), and express the expected impact of vaccinating each subgroup in terms of the observed incidence of infection and force of infection. The proposed approach is firstly evaluated with a simulated epidemic and then applied to the epidemiological data on COVID-19 in the Netherlands. Our results reveal how the optimal allocation depends on the objective of infection control. In the case of COVID-19, if we wish to minimize deaths, the optimal allocation strategy is not efficient for minimizing other outcomes, such as infections. In simulated epidemics, an allocation strategy optimized for an outcome outperforms other strategies such as the allocation from young to old, from old to young, and at random. Our simulations clarify that the current policy in the Netherlands (i.e., allocation from old to young) was concordant with the allocation scheme that minimizes deaths. The proposed method provides an optimal allocation scheme, given routine surveillance data that reflect ongoing transmissions. This approach to allocation is useful for providing plausible simulation scenarios for complex models, which give a more robust basis to determine intervention strategies.
Conflict of interest statement
The authors have declared that no competing interests exist.
Figures
References
-
- ECDC. COVID-19 situation update for the EU/EEA, as of week 26. In: European Centre for Disease Prevention and Control (ECDC) [Internet]. [cited 9 Jul 2021]. Available: https://www.ecdc.europa.eu/en/cases-2019-ncov-eueea
-
- WHO Coronavirus (COVID-19) Dashboard. [cited 9 Jul 2021]. Available: https://covid19.who.int/
-
- Kucharski AJ, Klepac P, Conlan AJK, Kissler SM, Tang ML, Fry H, et al.. Effectiveness of isolation, testing, contact tracing, and physical distancing on reducing transmission of SARS-CoV-2 in different settings: a mathematical modelling study. Lancet Infect Dis. 2020;20: 1151–1160. doi: 10.1016/S1473-3099(20)30457-6 - DOI - PMC - PubMed
-
- Sandmann FG, Davies NG, Vassall A, Edmunds WJ, Jit M, Centre for the Mathematical Modelling of Infectious Diseases COVID-19 working group. The potential health and economic value of SARS-CoV-2 vaccination alongside physical distancing in the UK: a transmission model-based future scenario analysis and economic evaluation. Lancet Infect Dis. 2021. doi: 10.1016/S1473-3099(21)00079-7 - DOI - PMC - PubMed
Publication types
MeSH terms
Substances
LinkOut - more resources
Full Text Sources
Medical
