. 2022 Feb;55(Suppl 1):172-213.
doi: 10.1111/caje.12540. Epub 2021 Sep 16.

The distribution of COVID-19-related risks

Affiliations

The distribution of COVID-19-related risks

Patrick Baylis et al. Can J Econ. 2022 Feb.

Abstract

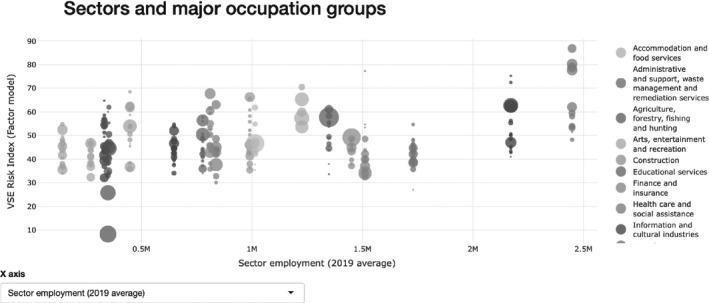
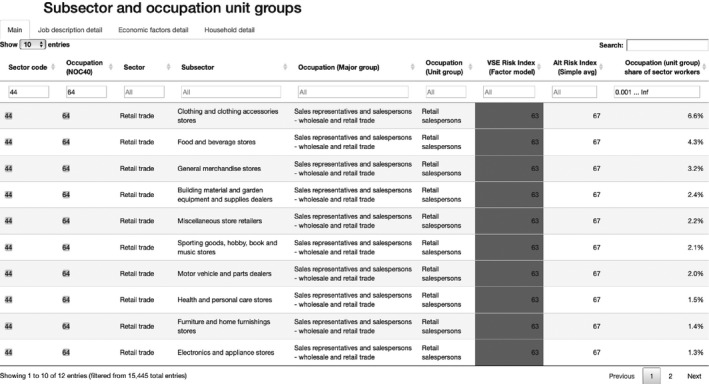
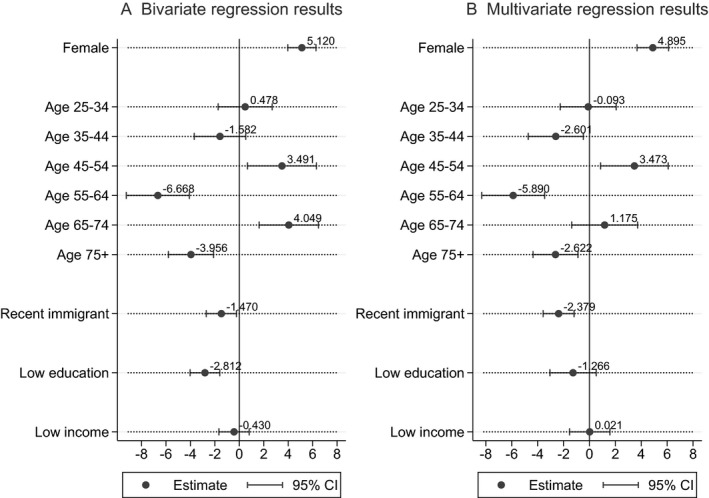
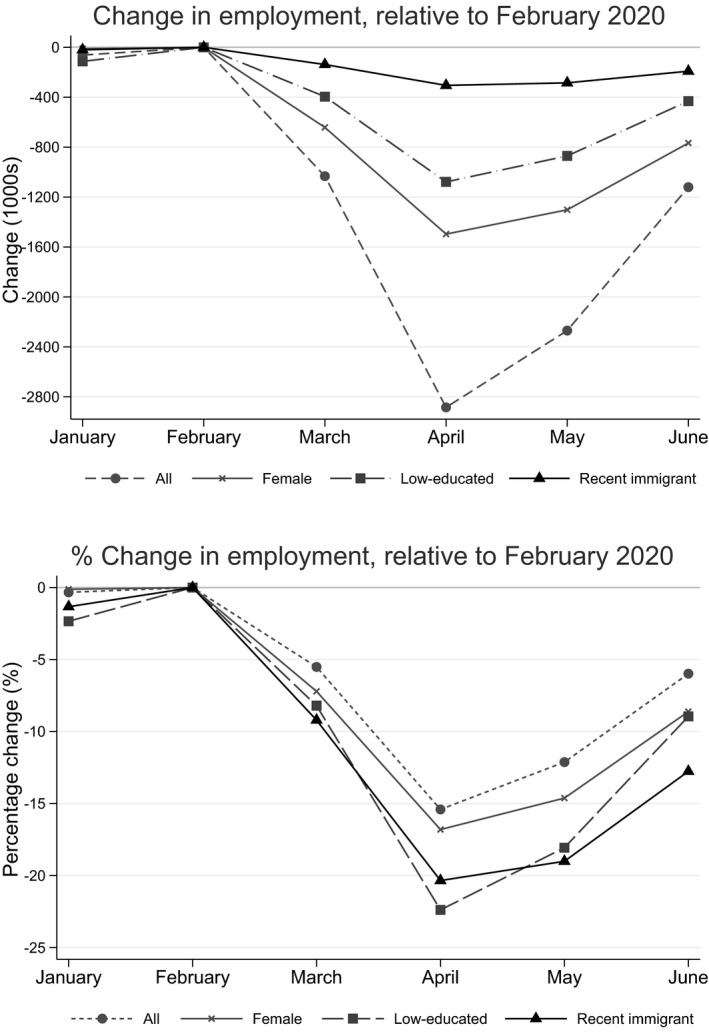
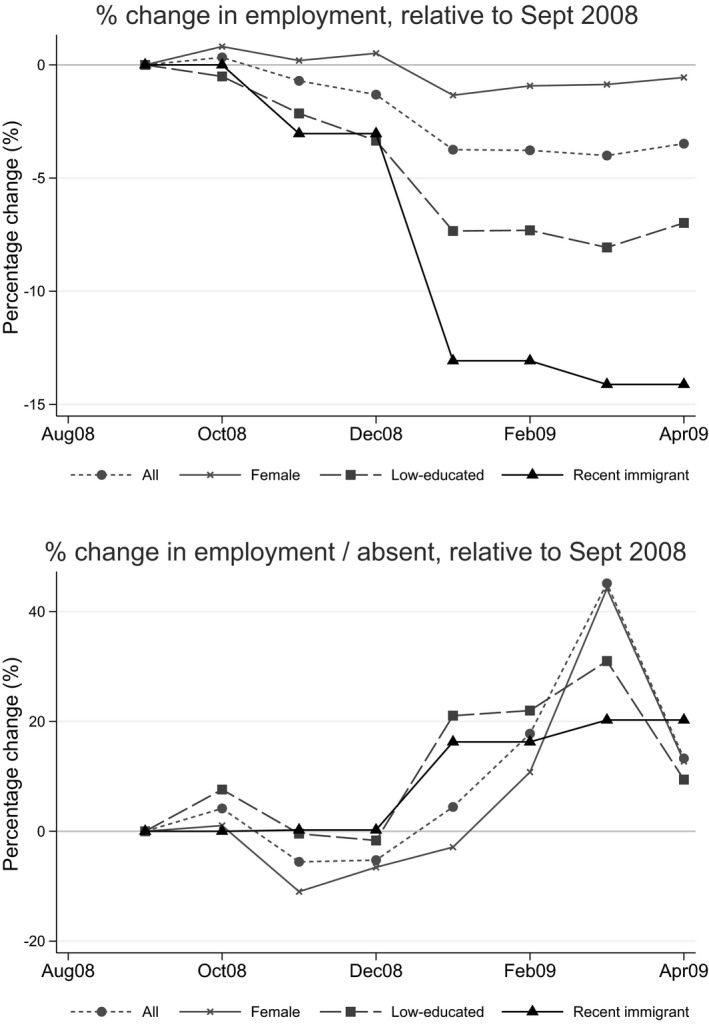
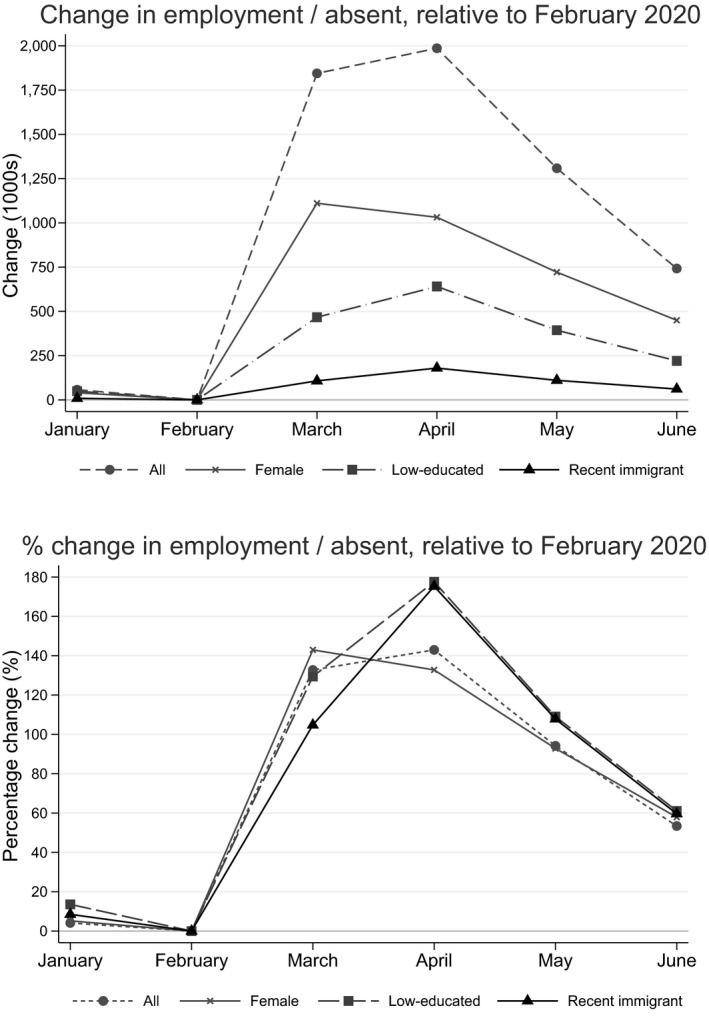
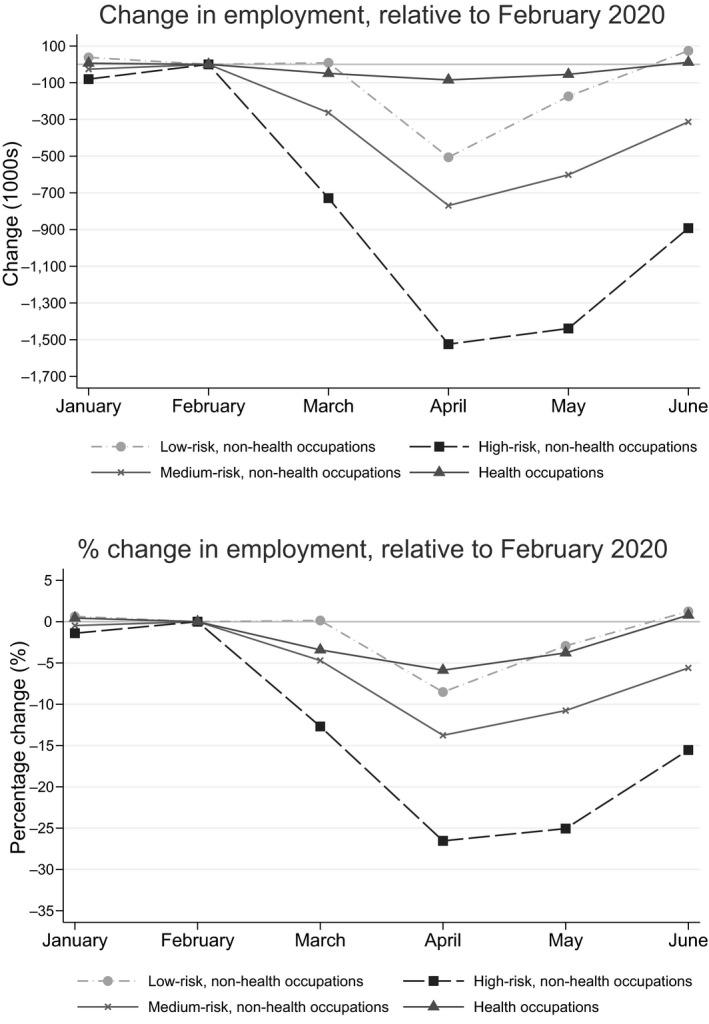
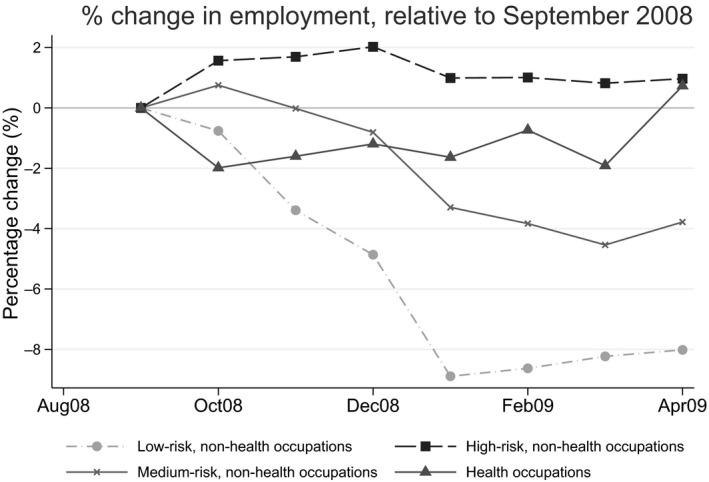
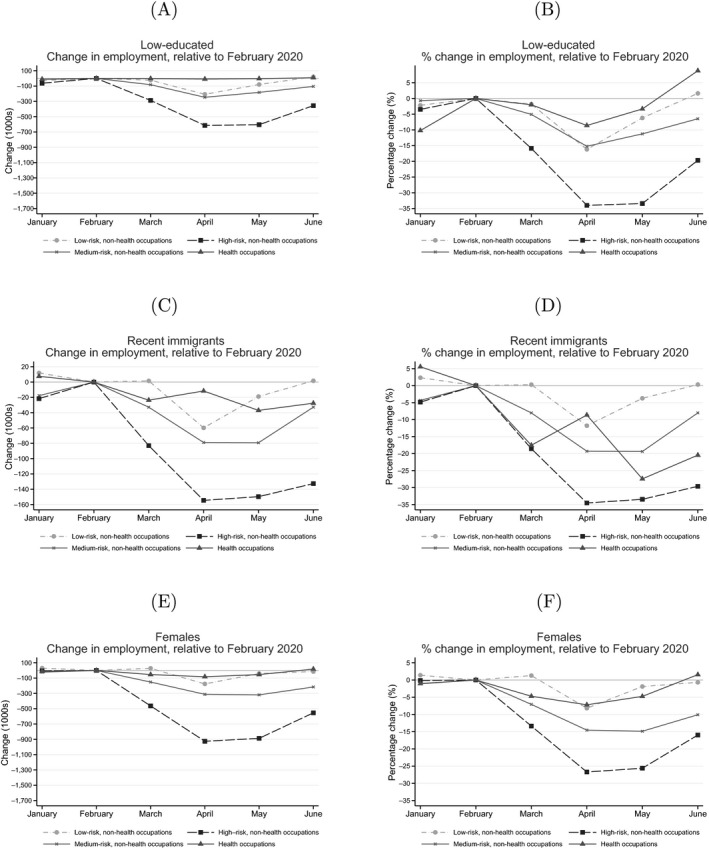
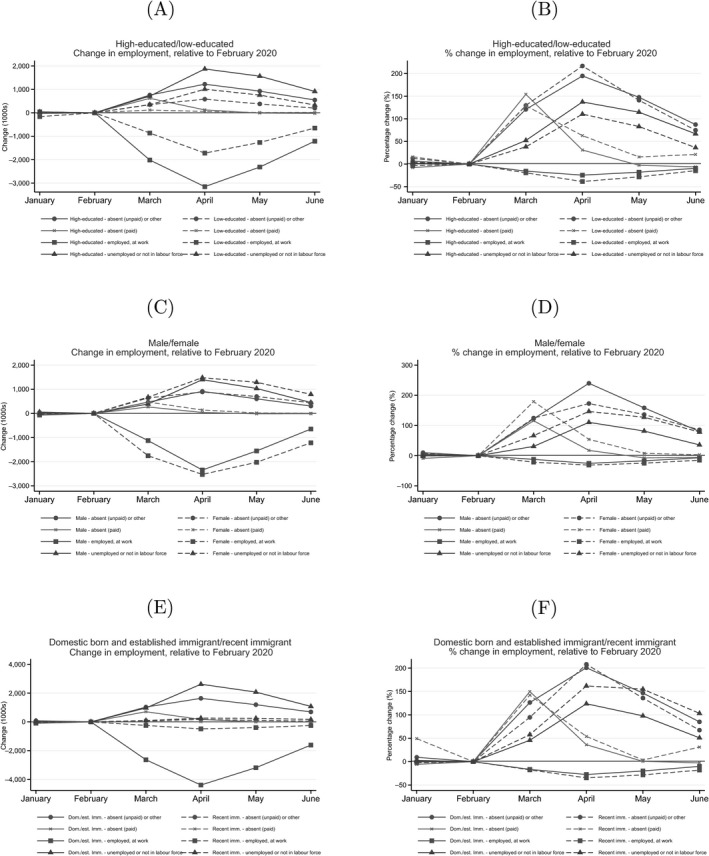
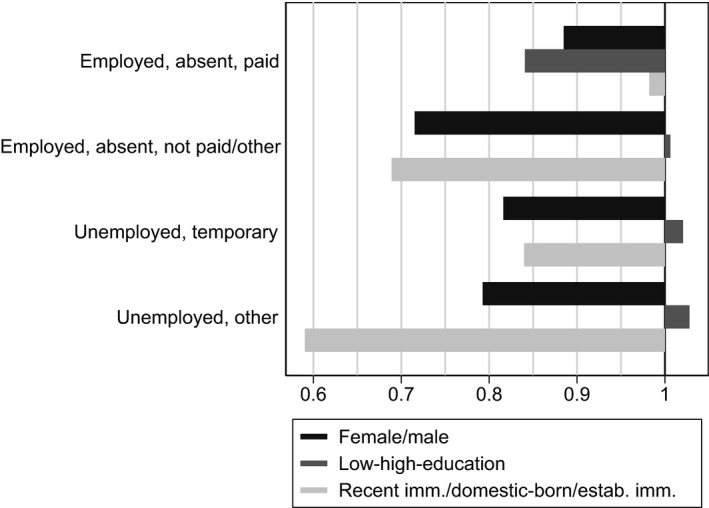
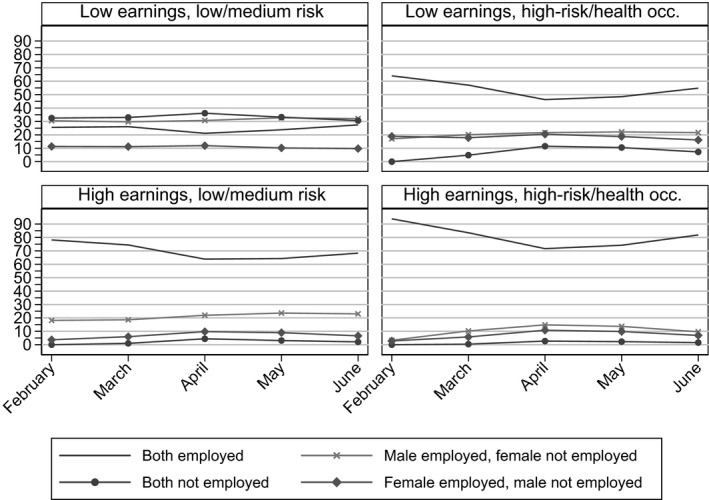
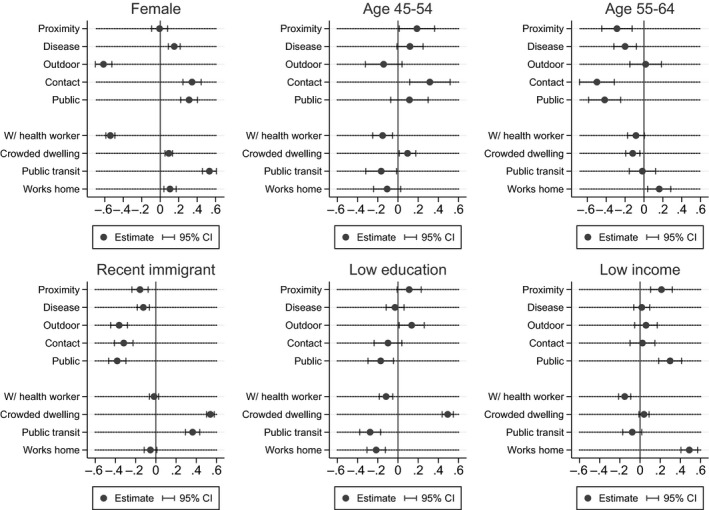
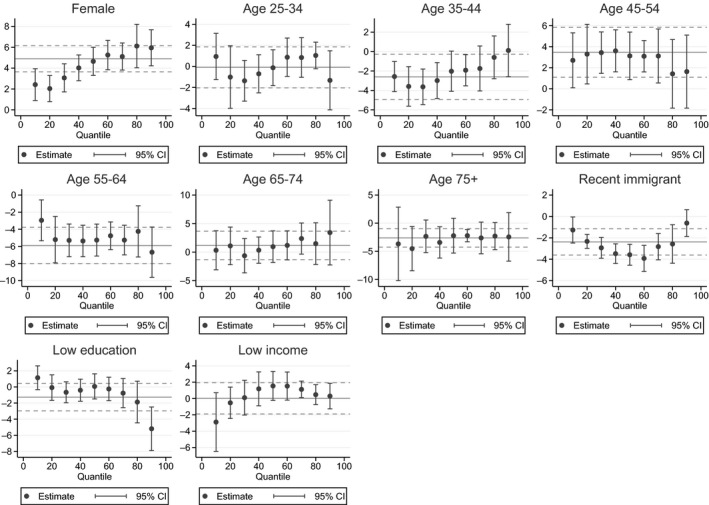
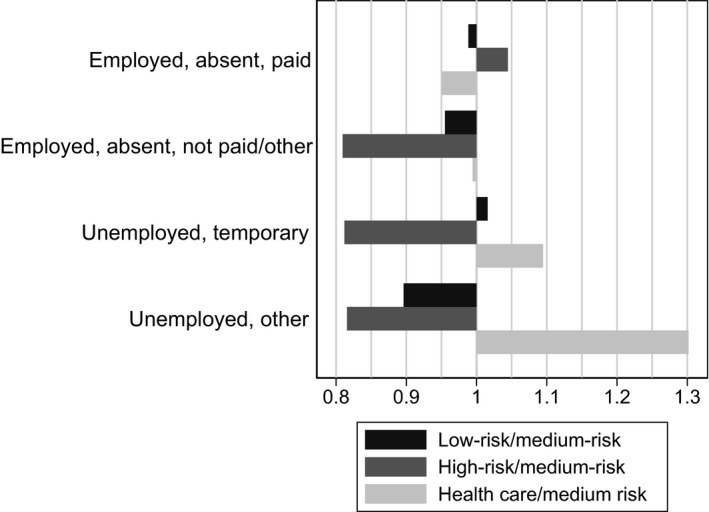
We document two COVID-19-related risks, viral risk and employment risk, and their distributions across the Canadian population. The measurement of viral risk is based on the VSE COVID-19 Risk/Reward Assessment Tool, created to assist policy-makers in determining the impacts of pandemic-related economic shutdowns and re-openings. Women are more concentrated in high-viral-transmission-risk occupations, which is the source of their greater employment loss over the first part of the pandemic. They were also less likely to maintain contact with their former employers, reducing employment recovery rates. Low-educated workers face the same viral risk rates as high-educated workers but much higher employment losses. This is largely due to their lower likelihood of switching to working from home. For both women and the low-educated, existing inequities in their occupational distributions and living situations have resulted in them bearing a disproportionate amount of the risk emerging from the pandemic. Assortative matching in couples has tended to exacerbate risk inequities.

Dans cet article, nous documentons deux risques associés à la COVID‐19, soit le risque de contracter le virus étant donné l'emploi occupé et le risque de perdre son emploi dans le contexte de la pandémie. La répartition de ces risques dans la population canadienne est aussi documentée. La mesure du risque viral est basée sur l'outil de visualisation des risques par profession et industrie liés à la COVID‐19 de la VSE, créée pour aider les décideurs à déterminer les impacts des fermetures et réouvertures des différents secteurs de l’économie durant la pandémie. On note que les femmes sont plus présentes dans les professions à haut risque viral, ce qui explique en partie leur plus grande perte d'emploi durant la première partie de la pandémie. Durant la pandémie, elles étaient également moins susceptibles de demeurer en contact avec leurs anciens employeurs, ce qui a affecté négativement leur taux de retour au travail. Le risque viral était similaire pour les travailleurs peu éduqués et les travailleurs hautement qualifiés, mais les pertes d'emplois ont été beaucoup plus importantes pour les travailleurs peu éduqués. Cette différence peut être attribuable à leur plus faible capacité à effectuer leur travail à domicile étant donné la nature de leur emploi. Tant pour les femmes que pour les personnes peu éduquées, les inégalités existantes dans leurs conditions de vie et leur répartition professionnelle les ont conduites à subir une part plus élevée du risque lié à la pandémie. Enfin, l'appariement assortatif des couples selon les professions a eu tendance à exacerber les inégalités face aux risques.


Figures

FIGURE 1
FIGURE 1
VSE COVID‐19 Risk Tool: Exhibit 1 NOTE: The online application can be accessed at https://COVID19.economics.ubc.ca/projects/project‐1/.
FIGURE 2
FIGURE 2
VSE COVID‐19 Risk Tool: Exhibit 2 NOTE: The online application can be accessed at https://COVID19.economics.ubc.ca/projects/project‐1/.
FIGURE 3
FIGURE 3
Regression of risk on occupation‐level characteristics: All occupations NOTES: Point estimates and 95% confidence intervals of VSE Risk Index regressed on demographic characteristics of four‐digit NOC occupations. Panel A presents bivariate regression results. Panel B presents multivariate results. See text for details.
FIGURE 4
FIGURE 4
Regression of risk factors on occupation‐level characteristics: All occupations NOTES: Point estimates and 95% confidence intervals of risk components regressed on demographic characteristics of four‐digit NOC occupations. Results come from multivariate regressions of each risk component on the set of demographic characteristics. Each panel presents the marginal effect of the corresponding characteristic in each of these regressions.
FIGURE 5
FIGURE 5
Employment loss, for all and by demographics NOTES: Changes in employment are computed relative to February and percent changes are normalized using the February level of employment. Employment incorporates both being at work and being absent from work.
FIGURE 6
FIGURE 6
Employment loss, for all and by demographics, 2008 recession NOTES: Percent changes are normalized using the September 2008 level of employment. Employment incorporates both being at work and being absent from work.
FIGURE 7
FIGURE 7
Increase in being employed but absent, for all and by demographics NOTE: Changes in employment are computed relative to February and percent changes are normalized using the February level of employment.
FIGURE 8
FIGURE 8
Employment loss by VSE Risk Index NOTES: Changes in employment are computed relative to February and percent changes are normalized using the February level of employment. Non‐health occupations are classified into three equal categories (low/medium/high) on the basis of their VSE Risk Index, weighted by the share of 2019 employment in a given four‐digit occupation. Employment incorporates both being at work and being absent from work.
FIGURE 9
FIGURE 9
Employment loss, by virus risk categories, 2008 recession NOTES: Percent changes are normalized using the September 2008 level of employment. Non‐health occupations are classified into three equal categories (low/medium/high) on the basis of their VSE Risk Index, weighted by the share of 2019 employment in a given four‐digit occupation. Employment incorporates both being at work and being absent from work.
FIGURE 10
FIGURE 10
Detailed employment loss by VSE Risk Index and demographics. NOTES: Changes in employment are computed relative to February and percent changes are normalized using the February level of employment. Non‐health occupations are classified into three equal categories (low/medium/high) on the basis of their VSE Risk Index, weighted by the share of 2019 employment in a given four‐digit occupation. Employment incorporates both being at work and being absent from work.
FIGURE 11
FIGURE 11
Breakdown of employment loss by demographics NOTE: Changes in employment are computed relative to February and percent changes are normalized using the February level of employment.
FIGURE 12
FIGURE 12
Probability of employment in June by non‐work state in April, group ratios NOTES: Ratios of proportions of people who were in each of the listed states in April 2020 and who were employed and at work in the LFS survey week in June 2020. Based on longitudinal LFS data.
FIGURE 13
FIGURE 13
Employment outcomes by household earnings and viral risk NOTES: Sample restricted to the 2020 January and February rotations. Household earnings and individual risk index/occupation determined in February 2020.
FIGURE A1
FIGURE A1
Regression of risk factors on occupation‐level characteristics: Excluding health occupations NOTES: Point estimates and 95% confidence intervals of risk components regressed on demographic characteristics of four‐digit NOC occupations. Results come from multivariate regressions of each risk component on the set of demographic characteristics. Each panel presents the marginal effect of the corresponding characteristic in each of these regressions.
FIGURE A2
FIGURE A2
Quantile regression of risk on occupation‐level characteristics: All occupations NOTES: Point estimates and 95% confidence intervals of VSE Risk Index regressed on demographic characteristics of four‐digit NOC occupations. Solid horizontal lines reproduce estimates presented in figure 3 and dashed lines, the corresponding 95% confidence intervals.
FIGURE A3
FIGURE A3
Probability of employment in June by non‐work state in April, group ratios NOTES: Ratios of proportions of people who were in each of the listed states in April 2020 and who were employed and at work in the LFS survey week in June 2020. Based on longitudinal LFS data.

References

    1. de Beyer, J. , and Knight J. B. (1989) “The role of occupation in the determination of wages,” Oxford Economic Papers 41(3), 595–618
    1. Chernoff, A.W. , and Warman C. (2020) “COVID‐19 and implications for automation,” NBER working papers no. 27249
    1. Cortes, G.M. , and Forsythe E. C. (2020) “The heterogeneous labor market impacts of the COVID‐19 pandemic,” Upjohn Working Papers and Journal Articles, no. 20‐327 - PMC - PubMed
    1. Delaney, J.M. , and Devereux P. J. (2019) “More education, less volatility? The effect of education on earnings volatility over the life cycle,” Journal of Labor Economics 37(1), 101–37
    1. Deming, D. , and Kahn L. B. (2018) “Skill requirements across firms and labor markets: Evidence from job postings for professionals,” Journal of Labor Economics 36(S1), S337–S369

LinkOut - more resources