Identifying Diagnostic and Prognostic Biomarkers and Candidate Therapeutic Drugs of Gastric Cancer Based on Transcriptomics and Single-Cell Sequencing
- PMID: 34899080
- PMCID: PMC8654733
- DOI: 10.3389/pore.2021.1609955
Identifying Diagnostic and Prognostic Biomarkers and Candidate Therapeutic Drugs of Gastric Cancer Based on Transcriptomics and Single-Cell Sequencing
Abstract
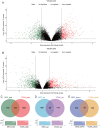
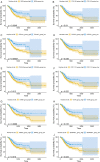
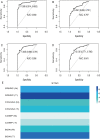
Background and Objective: Gastric cancer (GC) is an important health burden and the prognosis of GC is poor. We aimed to explore new diagnostic and prognostic indicators as well as potential therapeutic targets for GC in the current study. Methods: We screened the overlapped differentially expressed genes (DEGs) from GSE54129 and TCGA STAD datasets. Protein-protein interaction network analysis recognized the hub genes among the DEGs. The roles of these genes in diagnosis, prognosis, and their relationship with immune infiltrates and drug sensitivity of GC were analyzed using R studio. Finally, the clinically significant hub genes were verified using single-cell RNA sequencing (scRNA-seq) data. Results: A total of 222 overlapping genes were screened, which were enriched in extracellular matrix-related pathways. Further, 17 hub genes were identified, and our findings demonstrated that BGN, COMP, COL5A2, and SPARC might be important diagnostic and prognostic indicators of GC, which were also correlated with immune cell infiltration, tumor mutation burden (TMB), microsatellite instability (MSI), and sensitivity of therapeutic drugs. The scRNA-seq results further confirmed that all four hub genes were highly expressed in GC. Conclusion: Based on transcriptomics and single-cell sequencing, we identified four diagnostic and prognostic biomarkers of GC, including BGN, COMP, COL5A2, and SPARC, which can help predict drug sensitivity for GC as well.
Keywords: bioinformatics; biomarkers; gastric cancer; hub genes; molecular drugs; prognosis.
Copyright © 2021 Zhao, Wu and Jing.
Conflict of interest statement
The authors declare that the research was conducted in the absence of any commercial or financial relationships that could be construed as a potential conflict of interest.
Figures


Similar articles
-
Identification of differentially expressed genes associated with the pathogenesis of gastric cancer by bioinformatics analysis.BMC Med Genomics. 2023 Dec 1;16(1):311. doi: 10.1186/s12920-023-01720-7. BMC Med Genomics. 2023. PMID: 38041130 Free PMC article.
-
Fatty Acid Metabolism Signature Contributes to the Molecular Diagnosis of a Malignant Gastric Cancer Subtype with Poor Prognosis and Lower Mutation Burden.Recent Pat Anticancer Drug Discov. 2024;19(5):666-680. doi: 10.2174/1574892819666230907145036. Recent Pat Anticancer Drug Discov. 2024. PMID: 37691229
-
COL5A2 is a prognostic-related biomarker and correlated with immune infiltrates in gastric cancer based on transcriptomics and single-cell RNA sequencing.BMC Med Genomics. 2023 Sep 18;16(1):220. doi: 10.1186/s12920-023-01659-9. BMC Med Genomics. 2023. PMID: 37723519 Free PMC article.
-
Molecular alterations in gastric cancer with special reference to the early-onset subtype.World J Gastroenterol. 2016 Feb 28;22(8):2460-74. doi: 10.3748/wjg.v22.i8.2460. World J Gastroenterol. 2016. PMID: 26937134 Free PMC article. Review.
-
Bioinformatics Analysis and Validation of Potential Markers Associated with Prediction and Prognosis of Gastric Cancer.Int J Mol Sci. 2024 May 28;25(11):5880. doi: 10.3390/ijms25115880. Int J Mol Sci. 2024. PMID: 38892067 Free PMC article. Review.
Cited by
-
Multi-omics Combined with Machine Learning Facilitating the Diagnosis of Gastric Cancer.Curr Med Chem. 2024;31(40):6692-6712. doi: 10.2174/0109298673284520240112055108. Curr Med Chem. 2024. PMID: 38351697 Review.
-
Host Transcriptional Regulatory Genes and Microbiome Networks Crosstalk through Immune Receptors Establishing Normal and Tumor Multiomics Metafirm of the Oral-Gut-Lung Axis.Int J Mol Sci. 2023 Nov 23;24(23):16638. doi: 10.3390/ijms242316638. Int J Mol Sci. 2023. PMID: 38068961 Free PMC article. Review.
-
Exploring the current landscape of single-cell RNA sequencing applications in gastric cancer research.J Cell Mol Med. 2024 Apr;28(7):e18159. doi: 10.1111/jcmm.18159. J Cell Mol Med. 2024. PMID: 38494861 Free PMC article. Review.
-
Omics Overview of the SPARC Gene in Mesothelioma.Biomolecules. 2023 Jul 11;13(7):1103. doi: 10.3390/biom13071103. Biomolecules. 2023. PMID: 37509139 Free PMC article. Review.
-
Identification of differentially expressed genes associated with the pathogenesis of gastric cancer by bioinformatics analysis.BMC Med Genomics. 2023 Dec 1;16(1):311. doi: 10.1186/s12920-023-01720-7. BMC Med Genomics. 2023. PMID: 38041130 Free PMC article.
References
MeSH terms
Substances
LinkOut - more resources
Full Text Sources
Medical
Miscellaneous

