

First wave of SARS-COV2 in Europe: Study and typology of the 15 worst affected European countries
- PMID: 34899095
- PMCID: PMC8646875
- DOI: 10.1002/psp.2534
First wave of SARS-COV2 in Europe: Study and typology of the 15 worst affected European countries
Abstract
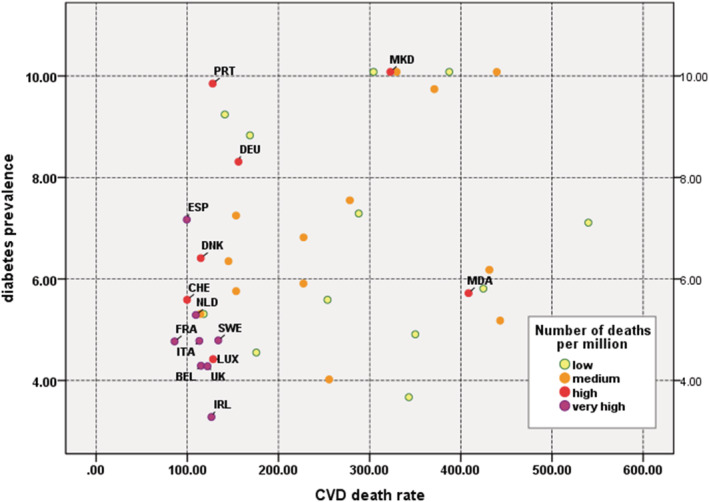
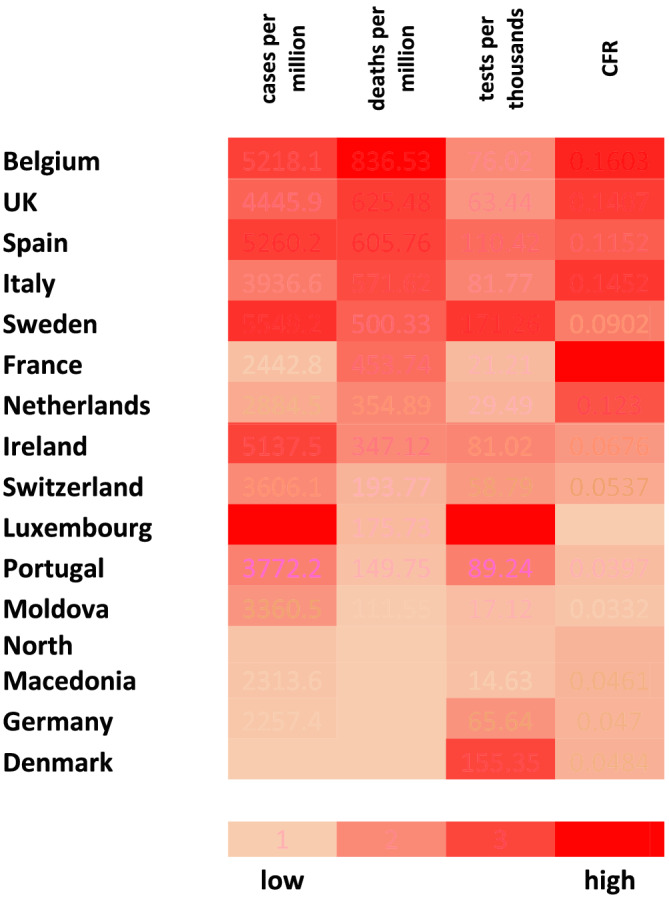
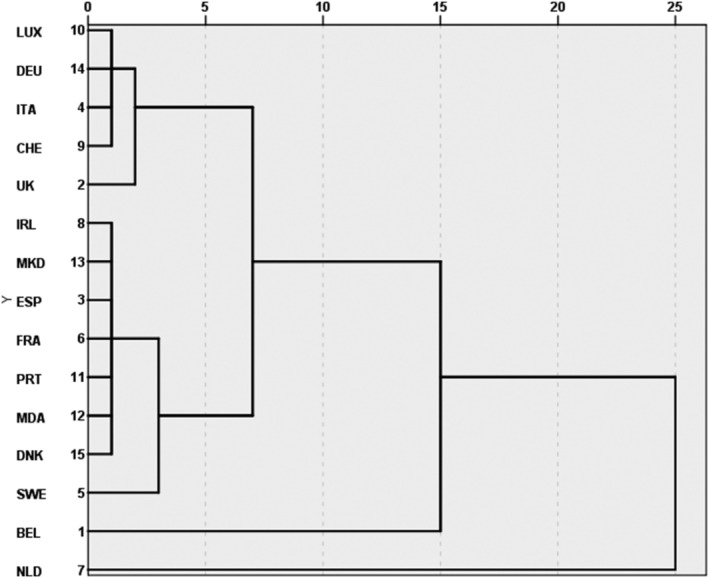
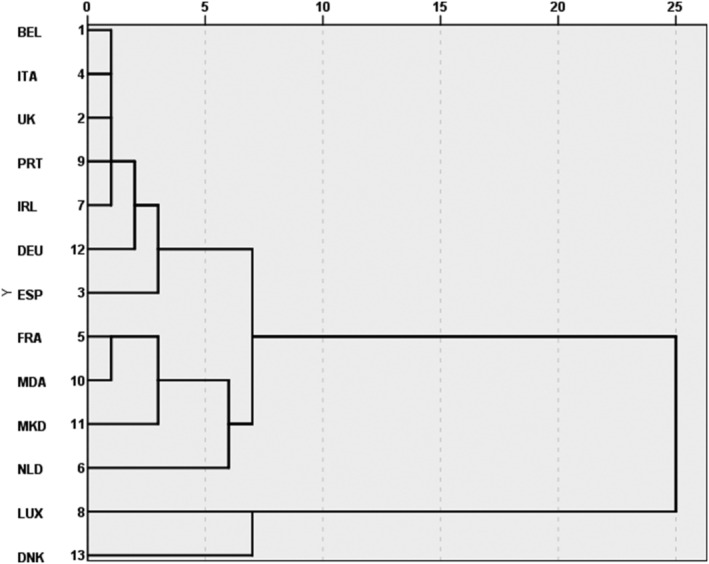
Since 11 March 2020 when officially declared a global pandemic, Covid-19 (or SARS-COV2) has turned out to be a multifaceted disease differently affecting countries and individuals. What makes certain countries more vulnerable than others has attracted the interest of scientists from various disciplines. This paper intends to compare the impact of demographic parameters, population health conditions and policy actions on prevalence and fatality levels of Covid-19 during the first 3 months since its declaration of global pandemic. A country-level exploratory analysis has been conducted in order to assess how demography, national health conditions and measures taken interact and condition the disease outcomes. Analysis relies on publicly available data on Covid-19 reported cases, deaths and number of persons tested. Those data are combined with demographic parameters (sex ratio, mean age, population density and life expectancy), health data (cardiovascular death rate, diabetes prevalence, share of smokers among males and females and number of hospital beds) and information about relative national policies aiming the management of the pandemic (lockdown timing and duration). Our analysis confirms the diversity of factors and the complexity of their interaction in explaining the propagation and fatality of the disease across Europe. Our findings question some well-established attitudes concerning the role of demographic variables and public health conditions in the spread of the disease.
Keywords: Covid‐19; Europe; age; cardiovascular death rate; demography; pandemic; policy measures; sex ratio.
© 2021 John Wiley & Sons, Ltd.
Figures
Similar articles
-
Impact of lockdown on Covid-19 case fatality rate and viral mutations spread in 7 countries in Europe and North America.J Transl Med. 2020 Sep 2;18(1):338. doi: 10.1186/s12967-020-02501-x. J Transl Med. 2020. PMID: 32878627 Free PMC article.
-
Modeling and tracking Covid-19 cases using Big Data analytics on HPCC system platformm.J Big Data. 2021;8(1):33. doi: 10.1186/s40537-021-00423-z. Epub 2021 Feb 15. J Big Data. 2021. PMID: 33614394 Free PMC article.
-
The impact of the COVID-19 Pandemic on the Greek population: Suicidal ideation during the first and second lockdown.Psychiatriki. 2021 Dec 20;32(4):267-270. doi: 10.22365/jpsych.2021.041. Epub 2021 Nov 26. Psychiatriki. 2021. PMID: 34860683 English, Greek, Modern.
-
Insights into the first seven-months of COVID-19 pandemic in Bangladesh: lessons learned from a high-risk country.Heliyon. 2021 Jun;7(6):e07385. doi: 10.1016/j.heliyon.2021.e07385. Epub 2021 Jun 25. Heliyon. 2021. PMID: 34189333 Free PMC article. Review.
-
How to Minimize the Impact of Pandemic Events: Lessons From the COVID-19 Crisis.Int J Health Policy Manag. 2020 Nov 1;9(11):469-474. doi: 10.34172/ijhpm.2020.115. Int J Health Policy Manag. 2020. PMID: 32654431 Free PMC article. Review.
Cited by
-
Occupation and SARS-CoV-2 in Europe: a review.Eur Respir Rev. 2024 Sep 18;33(173):240044. doi: 10.1183/16000617.0044-2024. Print 2024 Jul. Eur Respir Rev. 2024. PMID: 39293853 Free PMC article. Review.
-
Tracing and testing multiple generations of contacts to COVID-19 cases: cost-benefit trade-offs.R Soc Open Sci. 2022 Oct 12;9(10):211927. doi: 10.1098/rsos.211927. eCollection 2022 Oct. R Soc Open Sci. 2022. PMID: 36249339 Free PMC article.
-
Trends and Risk Factors of In-Hospital Mortality of Patients with COVID-19 in Germany: Results of a Large Nationwide Inpatient Sample.Viruses. 2022 Jan 28;14(2):275. doi: 10.3390/v14020275. Viruses. 2022. PMID: 35215869 Free PMC article.
-
Shortages of Medicines to Treat COVID-19 Symptoms during the First Wave and Fourth Wave: Analysis of Notifications Reported to Registers in Austria, Italy, and Spain.Pharmacy (Basel). 2023 Jul 21;11(4):120. doi: 10.3390/pharmacy11040120. Pharmacy (Basel). 2023. PMID: 37489351 Free PMC article.
-
Impact of biologics and small molecules for inflammatory bowel disease on COVID-19-related hospitalization and mortality: A systematic review and meta-analysis.JGH Open. 2022 Mar 20;6(4):241-250. doi: 10.1002/jgh3.12728. eCollection 2022 Apr. JGH Open. 2022. PMID: 35475207 Free PMC article.
References
-
- Dowd, J. B. , Andriano, L. , Brazel, D. M. , Rotondi, V. , Block, P. , Ding, X. , Liu, Y. , & Mills, M. C. (2020). Demographic science aids in understanding the spread and fatality rates of COVID‐19. Proceedings of the National Academy of Sciences, 117, 9696–9698. 10.1073/pnas.2004911117 - DOI - PMC - PubMed
-
- Eurostat . (2020) Demography/population on 1 January by age and sex. https://ec.europa.eu/eurostat/databrowser/view/demo_pjan/default/table?l... Accessed 30 June 2020.
LinkOut - more resources
Full Text Sources
Miscellaneous