. 2021;111(1):1-335.
doi: 10.1007/s13225-021-00489-3. Epub 2021 Dec 7.

Fungal diversity notes 1387-1511: taxonomic and phylogenetic contributions on genera and species of fungal taxa

Saranyaphat Boonmee  1   2 Dhanushka N Wanasinghe  3   4   5 Mark S Calabon  1   2 Naruemon Huanraluek  1 Sajini K U Chandrasiri  1   2 Gareth E B Jones  6 Walter Rossi  7 Marco Leonardi  7 Sanjay K Singh  8 Shiwali Rana  8 Paras N Singh  8 Deepak K Maurya  8 Ajay C Lagashetti  8 Deepika Choudhary  8 Yu-Cheng Dai  9 Chang-Lin Zhao  10 Yan-Hong Mu  11   12 Hai-Sheng Yuan  11 Shuang-Hui He  9 Rungtiwa Phookamsak  3   4   5   13 Hong-Bo Jiang  1   2   3 María P Martín  14 Margarita Dueñas  14 M Teresa Telleria  14 Izabela L Kałucka  15 Andrzej M Jagodziński  16 Kare Liimatainen  17 Diana S Pereira  18 Alan J L Phillips  18 Nakarin Suwannarach  19   20 Jaturong Kumla  19   20 Surapong Khuna  19   20 Saisamorn Lumyong  19   20   21 Tarynn B Potter  22 Roger G Shivas  22   23 Adam H Sparks  22   24 Niloofar Vaghefi  22 Mohamed A Abdel-Wahab  25 Faten A Abdel-Aziz  25 Guo-Jie Li  26 Wen-Fei Lin  27 Upendra Singh  28 Rajendra P Bhatt  28 Hyang Burm Lee  29 Thuong T T Nguyen  29 Paul M Kirk  30 Arun Kumar Dutta  31   32 Krishnendu Acharya  32 V Venkateswara Sarma  33 M Niranjan  33   34 Kunhiraman C Rajeshkumar  8 Nikhil Ashtekar  8 Sneha Lad  8 Nalin N Wijayawardene  35 Darbe J Bhat  36 Rong-Ju Xu  1   2   3 Subodini N Wijesinghe  1   2 Hong-Wei Shen  1   2   37 Zong-Long Luo  37 Jing-Yi Zhang  1   2   38 Phongeun Sysouphanthong  1   2   39 Naritsada Thongklang  1   2 Dan-Feng Bao  1   37   40 Janith V S Aluthmuhandiram  1   2   41 Jafar Abdollahzadeh  42 Alireza Javadi  43 Francesco Dovana  44 Muhammad Usman  45 Abdul Nasir Khalid  45 Asha J Dissanayake  46 Anusha Telagathoti  47 Maraike Probst  47 Ursula Peintner  47 Isaac Garrido-Benavent  48 Lilla Bóna  49 Zsolt Merényi  50 Lajos Boros  51 Bratek Zoltán  49 J Benjamin Stielow  52   53 Ning Jiang  54 Cheng-Ming Tian  54 Esmaeil Shams  55 Farzaneh Dehghanizadeh  56 Adel Pordel  57 Mohammad Javan-Nikkhah  55 Teodor T Denchev  58 Cvetomir M Denchev  58 Martin Kemler  59 Dominik Begerow  59 Chun-Ying Deng  60 Emma Harrower  61 Tohir Bozorov  62 Tutigul Kholmuradova  63 Yusufjon Gafforov  63 Aziz Abdurazakov  63   64 Jian-Chu Xu  3   4   5   13 Peter E Mortimer  3   4 Guang-Cong Ren  1   2 Rajesh Jeewon  65 Sajeewa S N Maharachchikumbura  46 Chayanard Phukhamsakda  66 Ausana Mapook  1 Kevin D Hyde  1   3   19   20   67
Affiliations

Fungal diversity notes 1387-1511: taxonomic and phylogenetic contributions on genera and species of fungal taxa

Saranyaphat Boonmee et al. Fungal Divers. 2021.

Abstract

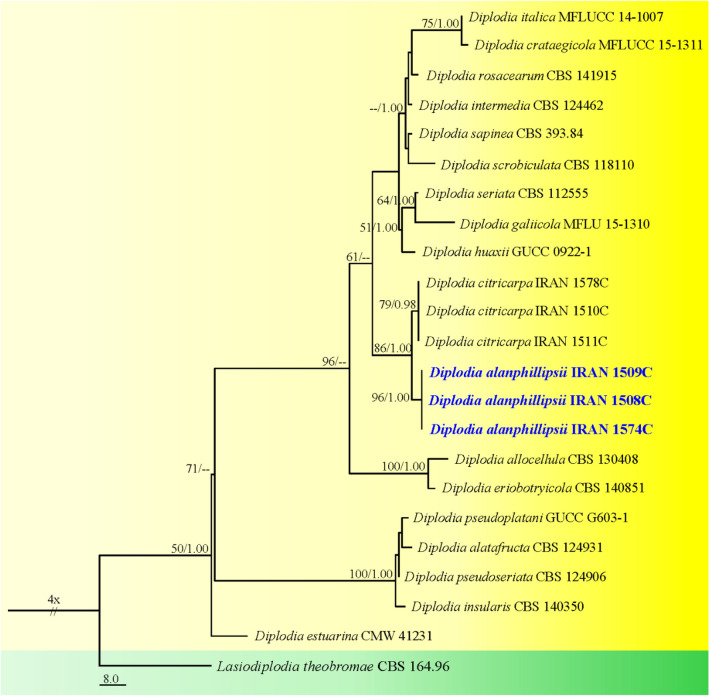
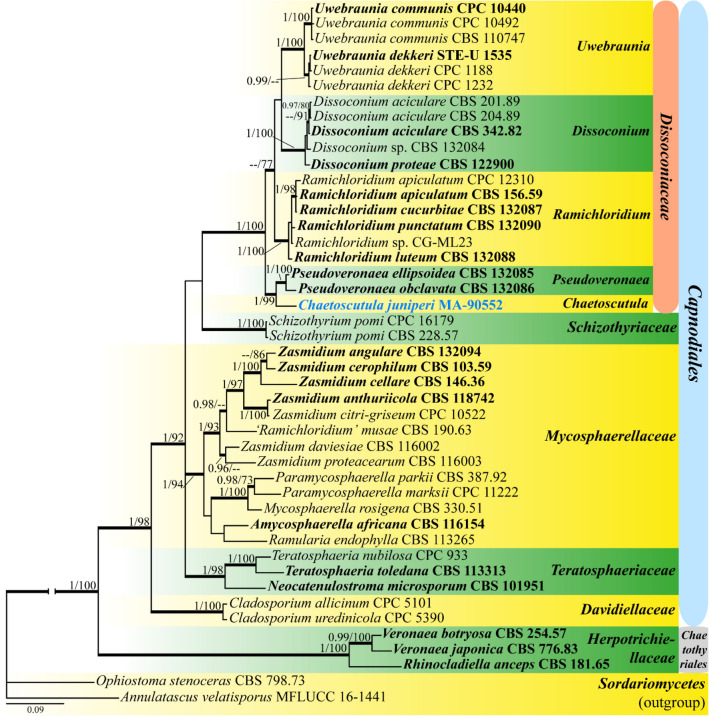
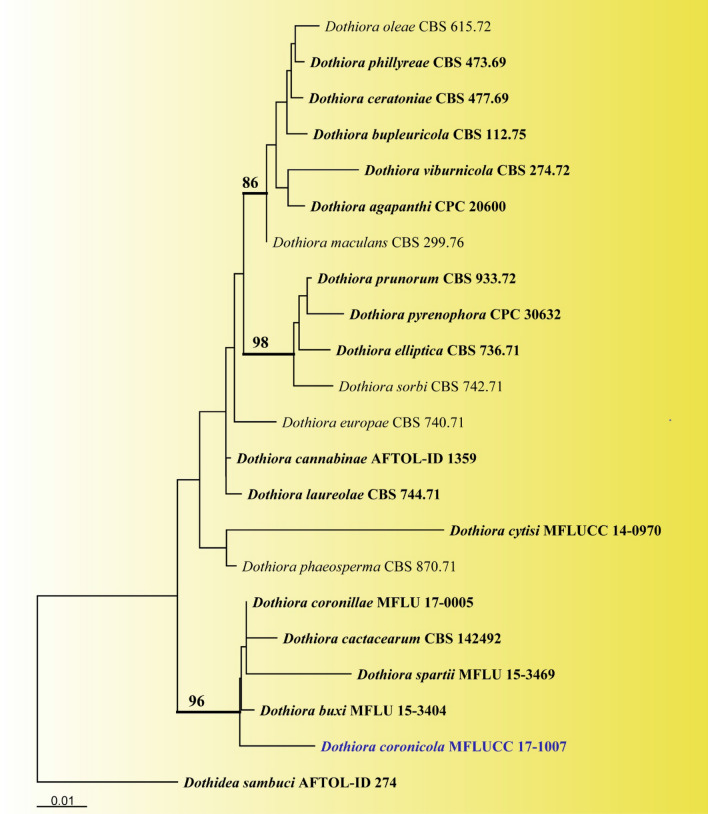
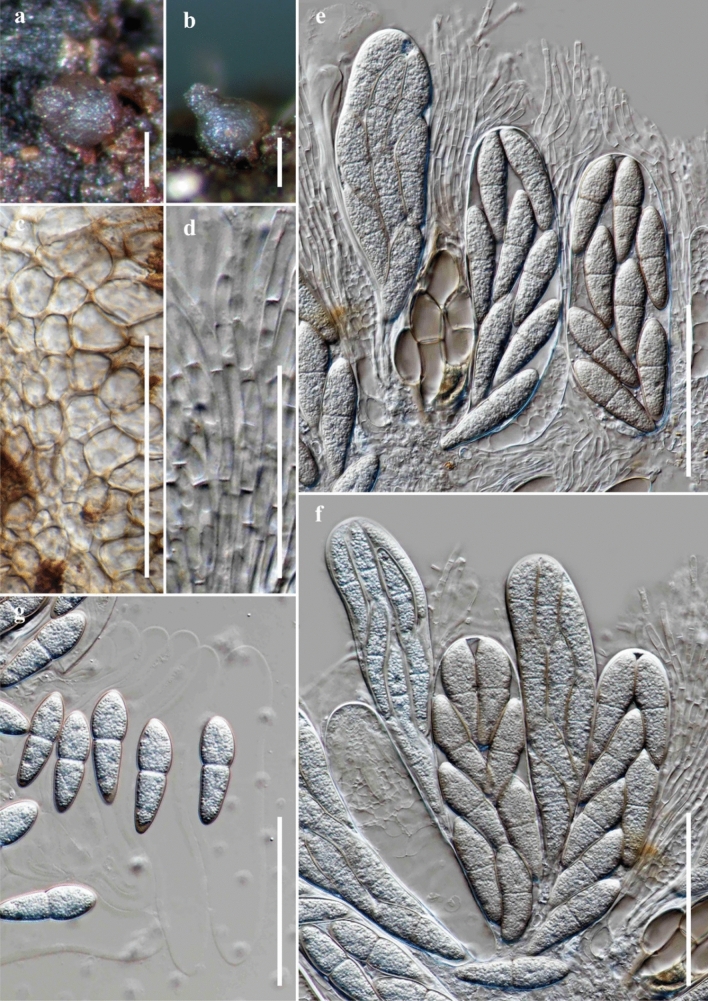
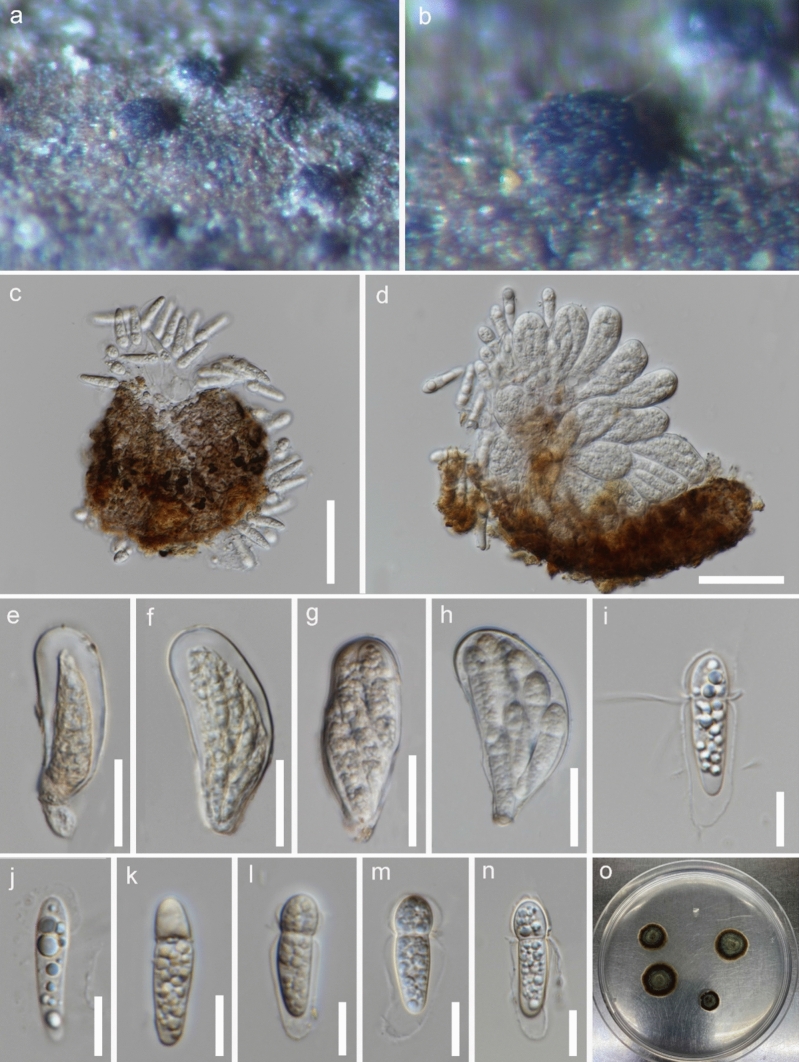
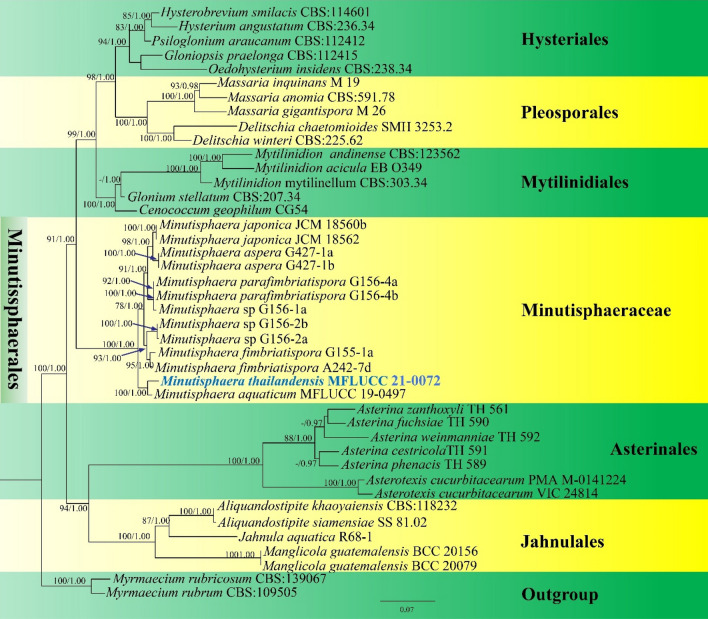
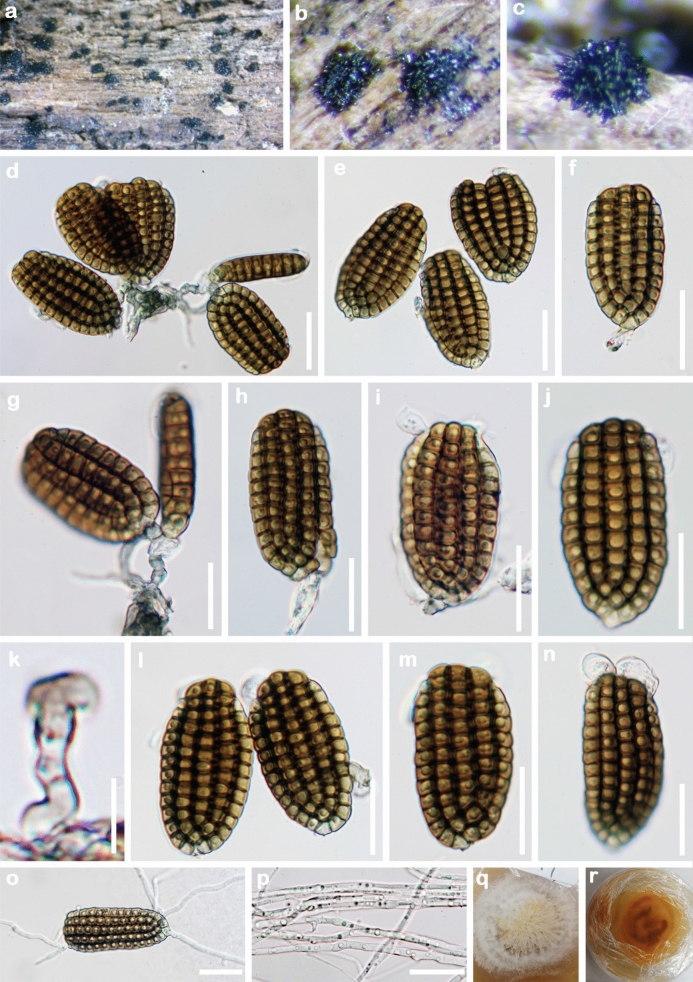
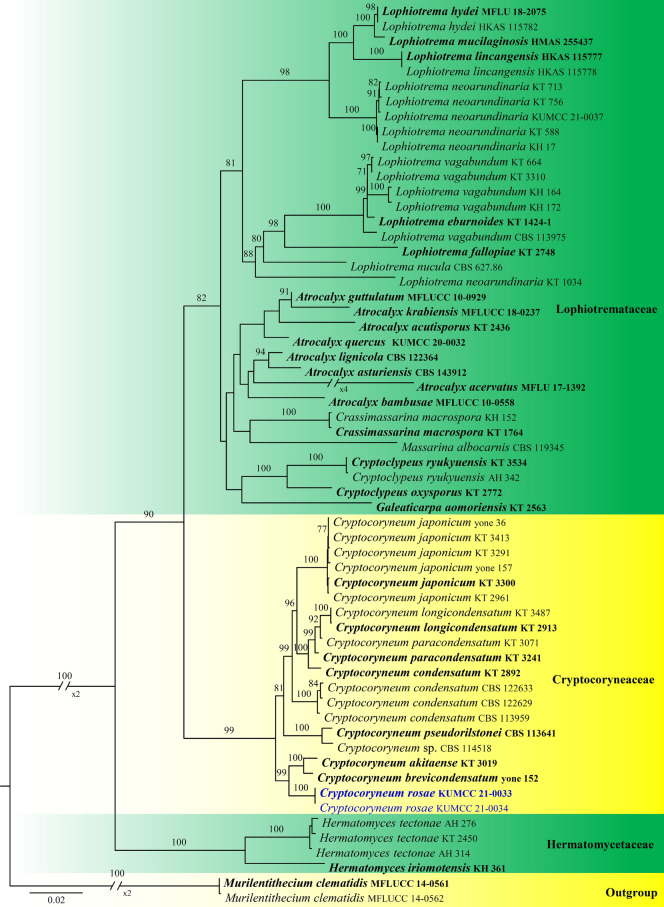
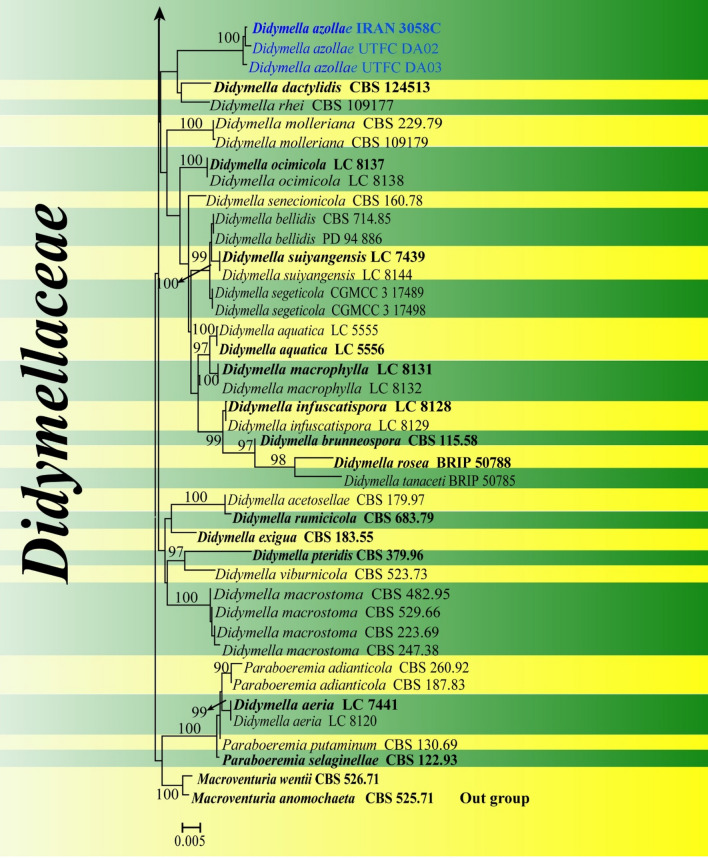
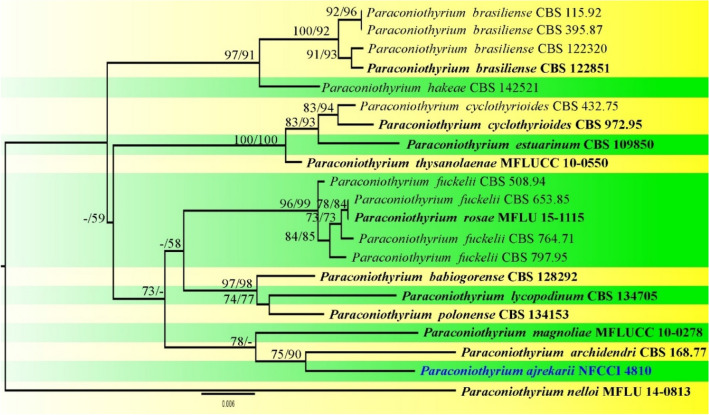
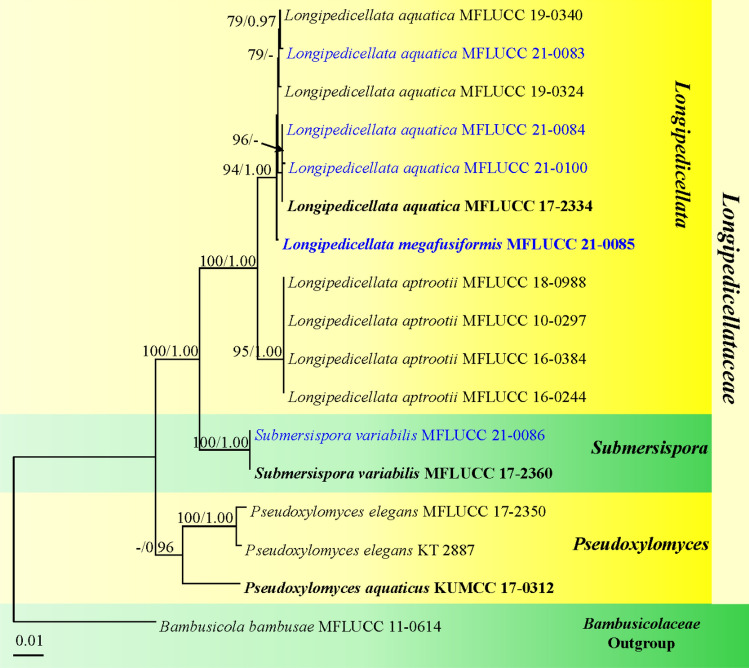
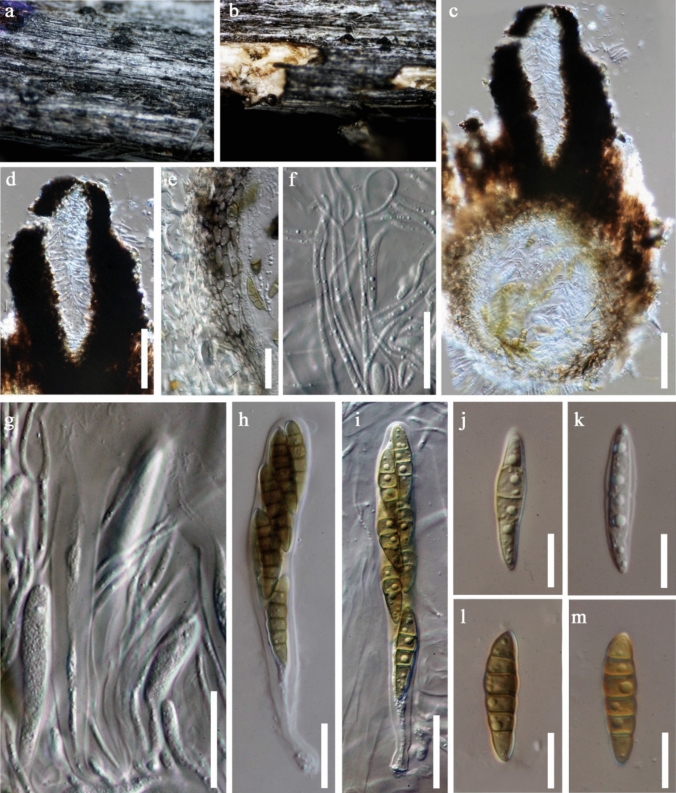
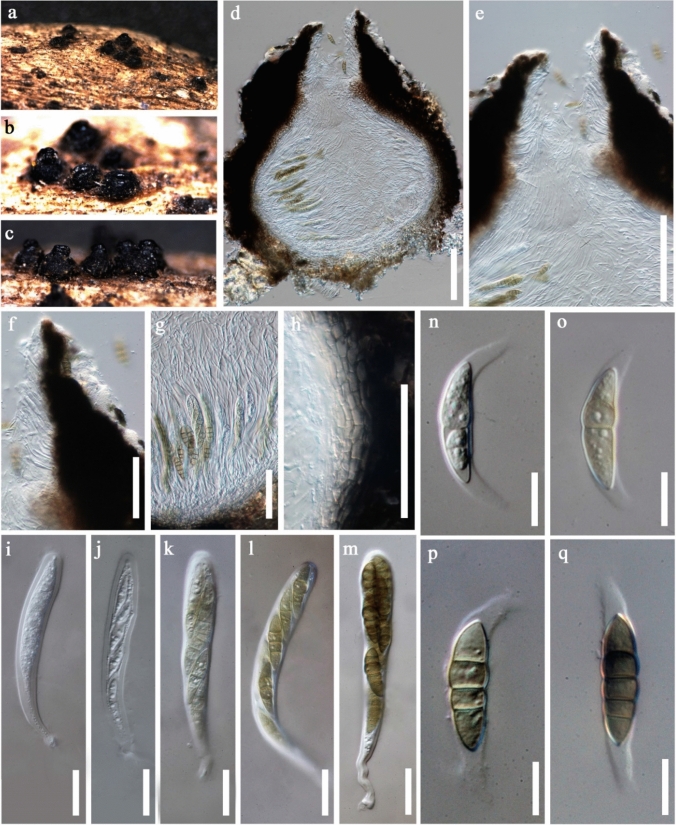
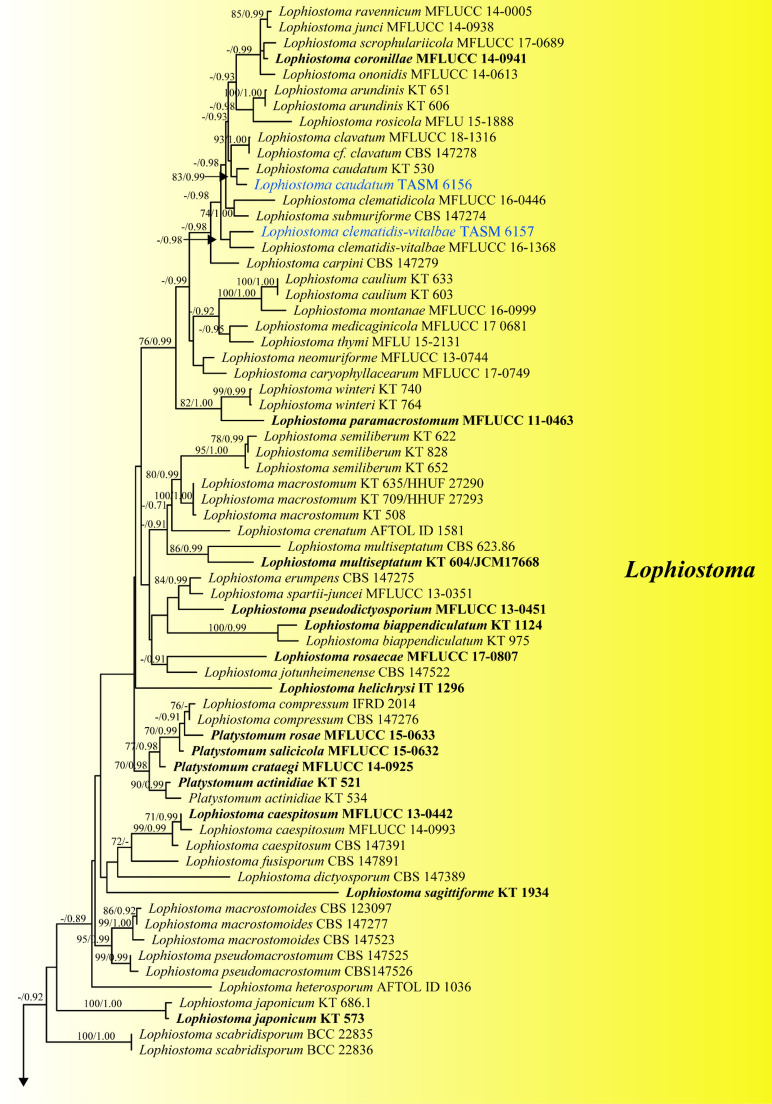
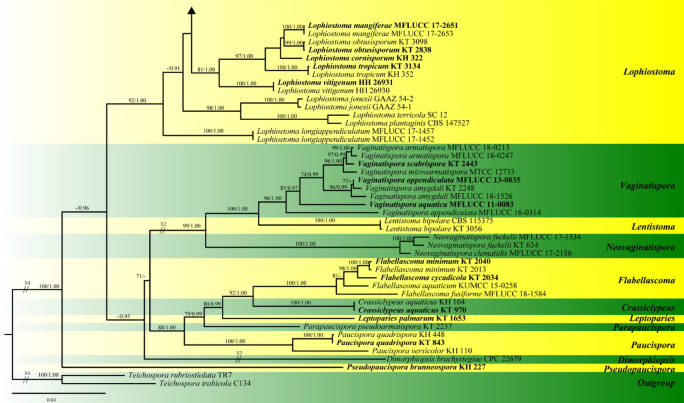
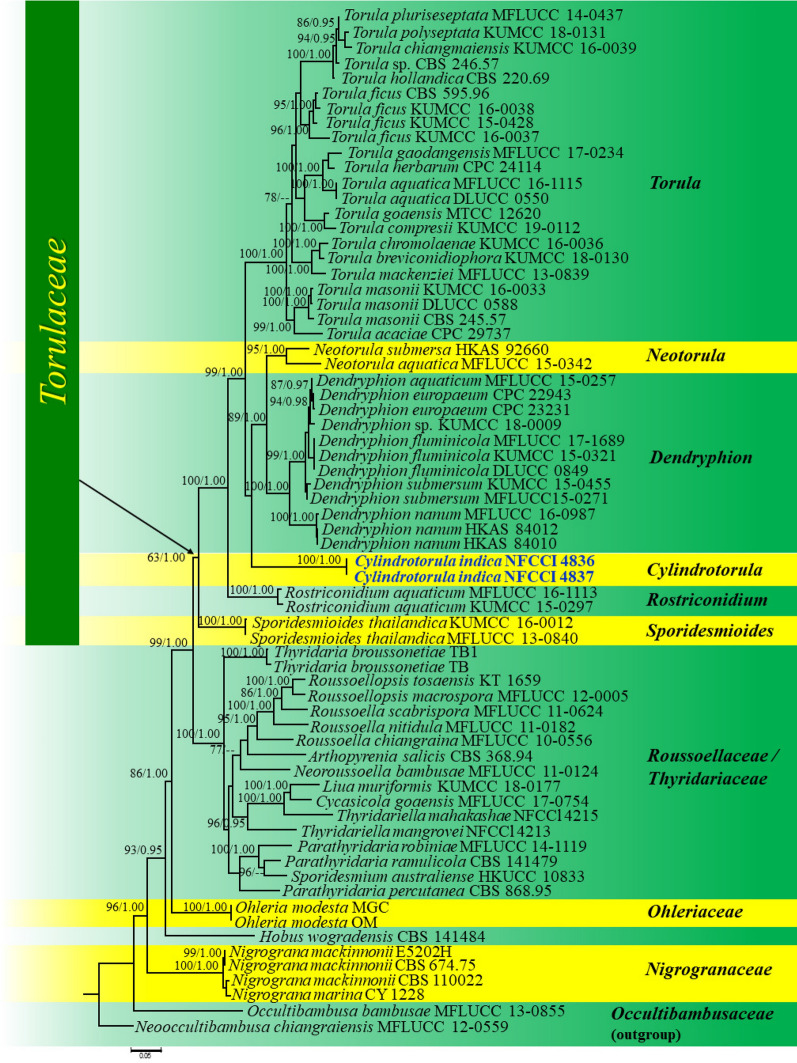
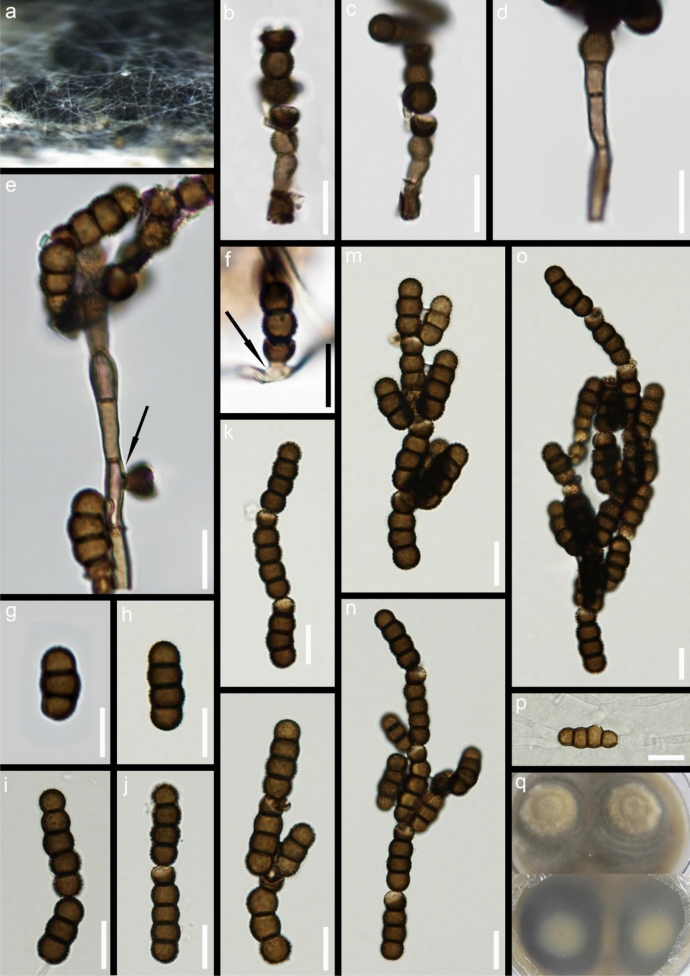
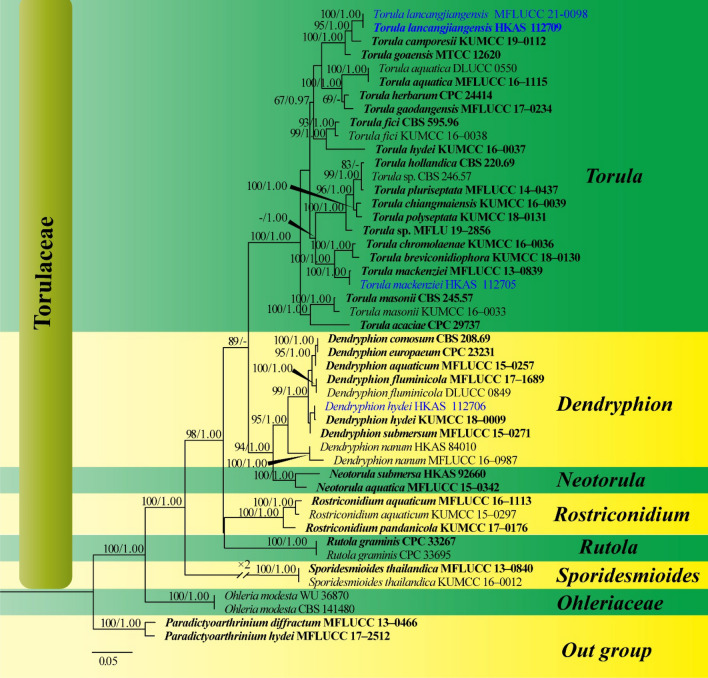
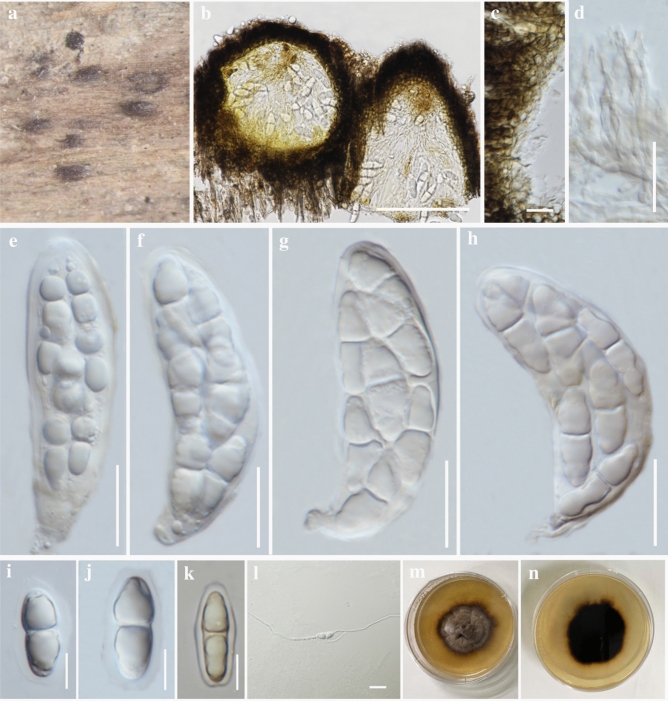
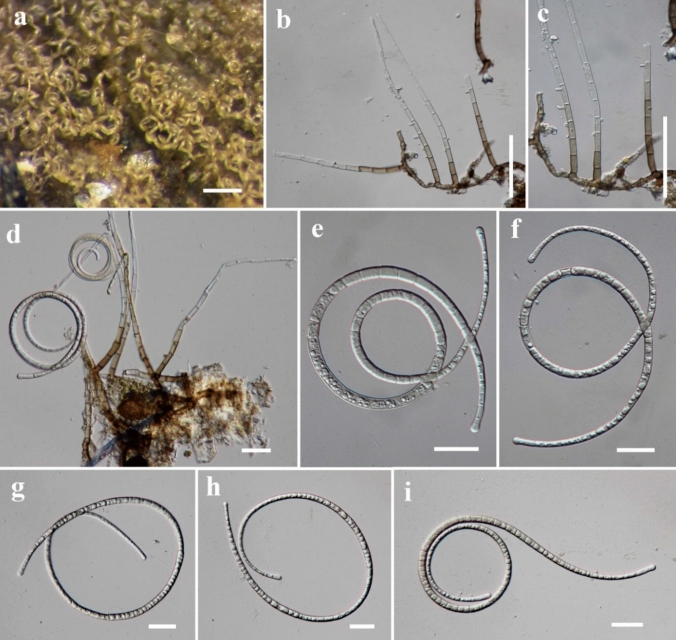
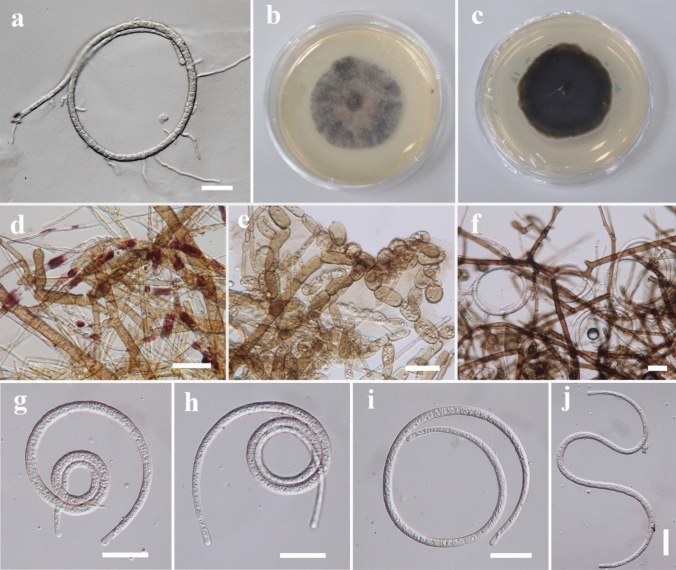
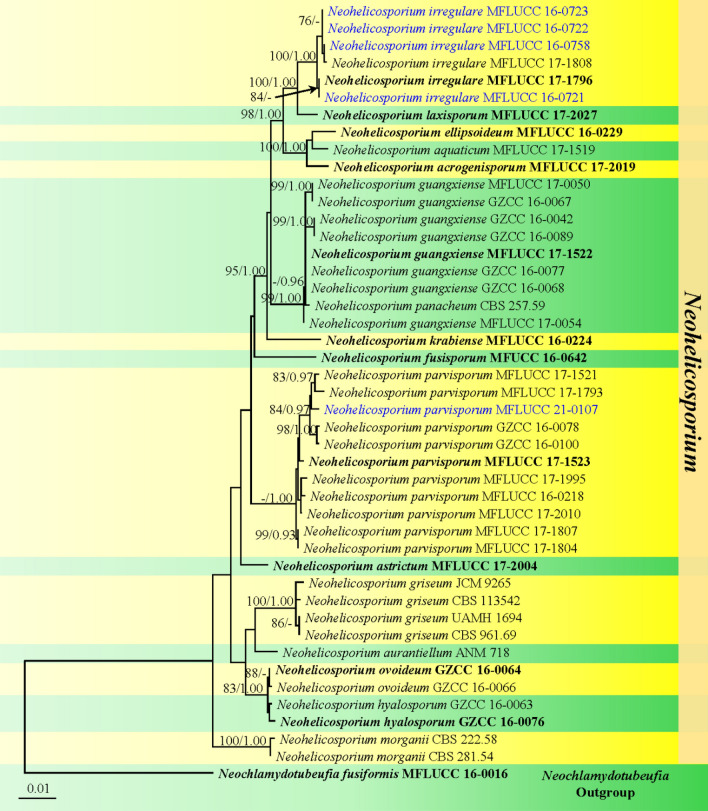
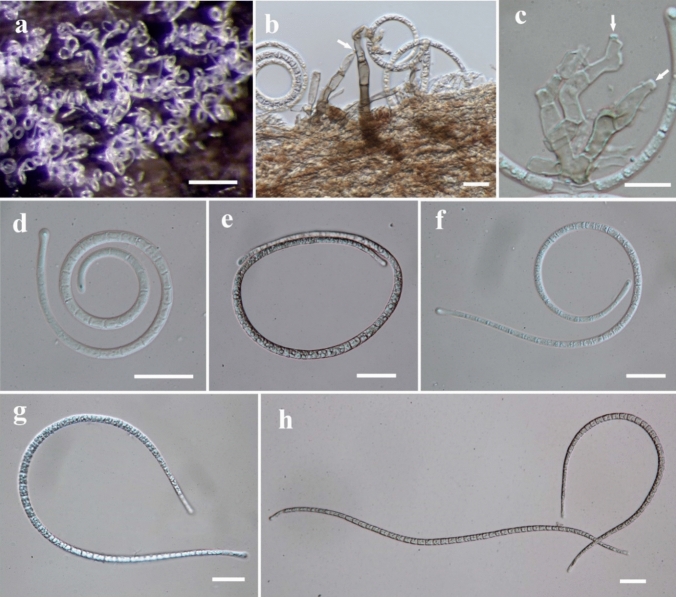
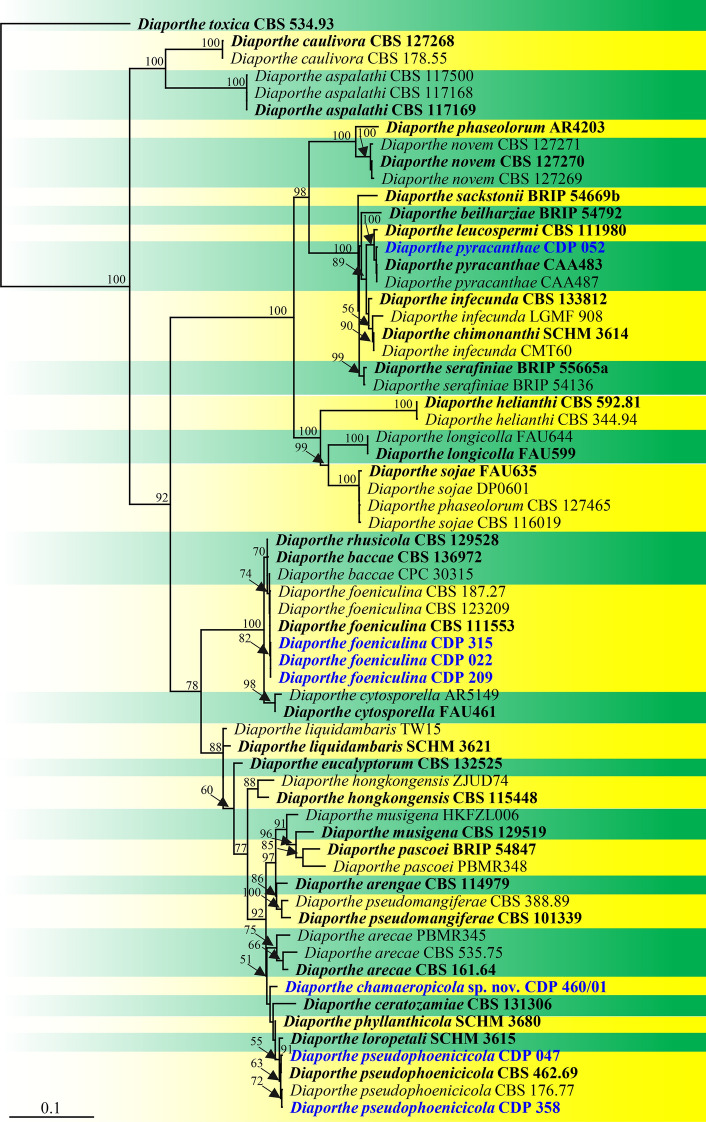
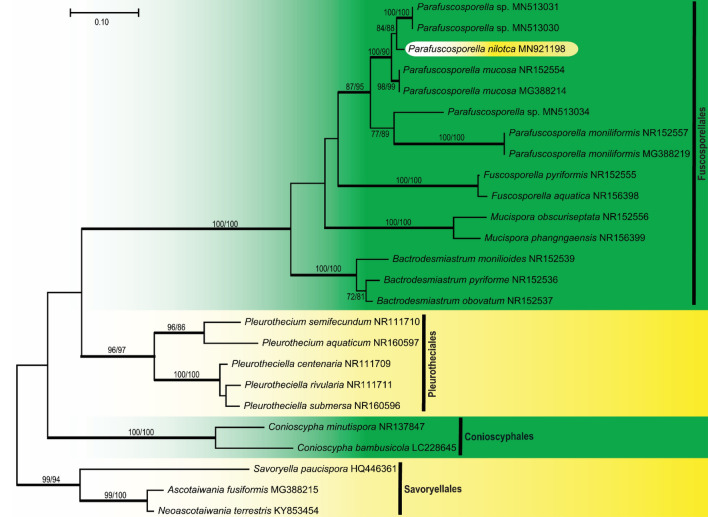
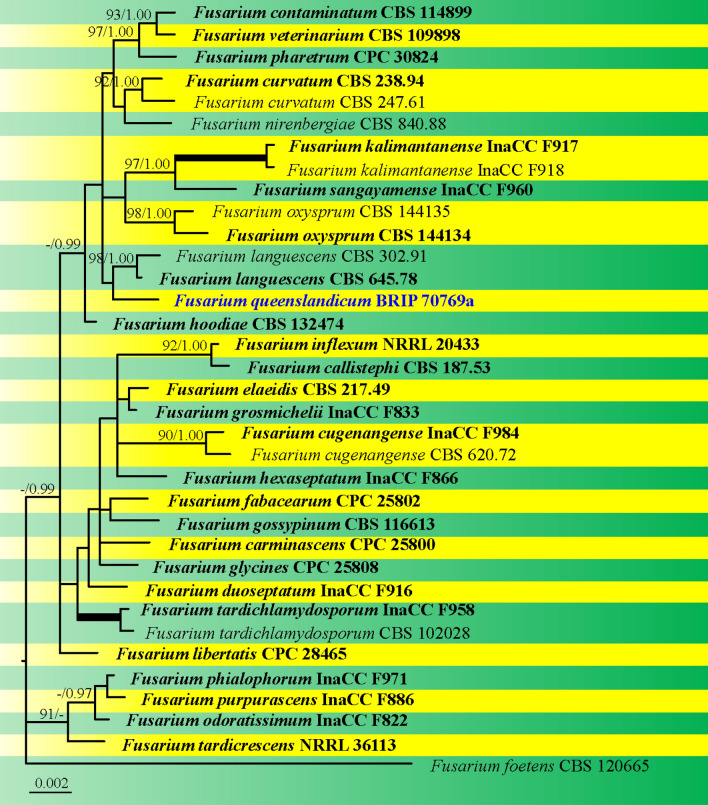
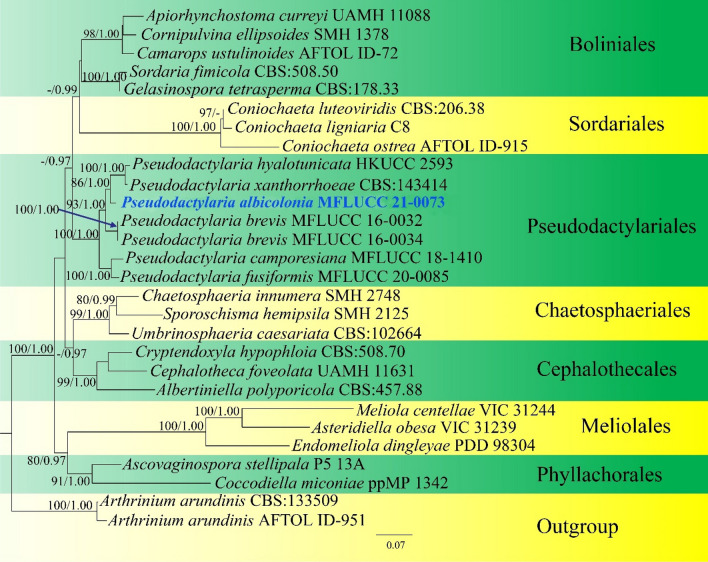
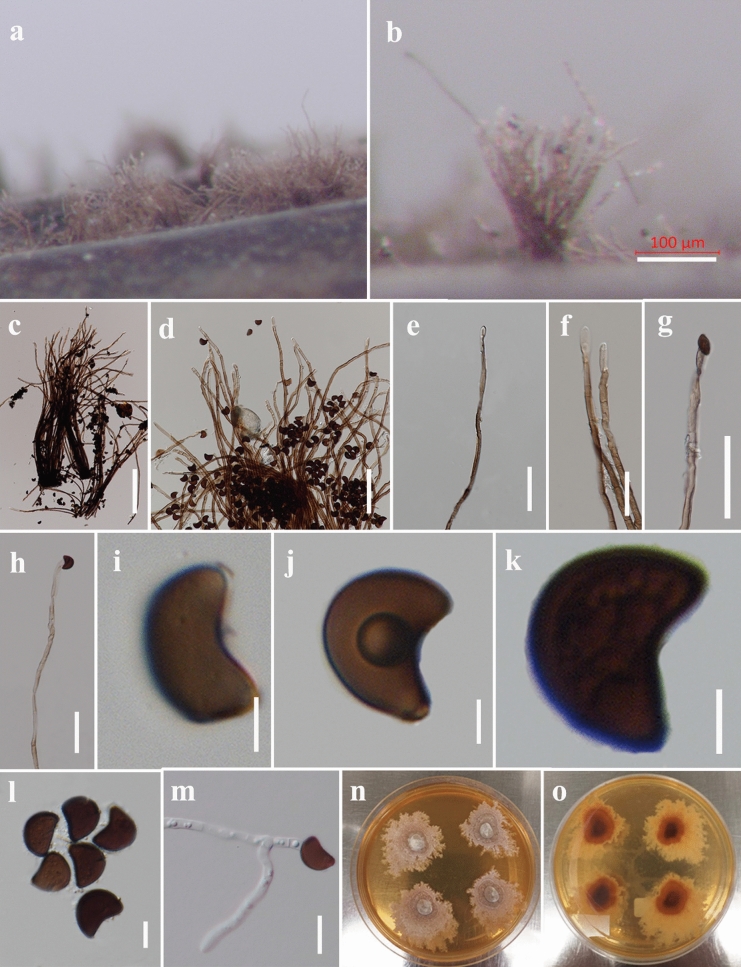
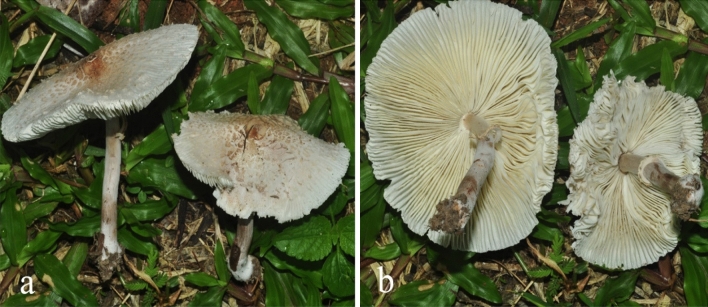
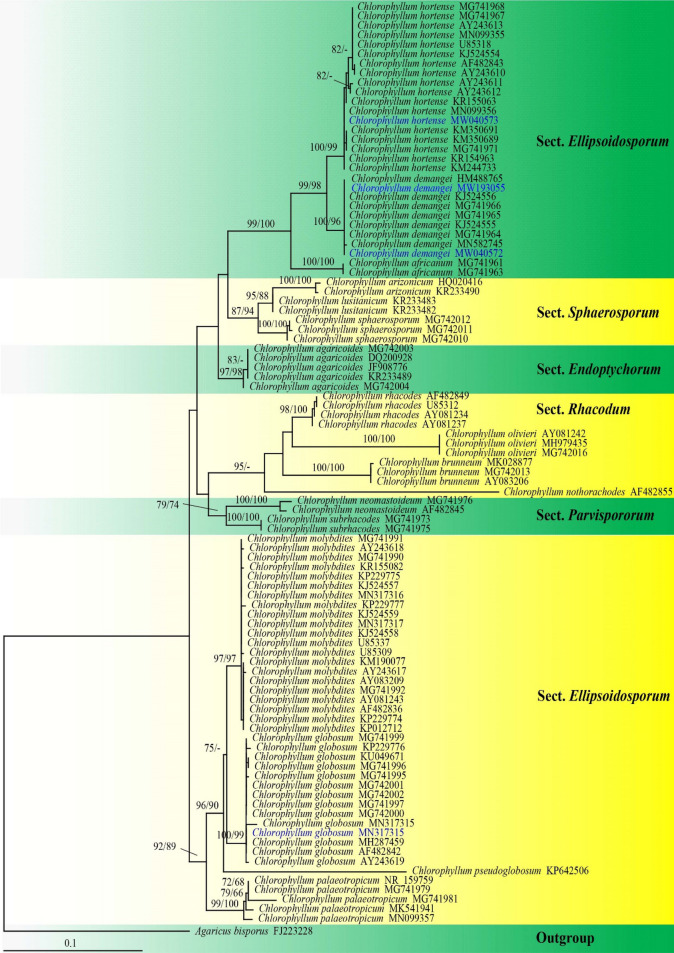
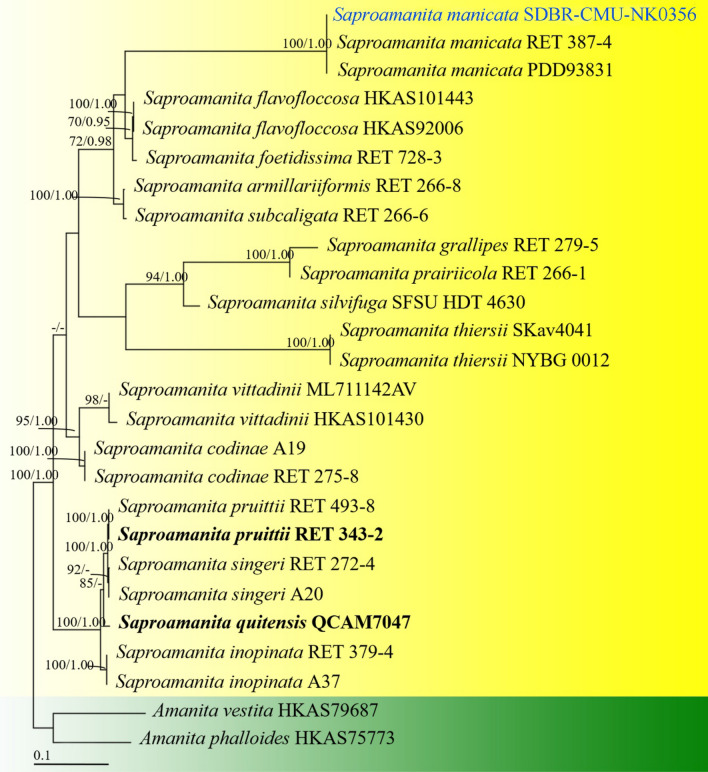
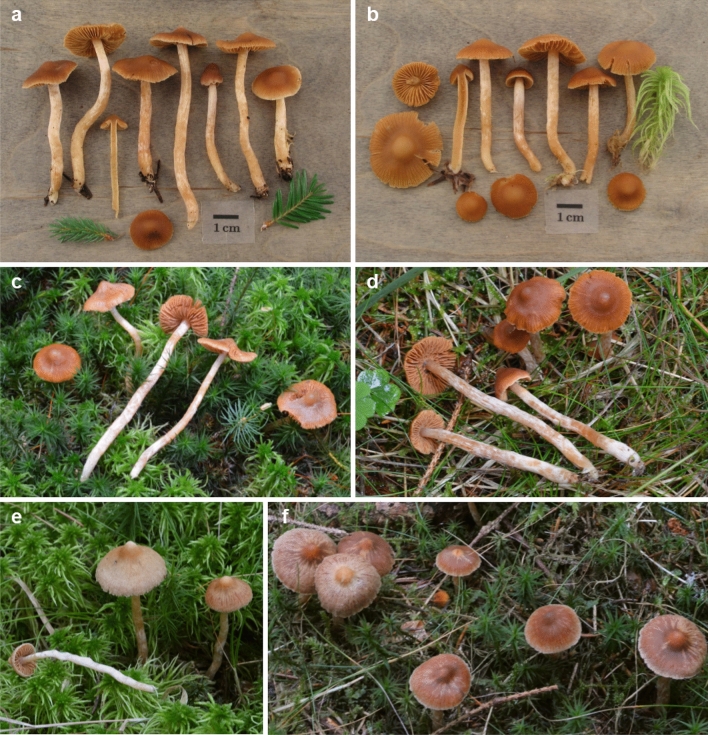
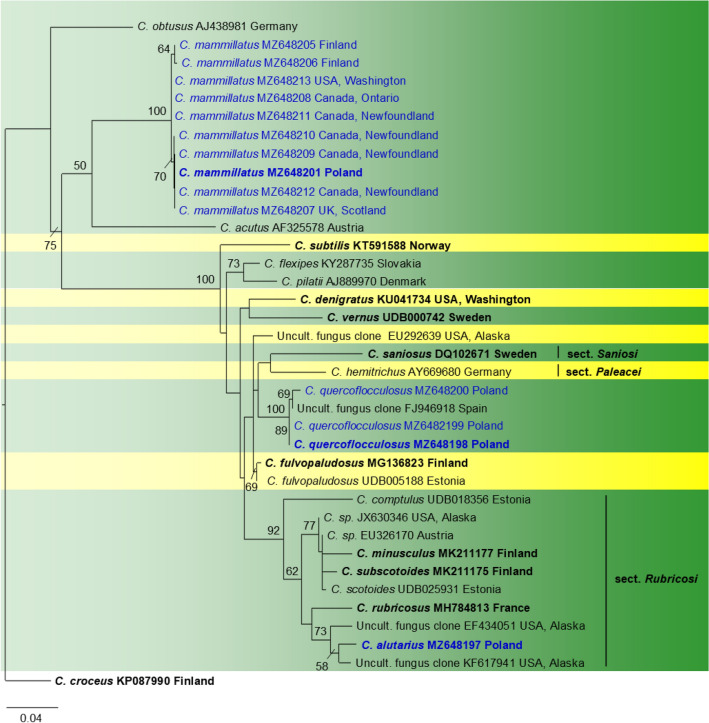
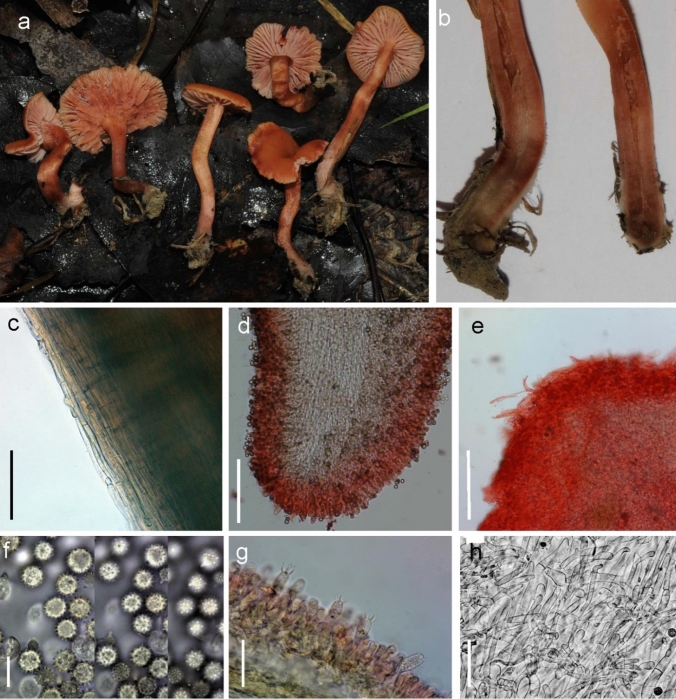
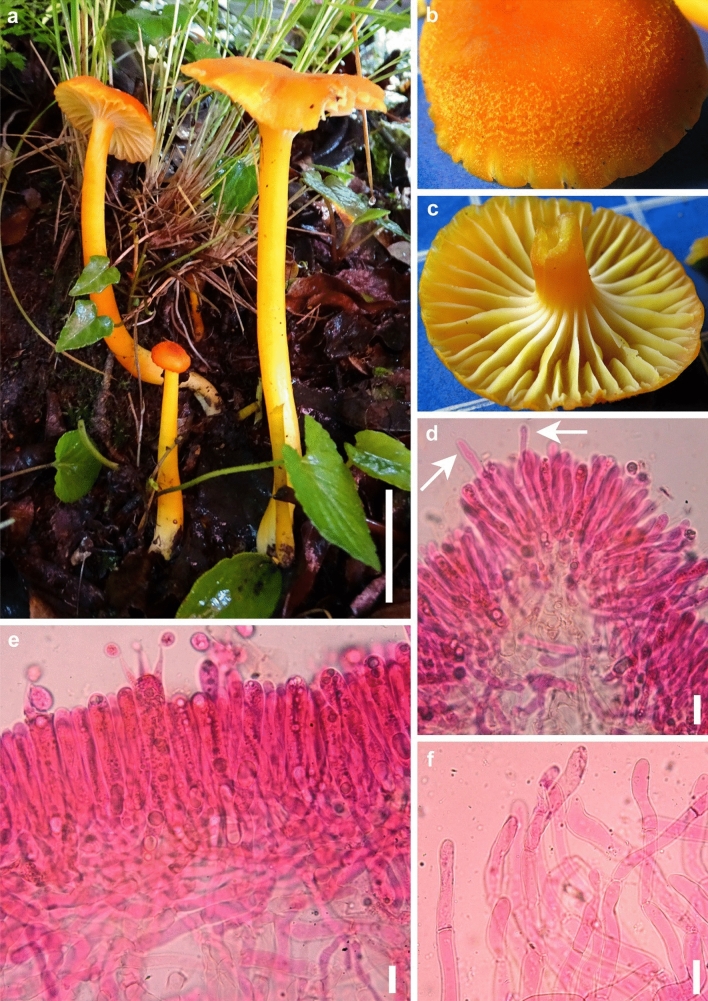
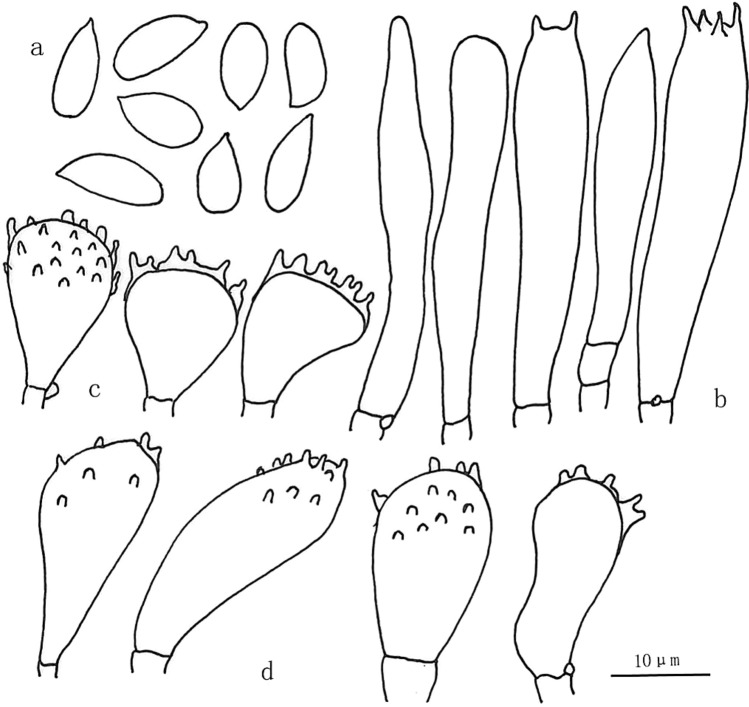
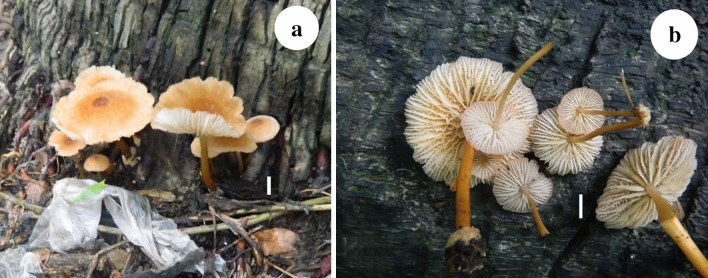
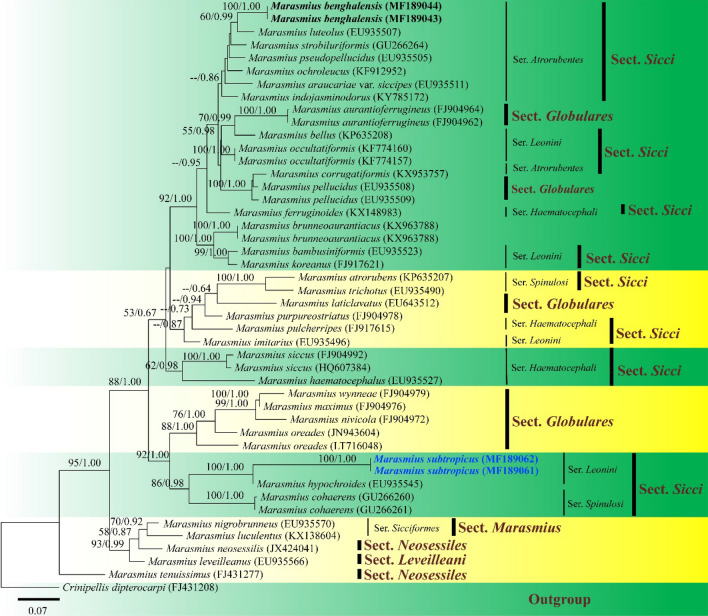
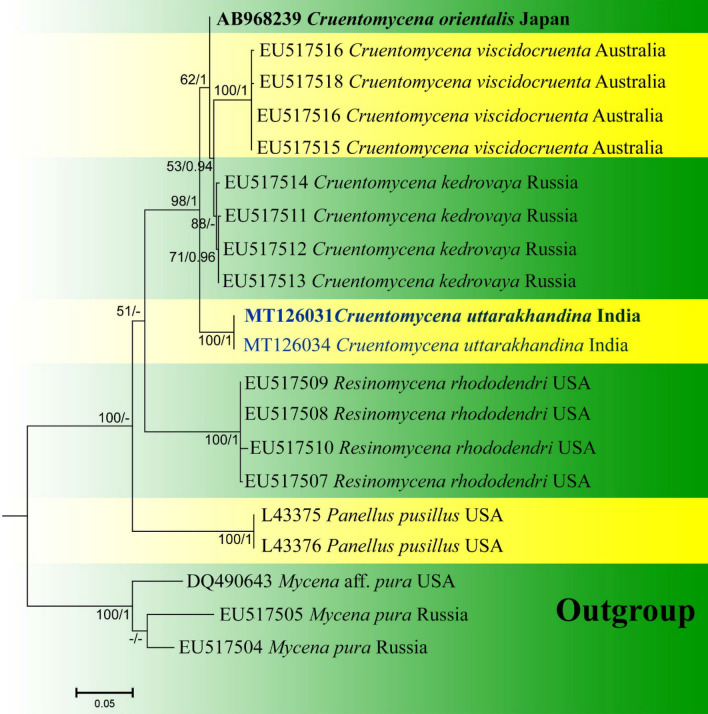
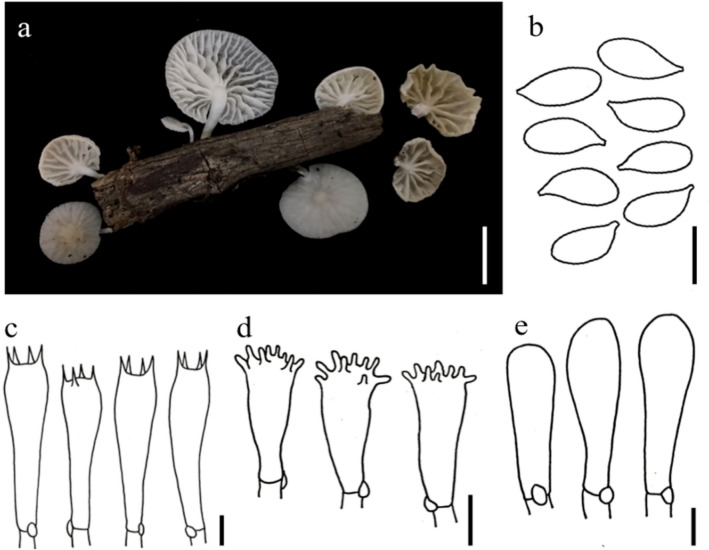
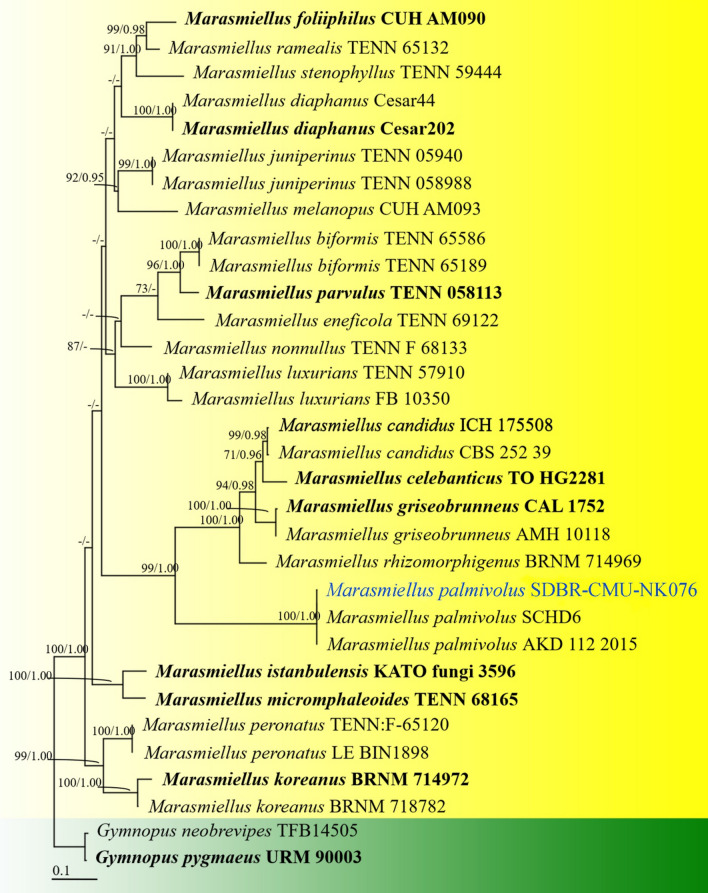
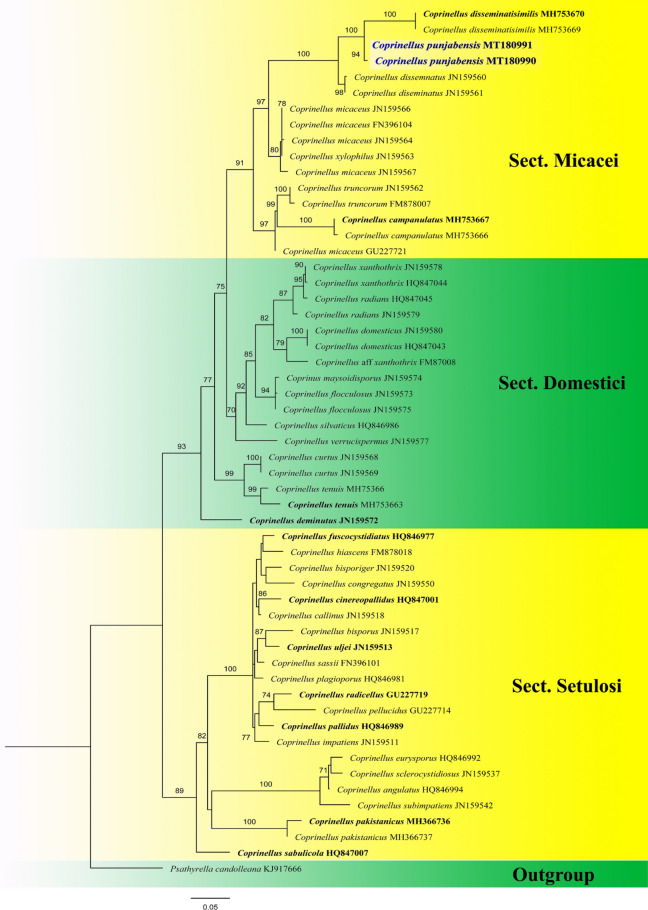
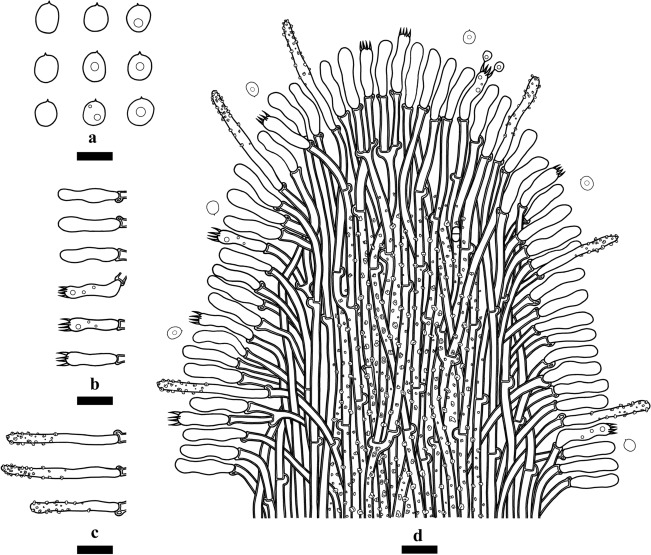
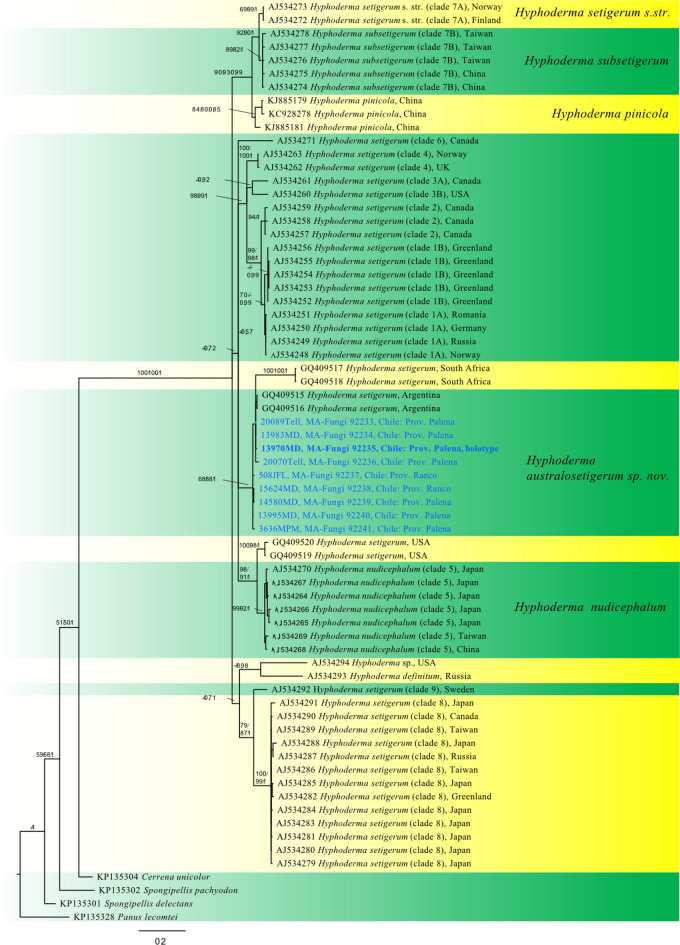
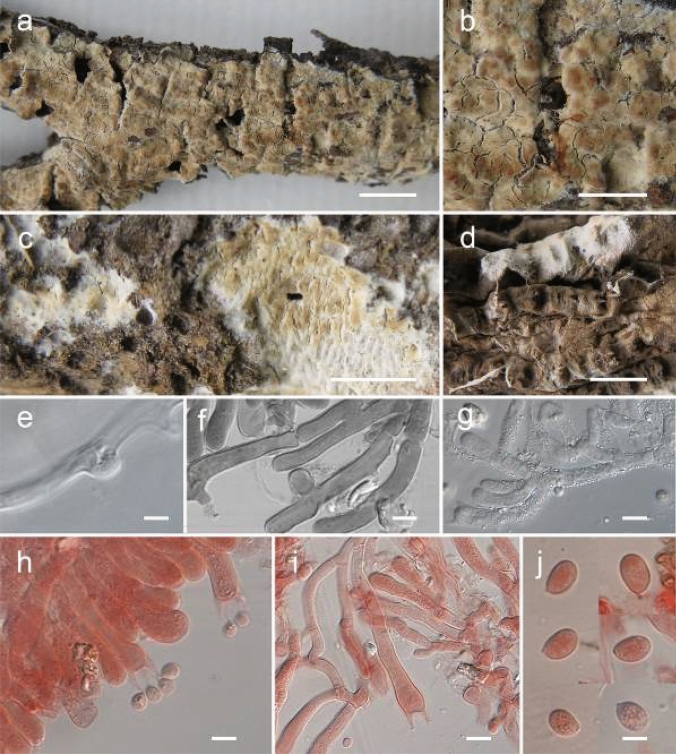
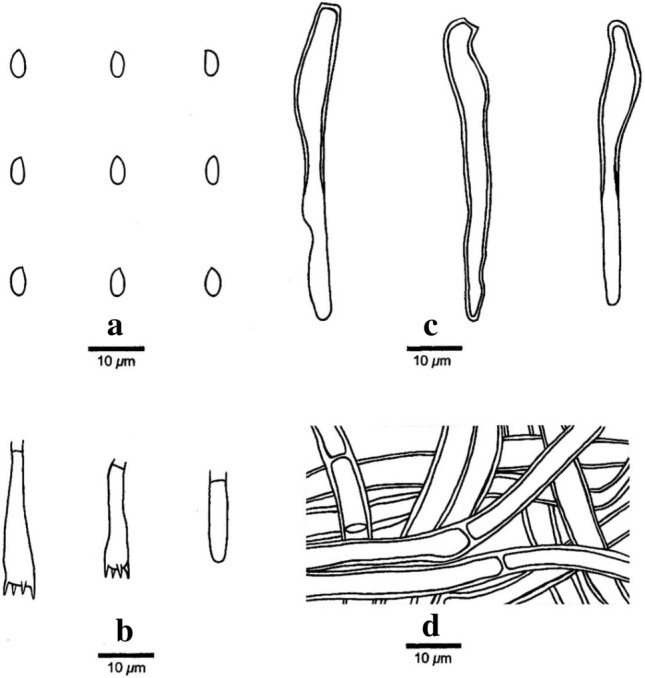
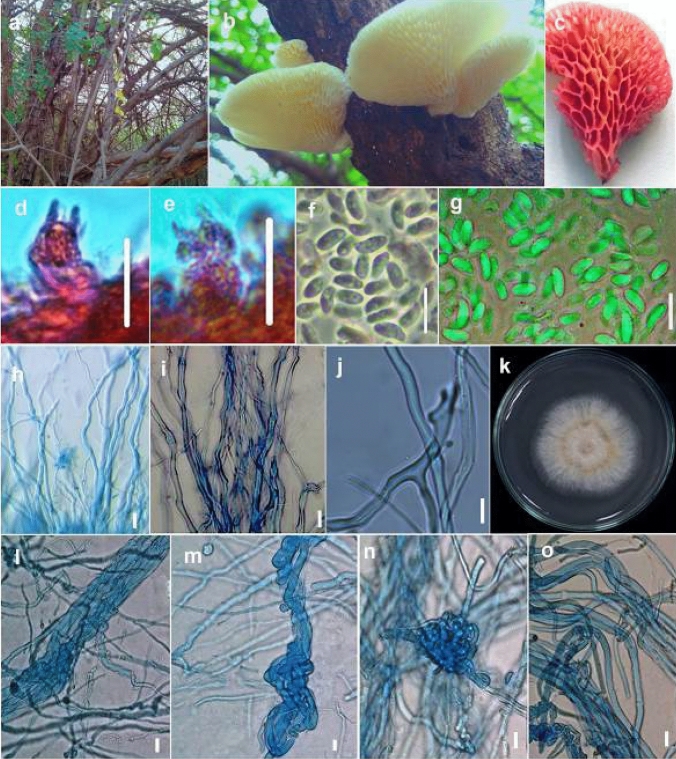
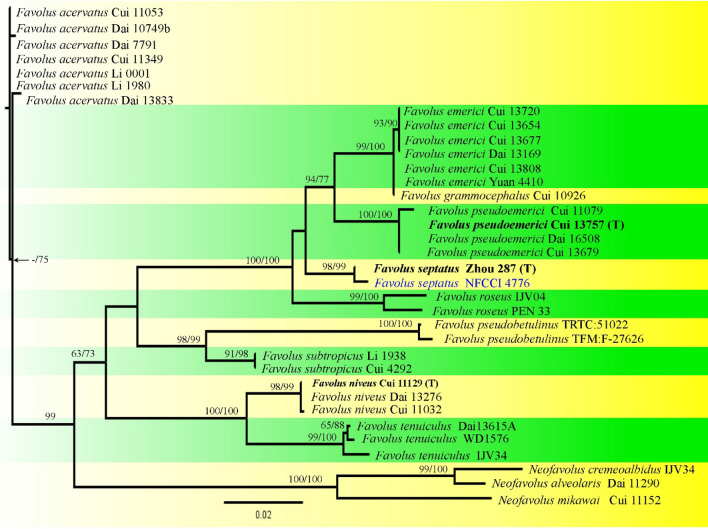
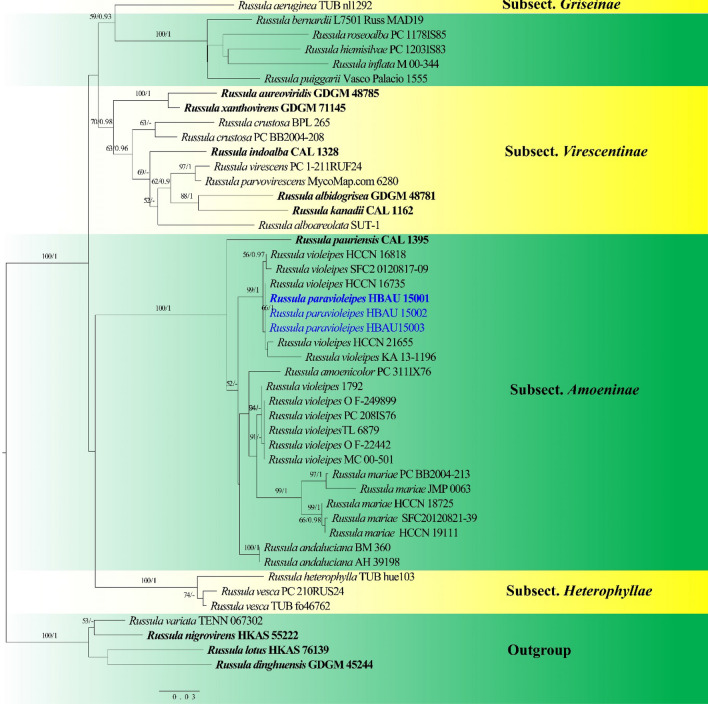
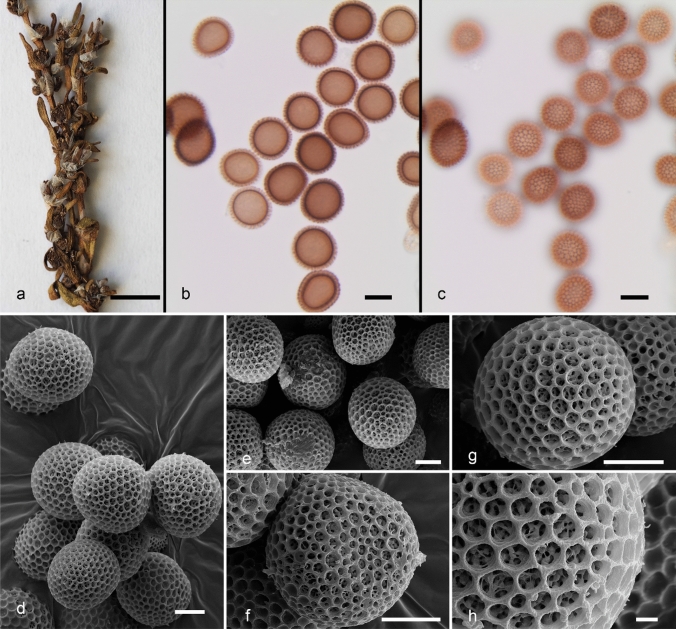
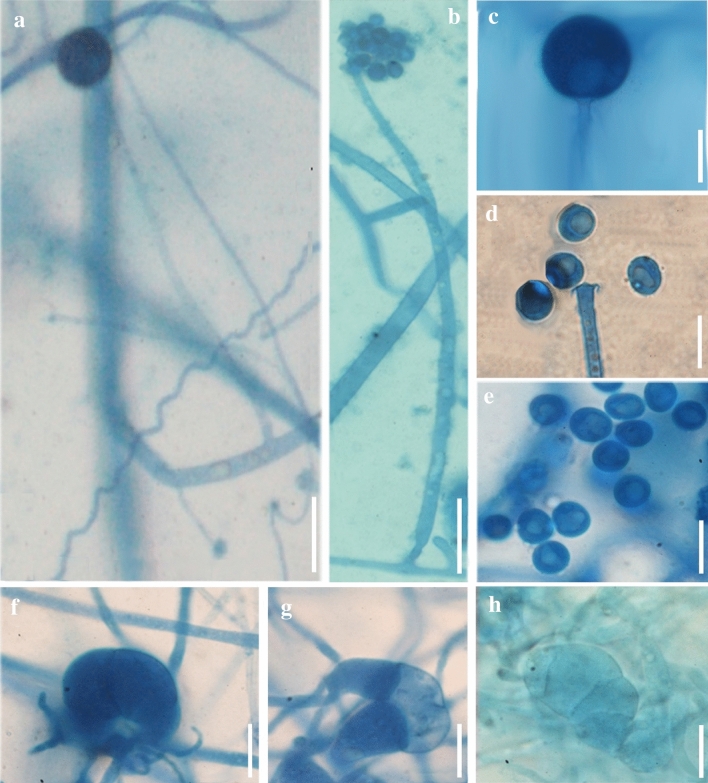
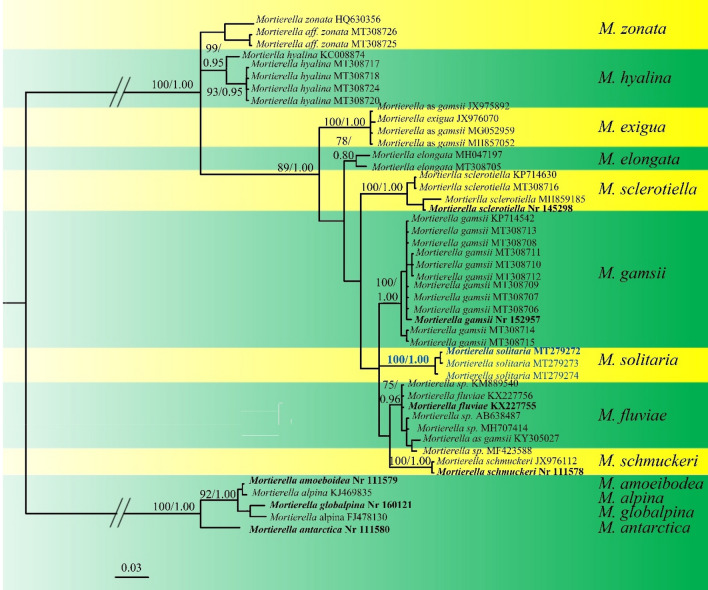
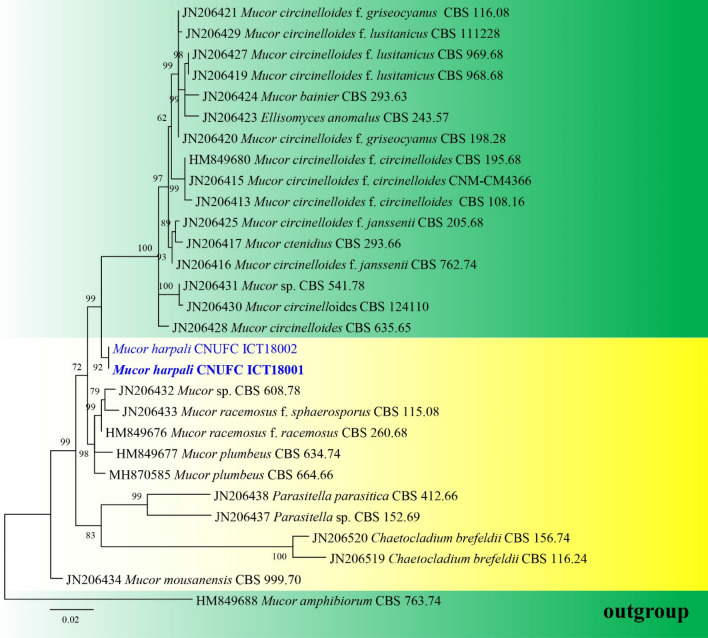
This article is the 13th contribution in the Fungal Diversity Notes series, wherein 125 taxa from four phyla, ten classes, 31 orders, 69 families, 92 genera and three genera incertae sedis are treated, demonstrating worldwide and geographic distribution. Fungal taxa described and illustrated in the present study include three new genera, 69 new species, one new combination, one reference specimen and 51 new records on new hosts and new geographical distributions. Three new genera, Cylindrotorula (Torulaceae), Scolecoleotia (Leotiales genus incertae sedis) and Xenovaginatispora (Lindomycetaceae) are introduced based on distinct phylogenetic lineages and unique morphologies. Newly described species are Aspergillus lannaensis, Cercophora dulciaquae, Cladophialophora aquatica, Coprinellus punjabensis, Cortinarius alutarius, C. mammillatus, C. quercoflocculosus, Coryneum fagi, Cruentomycena uttarakhandina, Cryptocoryneum rosae, Cyathus uniperidiolus, Cylindrotorula indica, Diaporthe chamaeropicola, Didymella azollae, Diplodia alanphillipsii, Dothiora coronicola, Efibula rodriguezarmasiae, Erysiphe salicicola, Fusarium queenslandicum, Geastrum gorgonicum, G. hansagiense, Helicosporium sexualis, Helminthosporium chiangraiensis, Hongkongmyces kokensis, Hydrophilomyces hydraenae, Hygrocybe boertmannii, Hyphoderma australosetigerum, Hyphodontia yunnanensis, Khaleijomyces umikazeana, Laboulbenia divisa, Laboulbenia triarthronis, Laccaria populina, Lactarius pallidozonarius, Lepidosphaeria strobelii, Longipedicellata megafusiformis, Lophiotrema lincangensis, Marasmius benghalensis, M. jinfoshanensis, M. subtropicus, Mariannaea camelliae, Melanographium smilaxii, Microbotryum polycnemoides, Mimeomyces digitatus, Minutisphaera thailandensis, Mortierella solitaria, Mucor harpali, Nigrograna jinghongensis, Odontia huanrenensis, O. parvispina, Paraconiothyrium ajrekarii, Parafuscosporella niloticus, Phaeocytostroma yomensis, Phaeoisaria synnematicus, Phanerochaete hainanensis, Pleopunctum thailandicum, Pleurotheciella dimorphospora, Pseudochaetosphaeronema chiangraiense, Pseudodactylaria albicolonia, Rhexoacrodictys nigrospora, Russula paravioleipes, Scolecoleotia eriocamporesi, Seriascoma honghense, Synandromyces makranczyi, Thyridaria aureobrunnea, Torula lancangjiangensis, Tubeufia longihelicospora, Wicklowia fusiformispora, Xenovaginatispora phichaiensis and Xylaria apiospora. One new combination, Pseudobactrodesmium stilboideus is proposed. A reference specimen of Comoclathris permunda is designated. New host or distribution records are provided for Acrocalymma fici, Aliquandostipite khaoyaiensis, Camarosporidiella laburni, Canalisporium caribense, Chaetoscutula juniperi, Chlorophyllum demangei, C. globosum, C. hortense, Cladophialophora abundans, Dendryphion hydei, Diaporthe foeniculina, D. pseudophoenicicola, D. pyracanthae, Dictyosporium pandanicola, Dyfrolomyces distoseptatus, Ernakulamia tanakae, Eutypa flavovirens, E. lata, Favolus septatus, Fusarium atrovinosum, F. clavum, Helicosporium luteosporum, Hermatomyces nabanheensis, Hermatomyces sphaericoides, Longipedicellata aquatica, Lophiostoma caudata, L. clematidis-vitalbae, Lophiotrema hydei, L. neoarundinaria, Marasmiellus palmivorus, Megacapitula villosa, Micropsalliota globocystis, M. gracilis, Montagnula thailandica, Neohelicosporium irregulare, N. parisporum, Paradictyoarthrinium diffractum, Phaeoisaria aquatica, Poaceascoma taiwanense, Saproamanita manicata, Spegazzinia camelliae, Submersispora variabilis, Thyronectria caudata, T. mackenziei, Tubeufia chiangmaiensis, T. roseohelicospora, Vaginatispora nypae, Wicklowia submersa, Xanthagaricus necopinatus and Xylaria haemorrhoidalis. The data presented herein are based on morphological examination of fresh specimens, coupled with analysis of phylogenetic sequence data to better integrate taxa into appropriate taxonomic ranks and infer their evolutionary relationships.

Keywords: 51 new records; 72 new taxa; Agaricomycetes; Ascomycota; Bartheletiomycetes; Basidiomycota; Dothideomycetes; Eurotiomycetes; Exobasidiomycetes; Laboulbeniomycetes; Leotiomycetes; Mortierellomycetes; Mortierellomycota; Mucoromycetes; Mucoromycota; One new combination; One reference specimen; Phylogeny; Sordariomycetes; Taxonomy.


Conflict of interest statement

Conflict of interestThe authors declare that they have no conflict of interest.

Figures

Fig. 1
Fig. 1
Diplodia alanphillipsii (IRAN 14273F, holotype). a Conidiomata on pine needles in culture. b Hyaline immature conidia developing on conidiogenous cells. c, d Conidiogenous cells with periclinal thickenings or annellations. e Brown aseptate conidia on conidiogenous cells. f Mature brown conidia. g, h Mature conidia in two different focal planes. Scale bars: a = 500 μm, bf = 5 μm, g, h = 10 μm
Fig. 2
Fig. 2
Phylogram generated Maximum parsimony analysis based on combined ITS and TEF1-α sequence data of Diplodia species. The tree is rooted with Lasiodiplodia theobromae (CBS 164.96). The scale bar represents the expected number of changes per site. The MP analysis resulted one of the 36 equally most parsimonious trees (TL = 246, CI = 0.87, HI = 0.13, RI = 0.83). Bootstrap values for maximum parsimony (MPBS, left) based on 1000 pseudoreplicates equal to or greater than 50% are indicated at the nodes and posterior probabilities from Bayesian analysis (BYPP, right) equal to or greater than 0.95 are indicated at the nodes. The isolates of new species characterized in this study are in blue bold
Fig. 3
Fig. 3
Chaetoscutula juniperi (MA-90552, new record). ad Ascomata on leaves of Juniperus phoenicea. e, f Ascomata immersed in water showing their hemispherical shape and their surface with dense, long and gnarled setae. g Peridium cells in surface view. h, n, o Setae. i, j, p Asci in several developmental stages. km, q, r Ascospores in several developmental stages. Scale bars: ad = 0.5 mm, e, f = 50 µm, gr = 10 µm
Fig. 4
Fig. 4
Phylogram depicting the evolutionary relationships of Chaetoscutula and related clades in Dissoconiaceae (Capnodiales) based on a three-locus dataset (ITS, LSU and SSU). Species sampling was based on Li et al. (2012). The alignment matrix consisted of 2220 bp and inferred substitution models were GTR + Γ (ITS1 + ITS2), K80 + I + Γ (5.8S, SSU), and GTR + I + Γ (LSU). The represented topology is obtained under a Bayesian framework with MrBayes v.3.2.6. Posterior Probabilities (PP) are represented on branches leading to nodes. Bootstrap support values obtained in a complementary Maximum Likelihood analysis (MLBS, right) with RAxML using 1000 pseudoreplicates are provided after the BYPP values (left). Branches in bold had MLBS equal or greater than 70% and BYPP equal or greater than 0.95. For each terminal, the species name and the voucher/herbarium code are indicated, and type strains are in bold and new isolate is in blue
Fig. 5
Fig. 5
Dothiora coronicola (MFLU 16-1110, holotype). a, b Ascomata on host surface. c Section through the ascoma. d Peridium. e, f Asci. g Ascospore. h Culture on PDA. Scale bars: c, d = 100 μm, e, f = 50 μm, g = 20 μm
Fig. 6
Fig. 6
Phylogram generated from maximum likelihood analysis based on combined LSU and ITS sequence data representing Dothiora coronicola (MFLUCC 17-1007) and related species. The scale bar indicates 0.01 changes. The tree is rooted to Dothidea sambuci (AFTOL-ID 274). Related sequences were taken from Hongsanan et al. (2020a). Twenty-two sequences are included in the analysis which comprise 1396 characters after alignment. The best RAxML tree with a final likelihood value of − 3690.034105 is presented. The matrix had 195 distinct alignment patterns, with 5.69% undetermined characters or gaps. Estimated base frequencies are as follows: A = 0.251756, C = 0.223630, G = 0.280088, T = 0.244526; substitution rates AC = 1.042605, AG = 2.446647, AT = 1.739048, CG = 0.584297, CT = 5.850014, GT = 1.000000; gamma distribution shape parameter α = 0.020014. Bootstrap values for maximum likelihood (MLBS) equal to or greater than 70% are indicated at the nodes. Type and ex-type strains are in bold and the newly generated sequence is in blue
Fig. 7
Fig. 7
Dyfrolomyces distoseptatus (MFLU 21-0121, new geographical record). a Vertical section of ascoma. b Peridium. c Pseudoparaphyses. dh Ascospores (Note: Asci thin walled and quickly evanescent, unable to observe). i Germinated ascospore. j, k Culture on MEA from surface and reverse. Scale bars: a = 200 μm, b = 100 μm, c = 20 μm, di = 10 μm
Fig. 8
Fig. 8
Phylogram generated from maximum likelihood analysis based on combined LSU, SSU and ITS sequence data representing the species of Dyfrolomycetales and Acrospermales. Related sequences are taken from Hongsanan et al. (2020b). Kirschsteiniothelia lignicola (MFLUCC 10-0036) and K. atra (AFTOL-ID 273) are used as the outgroup taxa. Twenty-one taxa are included in the combined analyses which comprised 3532 characters (1359 characters for LSU, 1669 characters for SSU, 504 characters for ITS) after alignment. The best scoring RAxML tree with a final likelihood value of − 10567.325091 is presented. The matrix had 700 distinct alignment patterns, with 44.47% of undetermined characters or gaps. Estimated base frequencies were as follows: A = 0.242587, C = 0.243215, G = 0.300854, T = 0.213344; substitution rates: AC = 1.335920, AG = 2.320033, AT = 0.575696, CG = 1.101975, CT = 5.314102, GT = 1.000000; gamma distribution shape parameter α = 0.248862. The MP analysis resulted a single most parsimonious tree (TL = 1145, CI = 0.851, RI = 0.803, RC = 0.683, HI = 0.149). Bootstrap support values for ML and MP equal to or greater than 70% and BYPP equal to or greater than 0.95 are given above the nodes. The newly generated sequence is in blue
Fig. 9
Fig. 9
Aliquandostipite khaoyaiensis (MFLU 21-0125, new record). a, b Ascomata superficial on host surface. c Peridium cells. d Pseudoparaphyses. e, f Asci. g Ascospores. Scale bars: a, b, e, f = 200 μm, c, g = 100 μm, d = 20 μm
Fig. 10
Fig. 10
Phylogram generated from maximum likelihood analysis based on combined LSU, SSU, ITS, TEF1-α and RPB2 sequence data representing the species of Aliquandostipite. Related sequences are taken from Suetrong et al. (2011). Jahnula sangamonensis (F81-1) and J. dianchia (KUMCC 17-0039) in Aliquandostipitaceae (Jahnulales) were used as the outgroup taxa. Fourteen taxa are included in the combined analyses which comprised 4306 characters (1006 characters for LSU, 1005 characters for SSU, 587 characters for ITS, 726 characters for TEF1-α, 982 characters for RPB2) after alignment. The best scoring RAxML tree with a final likelihood value of − 8403.913612 is presented. The matrix had 301 distinct alignment patterns, with 51.74% of undetermined characters or gaps. The MP analysis resulted a single most parsimonious tree (TL = 442, CI = 0.986, RI = 0.977, RC = 0.964, HI = 0.014). Bootstrap support values for ML and MP equal to or greater than 75% and BYPP equal to or greater than 0.95 are given above the nodes. The newly generated sequence is in blue
Fig. 11
Fig. 11
Minutisphaera thailandensis (MFLU 21-0094, holotype). a, b Ascomata on submerged wood. c, d Squash of ascoma. eh Asci. in Ascospores. o Culture on PDA. Scale bars: c, d = 50 μm, eh = 20 μm, in = 10 μm
Fig. 12
Fig. 12
Phylogram generated from maximum likelihood analysis based on combined LSU, SSU and ITS sequence data representing the species of Minutisphaera in Minutisphaeraceae. Myrmaecium rubricosum CBS139067 and M. rubrum CBS109505 are selected as the outgroup taxa. The best RAxML tree with a final likelihood value of − 17637.597976 is presented. RAxML analysis yielded 1292 distinct alignment patterns and 38.19% of undetermined characters or gaps. Estimated base frequencies were as follows: A = 0.254974, C = 0.223826, G = 0.282377, T = 0.238823, with substitution rates AC = 1.255015, AG = 2.734543, AT = 1.149276, CG = 1.117855, CT = 6.544858, GT = 1.000000; gamma distribution shape parameter alpha = 0.206169. Bootstrap support values for maximum likelihood (MLBS, left) equal to or greater than 70% is given above the nodes. Bayesian posterior probabilities (BYPP, right) equal to or greater than 0.95 are given above the nodes. Ex-type strains are in bold and newly generated sequence is in blue
Fig. 13
Fig. 13
Acrocalymma fici (MFLU 21-0124, new habitat and geographical record). a, b Appearance of erumpent fruiting bodies on host substrate. c Section through conidioma. d Section through pycnidial wall. e, f Immature and mature conidia attached to conidiogenous cells. gj Conidium. k Germinated conidium l, m Culture on MEA (upper and lower view). Scale bars: a = 500 μm, b = 200 μm, c = 100 μm, d, f, hk = 10 μm, e = 5 μm, g = 20 μm
Fig. 14
Fig. 14
Phylogenetic tree generated from maximum likelihood (ML) analysis based on combined LSU and ITS sequence data for the species from Acrocalymmaceae. Boeremia exigua (CBS 431.74) and Boeremia foveata (CBS 341.67) are used as the outgroup taxa. The dataset comprised 1997 characters after alignment including gaps (LSU = 1308 bp and ITS = 689 bp). The RAxML analysis of the combined dataset yielded a best scoring tree with a final ML optimization likelihood value of − 4737.006546. The matrix had 316 distinct alignment patterns, with 31.82% of undetermined characters or gaps. Estimated base frequencies were as follows: A = 0.245559, C = 0.218996, G = 0.276710, T = 0.258736; substitution rates: AC = 1.502433, AG = 1.688434, AT = 1.833814, CG = 0.473416, CT = 4.863789, GT = 1.000000; gamma distribution shape parameter α = 0.020000. The MP analysis resulted a single most parsimonious tree (TL = 391, CI = 0.831, RI = 0.875, RC = 0.727, HI = 0.169). Bootstrap support values for MLBS and MPBS equal to or greater than 75% BYPP equal to or greater than 0.95 are given above the nodes. Ex-type strains are in bold and newly generated sequence is in blue
Fig. 15
Fig. 15
Dictyosporium pandanicola (MFLU 20-0425, new record). ac Colonies on wood. dh Conidiophores, conidiogenous cells and conidia. ij, ln Conidia. k Conidiophores. o Germinated conidia. p Mycelium. q, r Culture on MEA (upper and lower view). Scale bars: di, kp = 20 μm, k = 10 μm
Fig. 16
Fig. 16
Phylogenetic tree generated from maximum likelihood (ML) analysis based on combined LSU, ITS and TEF1-α sequence data for the species from Melanommataceae. Periconia igniaria (CBS 379.86 and CBS 845.96) are used as the outgroup taxa. The dataset comprised 2694 characters after alignment including gaps (LSU = 1245 bp; ITS = 537 bp, TEF1-α = 912 bp and RPB2 = 1006 bp). The RAxML analysis of the combined dataset yielded a best scoring tree with a final ML optimization likelihood value of − 14912.416315. The matrix had 871 distinct alignment patterns, with 36.52% undetermined characters or gaps. Estimated base frequencies were as follows: A = 0.239281, C = 0.249660, G = 0.270492, T = 0.240568; substitution rates AC = 1.684833, AG = 3.636355, AT = 2.551537, CG = 0.785971, CT = 9.189334, GT = 1.000000; gamma distribution shape parameter α = 0.180969. Support values for maximum likelihood (MLBS) above than 75% and Bayesian posterior probabilities (BYPP) greater than 0.95 are given at the nodes. Ex-type strains are in bold and newly generated sequence is in blue
Fig. 17
Fig. 17
Camarosporidiella laburni (TASM 6162, new record). ac Appearance of ascomata on host surface. d Longitudinal section of an ascoma. e Section of the peridium. f Pseudoparaphyses. gi Asci. jo Ascospores. Scale bars: d = 100 μm, e = 50 μm, f = 5 μm, gi = 20 μm, jo = 10 μm
Fig. 18
Fig. 18
Phylogram generated from the best scoring of the RAxML tree based on combined SSU, LSU, ITS, and TEF1-α sequence dataset to indicate Camarosporidiella and related species. Fifty-two strains are included in the combined analyses which comprise a total of 3309 characters. Staurosphaeria rhamnicola (MFLUCC 17-0813 and MFLUCC 17-0814) is selected as the outgroup taxon. The best RAxML tree with a final likelihood value of − 6629.415262 is presented. RAxML analysis yielded 226 distinct alignment patterns and 5.73% of undetermined characters or gaps. Estimated base frequencies were as follows: A = 0.240666, C = 0.244239, G = 0.266553, T = 0.248542, with substitution rates AC = 1.544599, AG = 4.613774, AT = 3.7595, CG = 0.783994, CT = 9.045003, GT = 1.000000; gamma distribution shape parameter alpha = 0.997372. Bootstrap support values for maximum likelihood (MLBS, left) equal to or greater than 70% is given above the nodes. Ex-type strains are in bold and newly generated sequences are in blue
Fig. 19
Fig. 19
Cryptocoryneum rosae (KUN-HKAS 115780, holotype). ac Appearance of sporodochia on host surface. d–g Conidia. h Germinated conidium. i, j Culture on PDA from surface and reverse. Scale bars: d = 30 μm, e, f, h = 20 μm, g = 15 μm, i, j = 3 cm
Fig. 20
Fig. 20
Phylogram generated from the best scoring of the RAxML tree based on combined SSU, LSU, ITS, TEF1-α and RPB2 sequence dataset to indicate the new species in Cryptocoryneaceae. Sixty strains are included in the combined analyses which comprise a total of 4357 characters. Murilentithecium clematidis (MFLUCC 14-0561 and MFLUCC 14-0562) is selected as the outgroup taxon. The best RAxML tree with a final likelihood value of − 24211.323363 is presented. RAxML analysis yielded 1272 distinct alignment patterns and 6.17% of undetermined characters or gaps. Estimated base frequencies were as follows: A = 0.246394, C = 0.256619, G = 0.267068, T = 0.229919, with substitution rates AC = 1.576531, AG = 4.38051, AT = 1.49611, CG = 1.339907, CT = 10.502267, GT = 1.000000; gamma distribution shape parameter alpha = 0.450773. Bootstrap support values for maximum likelihood (MLBS, left) equal to or greater than 70% is given above the nodes. Ex-type strains are in bold and newly generated sequences are in blue
Fig. 21
Fig. 21
Didymella azollae (IRAN 18020 F, holotype). a Pycnidia on host. b Pycnidia. c Pycnidial wall. d Conidiogenous cells. e Conidia. Scale bars: be = 10 μm
Fig. 22
Fig. 22
Didymella azollae (IRAN 3058C, ex-type culture) cultures after 7 days at 25 °C on different media. a PDA. b OA. c MEA
Fig. 23
Fig. 23
Maximum Likelihood tree inferred by MEGA v.7 from the combined ITS, LSU, and TUB gene regions of 92 isolates. Bootstrap support values from ML equal to or greater than 90% are provided above or below the branches. Ex-type strains are in bold and novel species is shown in blue
Fig. 23
Fig. 23
Maximum Likelihood tree inferred by MEGA v.7 from the combined ITS, LSU, and TUB gene regions of 92 isolates. Bootstrap support values from ML equal to or greater than 90% are provided above or below the branches. Ex-type strains are in bold and novel species is shown in blue
Fig. 24
Fig. 24
Montagnula thailandica (MFLU 21-0052, new record). a, b Appearance of ascomata on woody substrate. c Section of ascoma through ostiole. d Section of ostiole. e Peridium. f Pseudoparaphyses. gk Immature and mature asci. ln Ascospores. o Germinated ascospore. p, q Culture on PDA from surface and reverse. Scale bars: c = 200 µm, d, e = 100 µm, fk = 50 µm, ln = 10 µm, o = 20 µm
Fig. 25
Fig. 25
Phylogram generated from maximum likelihood analysis based on combined LSU, ITS, SSU and TEF1-α sequence data of Montagnula taxa. The tree is rooted with Pleospora herbarum (MFLUCC 13-0344). Bootstrap support values for maximum likelihood (MLBS, left) equal to or greater than 70% is given above the nodes. Bayesian posterior probabilities (BYPP, right) equal to or greater than 0.95 are given above the nodes. Ex-type strains are in bold and newly generated sequence is in blue
Fig. 26
Fig. 26
Paraconiothyrium ajrekarii (AMH 10218, holotype). ac Colonies from surface on various media after 2 weeks; a MEA, b V8 juice agar, c Czapek Dox agar. d Conidiomata. e, f Enlarged view of conidiomata. g, h Conidiogenous cells showing distinct collarette rings. i, j Condiogenous cells bearing developing conidia. k Chlamydospores. l Conidia. Scale bars: df = 100 µm, gl = 10 µm
Fig. 27
Fig. 27
Molecular phylogenetic analysis by maximum-likelihood (ML) method based on combined β-tubulin, LSU and ITS sequence data. Statistical supports are indicated next to each node, non-parametric maximum likelihood ultrafast-bootstrap (UFBS) values and SH-aLRT obtained from 1000 replicates using IQ-TREE and the TIM3 + F + I + G4 model. Bootstrap values for maximum likelihood (MLBS) equal to or greater than 50% are labeled on the nodes. Twenty-one strains are included in the combined analyses which comprise 2393 sites of which 2089 were found to be conserved, 286 were the variable sites and included nearly 178 parsimony-informative sites. The optimized log-likelihood values of − 5846.542 is presented. Estimated base frequencies are as follows: A = 0.300, C = 0.183, G = 0.205, T = 0.312; substitution rates AC = 2.10979, AG = 3.70012, AT = 1.00000, CG = 2.10979, CT = 8.84516, GT = 1.00000; gamma distribution shape parameter α = 0.559. New sequence data of Paraconiothyrium ajrekarii (AMH 10,218; NFCCI 4810) is highlighted in blue bold and all sequences from type specimen is in bold
Fig. 28
Fig. 28
Spegazzinia camelliae (MFLU 21-0053, new record). a Colonies on wood substrate. b, c Conidiophores and conidiogenous cells. dh Conidia. i Germinated conidium. j, k Culture on PDA from surface and reverse at 1 month. lr Conidia developing in culture. Scale bars: bc, i, l = 20 µm, df, np = 5 µm, gh, m, qr = 10 µm
Fig. 29
Fig. 29
Phylogram generated from maximum likelihood analysis based on combined LSU, ITS and TEF1-α sequence data of Spegazzinia taxa. Verrucoconiothyrium nitidae (CPC1532 and CPC25373) are selected as the outgroup taxa. Bootstrap support values for maximum likelihood (MLBS, left) equal to or greater than 70% is given above the nodes. Bayesian posterior probabilities (BYPP, right) equal to or greater than 0.95 are given above the nodes. Ex-type strains are in bold and newly generated sequence is in blue
Fig. 30
Fig. 30
Hermatomyces nabanheensis (MFLU 21-0025, new record). a Host. b, c Colonies on substrate. d Mycelium. eg Conidia with conidiogenous cells. h, i Cylindrical conidia. jl Lenticular conidia. m Germinated conidium. n, o Culture on PDA from above and below. Scale bars: b = 1000 μm, c = 200 μm, dm = 20 μm
Fig. 31
Fig. 31
Hermatomyces sphaericoides (MFLU 21-0054, new record). a, b Colonies on the natural substrate. ce Conidiogenous cells. fi Conidia. j Germinated conidium. k, l Culture on PDA from surface and reverse at 1 month. Scale bars: ce, j = 20 μm, fi = 10 μm
Fig. 32
Fig. 32
Phylogram generated from maximum likelihood analysis based on combined ITS, LSU and TEF1-α sequence data of Hermatomyces taxa (Hermatomycetaceae) and closely related families Aquasubmersaceae and Anteagloniaceae. Elsinoe centrolobi CBS 222.50 and E. veneta CBS 150.27 are selected as the outgroup taxa. Bootstrap support values for maximum likelihood (MLBS, left) equal to or greater than 70% is given above or below the nodes. Bayesian posterior probabilities (BYPP, right) equal to or greater than 0.95 are given above the nodes. Ex-type strains are in bold and newly generated sequences are in blue
Fig. 33
Fig. 33
Poaceascoma taiwanense (MFLU 21-0055, new record). a Ascomata immersed, aggregated, erumpent on the dead wood. b Longitudinal sections of ascomata. c Peridium. d Pseudoparaphyses. eh Asci. in Ascospores. o Germinated ascospore. p, q Culture on MEA from surface and reverse at 1 month. Scale bars: b = 50 μm, cn = 20 μm, o = 30 μm
Fig. 34
Fig. 34
Phylogram generated from maximum likelihood analysis based on combined LSU, TEF1-α, SSU and ITS sequence data of Poaceascoma taxa and related genera in Lentitheciaceae. Massarina cisti CBS 266.62 and M. eburnea CBS 473.64 are selected as the outgroup taxa. Bootstrap support values for maximum likelihood (MLBS, left) equal to or greater than 70% is given above the nodes. Bayesian posterior probabilities (BYPP, right) equal to or greater than 0.95 are given above the nodes. Ex-type strains are in bold and newly generated sequence is in blue
Fig. 35
Fig. 35
Hongkongmyces kokensis (MFLU 21-0056, holotype). a, b Appearance of conidiomata on submerged decaying wood substrate. c, d Section through conidiomata. e Section of conidioma wall. fh Conidiogenous cells and conidia. i, j Conidia. k Germinated conidium. l, m Culture on PDA (l = from above, m = from below). Scale bars: c = 50 µm, d = 200 µm, e, g, h = 20 µm, f, i, k = 10 µm, j = 5 µm
Fig. 36
Fig. 36
Xenovaginatispora phichaiensis (MFLU 21-0059, holotype). a Appearance of ascomata. b Longitudinal sections of ascomata. c Ascomata with ostiole. d Pseudoparaphyses. eg Asci. h, i Ascospores surrounded by mucilaginous sheath and distinct apical appendages. j Germinated ascospore. k, l Culture on MEA at 1 month (k = from surface and l = reverse). Scale bars: b = 100 μm, c, d = 50 μm, eg, j = 20 μm, hi = 10 μm
Fig. 37
Fig. 37
Phylogram generated from maximum likelihood analysis based on combined LSU, SSU, ITS, and TEF1-α sequence data of new species and new genus in Lindgomycetaceae. Astrosphaeriella neofusispora MFLUCC 11-0161 and A. fusispora MFLUCC 10-0555 are selected as the outgroup taxa. Bootstrap support values for maximum likelihood (MLBS, left) equal to or greater than 70% is given above the nodes. Bayesian posterior probabilities (BYPP, right) equal to or greater than 0.95 are given above the nodes. Ex-type strains are in bold and newly generated sequences are in blue
Fig. 38
Fig. 38
Longipedicellata aquatica (MFLU 21-0060, new record). a Appearance of ascomata on submerged wood. b Section through ascomata. c Section of peridium. d Pseudoparaphyses. eh Asci. in Ascospores. o Ascospore stained in Nigrosin. p Ascospore stained in Indian Ink. q Geminated ascospore. r, s Culture on MEA (r = from above, s = from below). Scale bars: b = 50 μm, ch, q = 20 μm, ip = 10 μm
Fig. 39
Fig. 39
Longipedicellata megafusiformis (MFLU 21-0062, holotype). a, b Appearance of ascomata on decaying submerged wood substrate. c Section through ascoma. d Section of peridium. e Pseudoparaphyses. f, g Asci. h–k Ascospores. l Ascospores stained in Indian Ink showing a mucilaginous sheath. m, n Culture on PDA (m = from above, n = from below). Scale bars: c = 100 μm, bg = 20 μm, hl = 10 μm
Fig. 40
Fig. 40
Submersispora variabilis (MFLU 21-0063, new record). a, b Appearance of fungal colonies on woody substrate. ce Conidiophores with conidia. f, g Close up of conidia. h, i Culture on PDA from surface and reverse. Scale bars: ce = 20 μm, fg = 10 μm
Fig. 41
Fig. 41
Phylogram generated from maximum likelihood analysis based on combined LSU, ITS, TEF1-α and SSU sequence data of genera in Longipedicellataceae. The tree is rooted with Bambusicola bambusae (MFLUCC 11-0614). Bootstrap support values for maximum likelihood (MLBS, left) equal to or greater than 70% is given above the nodes. Bayesian posterior probabilities (BYPP, right) equal to or greater than 0.95 are given above the nodes. Ex-type strains are in bold and newly generated sequences are in blue
Fig. 42
Fig. 42
Lophiostoma caudatum (TASM 6156, new host and geographical record). a, b Appearance of ascomata on host surface. c Vertical section of ascoma. d Ostiolar canal. e Peridium. f Pseudoparaphyses. gi Asci. jm Ascospores. Scale bars: c, d = 50 µm, ei = 20 µm, jm = 10 µm
Fig. 43
Fig. 43
Lophiostoma clematidis-vitalbae (TASM 6157, new host and geographical record). ac Appearance of ascomata on host surface. d Vertical section of ascoma. e Ostiolar canal. f Periphyses at ostiole. g Pseudoparaphyses. h Peridium. im Asci. nq Ascospores. Scale bars: d, e = 100 µm, fh = 50 µm, im = 20 µm, nq = 10 µm
Fig. 44
Fig. 44
Phylogram generated from maximum likelihood analysis based on combined SSU, LSU, ITS, TEF1-α and RPB2 sequence data for Lophiostomataceae. One hundred twelve strains are included in the combined analyses which comprise a total of 4199 characters. Teichospora rubriostiolata TR7 and Teichospora trabicola C134 are selected as the outgroup taxa. The best RAxML tree with a final likelihood value of − 30611.078207 is presented. RAxML analysis yielded 1567 distinct alignment patterns and 25.77% of undetermined characters or gaps. Estimated base frequencies were as follows: A = 0.248812, C = 0.247504, G = 0.267733, T = 0.235951, with substitution rates AC = 1.717311, AG = 4.965346, AT = 1.578028, CG = 1.454739, CT = 10.722777, GT = 1.000000; gamma distribution shape parameter alpha = 0.639152. Support values for maximum likelihood (MLBS, left) greater than 70% and Bayesian posterior probabilities (BYPP, right) greater than 0.90 are given at the nodes. Ex-type strains are in bold and newly generated sequences are in blue
Fig. 44
Fig. 44
Phylogram generated from maximum likelihood analysis based on combined SSU, LSU, ITS, TEF1-α and RPB2 sequence data for Lophiostomataceae. One hundred twelve strains are included in the combined analyses which comprise a total of 4199 characters. Teichospora rubriostiolata TR7 and Teichospora trabicola C134 are selected as the outgroup taxa. The best RAxML tree with a final likelihood value of − 30611.078207 is presented. RAxML analysis yielded 1567 distinct alignment patterns and 25.77% of undetermined characters or gaps. Estimated base frequencies were as follows: A = 0.248812, C = 0.247504, G = 0.267733, T = 0.235951, with substitution rates AC = 1.717311, AG = 4.965346, AT = 1.578028, CG = 1.454739, CT = 10.722777, GT = 1.000000; gamma distribution shape parameter alpha = 0.639152. Support values for maximum likelihood (MLBS, left) greater than 70% and Bayesian posterior probabilities (BYPP, right) greater than 0.90 are given at the nodes. Ex-type strains are in bold and newly generated sequences are in blue
Fig. 45
Fig. 45
Vaginatispora nypae (MFLU 20-0424, new record). ac Ascomata on submerged wood. d Section of ascoma. e Ostiolar canal. f Peridium. g Pseudoparaphyses. hl Asci. mp Ascospore. q, r Culture on MEA from upper and lower views. Scale bars: a = 1000 μm, b, c = 200 μm, d = 100 μm, e, f = 50 μm, gl = 20 μm, mp = 15 μm
Fig. 46
Fig. 46
Phylogenetic tree generated from maximum likelihood (ML) analysis based on combined LSU, SSU, ITS, TEF1-α and RPB2 sequence data for the species from Melanommataceae. Teichospora trabicola (C 134E) and T. rubriostiolata (TR 7) are used as the outgroup taxa. The dataset comprised 4379 characters after alignment including gaps (LSU = 883 bp, SSU = 966 bp, ITS = 523 bp, TEF1-α = 1001 bp and RPB2 = 1006 bp). The RAxML analysis of the combined dataset yielded a best scoring tree with a final ML optimization likelihood value of − 26352.113239. The matrix had 1530 distinct alignment patterns, with 26.20% undetermined characters or gaps. Estimated base frequencies were as follows: A = 0.248486, C = 0.247993, G = 0.267004, T = 0.236517; substitution rates AC = 1.626883, AG = 4.007531, AT = 1.289884, CG = 1.323552, CT = 8.595651, GT = 1.000000; gamma distribution shape parameter α = 0.180969. Support values for maximum likelihood (MLBS, left) above than 75% and Bayesian posterior probabilities (BYPP, right) greater than 0.95 are given at the nodes. Ex-type strains are in bold and newly generated sequence is in blue
Fig. 47
Fig. 47
Lophiotrema hydei (HKAS 115782, new host record). a, b Appearance of ascomata on host surface. c Longitudinal section of an ascoma. d Section of the peridium cells. e Pseudoparaphyses. fj Asci. ko Ascospores. p, q Culture characteristic on PDA (p = from above, q = from below). Scale bars: c = 100 μm, d, fj = 20 μm, e = 5 μm, ko = 10 μm, p, q = 10 mm
Fig. 48
Fig. 48
Lophiotrema lincangensis (HKAS 115777, holotype). a, b Appearance of ascomata on host surface. c Longitudinal section of an ascoma. d Section of the peridium. e Pseudoparaphyses. fi Asci. jo Ascospores. p Germinated ascospore. q, r Culture characteristic on PDA (q = from above, r = from below). Scale bars: c = 100 μm, d, fi = 20 μm, e = 5 μm, jp = 10 μm, q, r = 10 mm
Fig. 49
Fig. 49
Lophiotrema neoarundinariae (HKAS 115779, new record). a, b Appearance of ascomata on host surface. c Longitudinal section of an ascoma. d Section of peridium and papillate. e Pseudoparaphyses. fi Asci. jo Ascospores. p, q Culture characteristic on PDA (p = from above, q = from below). Scale bars: c = 100 μm, d, hi = 20 μm, e = 5 μm, jo = 10 μm, p, q = 10 mm
Fig. 50
Fig. 50
Phylogram generated from maximum likelihood analysis based on combined SSU, LSU, ITS, TEF1-α and RPB2 sequence data to indicate the newly generated strains in Lophiotremataceae. Sixty strains are included in the combined analyses which comprise a total of 4357 characters. Murilentithecium clematidis (MFLUCC 14-0561 and MFLUCC 14-0562) is selected as the outgroup taxon. The best RAxML tree with a final likelihood value of − 24211.323363 is presented. RAxML analysis yielded 1272 distinct alignment patterns and 6.17% of undetermined characters or gaps. Estimated base frequencies were as follows: A = 0.246394, C = 0.256619, G = 0.267068, T = 0.229919, with substitution rates AC = 1.576531, AG = 4.38051, AT = 1.49611, CG = 1.339907, CT = 10.502267, GT = 1.000000; gamma distribution shape parameter alpha = 0.450773. Bootstrap support values for maximum likelihood (MLBS, left) equal to or greater than 70% is given above the nodes. Ex-type strains are in bold and newly generated sequences are in blue
Fig. 51
Fig. 51
Pseudochaetosphaeronema chiangraiense (MFLU 21-0083, holotype). a, b Appearance of ascostromata on host substrate. c Longitudinal section of ascomata. d Peridium e Pseudoparaphyses. fi Asci. jl Ascospores. m Germinated ascospore. n, o Cultures on PDA from surface and reverse. Scale bars: Scale bars: a = 500 μm, b = 200 μm, c = 100 μm, m = 50 μm, ek = 20 μm, d, l = 10 μm
Fig. 52
Fig. 52
Phylogram generated from maximum likelihood analysis based on combined LSU, SSU, ITS and TEF1-α sequence data representing suborder Massarineae in Pleosporales. Related sequences are taken from Hyde et al. (2020b) and additions according to the BLAST searches in NCBI. Fifty-eight strains are included in the combined analyses which comprised 3070 characters (798 characters for LSU, 961 characters for SSU, 469 characters for ITS, 842 characters for TEF1-α) after alignment. Alternaria alternata (CBS 916.96) and Leptosphaeria doliolum (CBS 505.75) in Pleosporaceae and Leptosphaeriaceae respectively (Pleosporales) were used as the outgroup taxa. The best scoring RAxML tree with a final likelihood value of − 18300.642497 is presented. The matrix had 1007 distinct alignment patterns, with 36.82% of undetermined characters or gaps. Estimated base frequencies were as follows: A = 0.240587, C = 0.242773, G = 0.272823, T = 0.243817; substitution rates: AC = 1.614921, AG = 3.258874, AT = 1.951323, CG = 1.249772, CT = 8.508461, GT = 1.000000; gamma distribution shape parameter α = 0.183977. Bootstrap support values for ML equal to or greater than 75% are given above the nodes (left side). Bayesian posterior probabilities (BYPP) equal to or greater than 0.95 are given above the nodes (right side). Ex-type strains are in bold and newly generated sequence is in blue bold
Fig. 53
Fig. 53
Helminthosporium chiangraiense (MFLU 21-0064, holotype). a Colonies on natural substrate. b Punctiform conidioma. c Cross section of conidioma. d Cross section of conidioma cells. e Conidiophores. f Conidiophore with attached conidium. gl Conidia. m Germinated conidium. n, o Culture on PDA from surface and reverse. Scale bars: a = 500 µm, b = 200 µm, c, e = 100 µm, d, fm = 50 µm
Fig. 54
Fig. 54
Phylogram generated from maximum likelihood analysis based on combined LSU, SSU and ITS sequence data of Helminthosporium taxa (Massarinaceae) and related families. Seventy-seven strains are included in the combined analyses which comprise a total of 2567 characters. Cyclothyriella rubronotata (TR and TR9) are selected as the outgroup taxa. The best RAxML tree with a final likelihood value of − 11885.302979 is presented. RAxML analysis yielded 713 distinct alignment patterns and 23.08% of undetermined characters or gaps. Estimated base frequencies were as follows: A = 0.246572, C = 0.227244, G = 0.274051, T = 0.252133, with substitution rates AC = 2.645156, AG = 3.449326, AT = 2.077592, CG = 1.025293, CT = 7.769520, GT = 1.000000; gamma distribution shape parameter alpha = 0.143346. Bootstrap support values for maximum likelihood (MLBS, left) equal to or greater than 70% is given above the nodes. Bayesian posterior probabilities (BYPP, right) equal to or greater than 0.95 are given above the nodes. Ex-type strains are in bold and newly generated sequence is in blue
Fig. 55
Fig. 55
Nigrograna jinghongensis (KUN-HKAS 115776, holotype). ac Appearance of ascomata on host surface. d Longitudinal section of an ascoma. e Section of the peridium cells. f Pseudoparaphyses. gi Asci. jo Ascospores. Scale bars: d = 100 μm, e, gi = 20 μm, f = 5 μm, jo = 10 μm
Fig. 56
Fig. 56
Phylogram generated from the best scoring of the RAxML tree based on combined SSU, LSU, ITS, TEF1-α and RPB2 sequence dataset to indicate the new species Nigrograna jinghongensis and related species in Nigrogranaceae. Thirty-three strains are included in the combined analyses which comprise a total of 4372 characters. Occultibambusa bambusae (MFLUCC 13-0855) and O. chiangraiensis (MFLUCC 16-0380) are selected as the outgroup taxa. The best RAxML tree with a final likelihood value of − 16022.187073 is presented. RAxML analysis yielded 1068 distinct alignment patterns and 26.01% of undetermined characters or gaps. Estimated base frequencies were as follows: A = 0.24908, C = 0.245478, G = 0.267145, T = 0.238298, with substitution rates AC = 1.477319, AG = 4.369095, AT = 1.2688, CG = 0.859595, CT = 11.229756, GT = 1.000000; gamma distribution shape parameter alpha = 0.579103. Bootstrap support values for maximum likelihood (MLBS, left) equal to or greater than 60% is given above the nodes. Ex-type strains are in bold and newly generated sequences are in blue
Fig. 57
Fig. 57
Seriascoma honghense (KUN-HKAS 112013, holotype). a Conidiomata on surface of dead bamboo branches. b, d Vertical section of conidioma. c Wall of conidioma. e Ampulliform locule of conidioma. fi Conidiogenous cells bearing conidia. j Conidia. k, l Culture frontage and reverse. Scale bars: b, d = 100 μm, e = 50 μm, c = 20 μm, fj = 5 μm
Fig. 58
Fig. 58
Phylogram generated from maximum likelihood analysis based on combined ITS, LSU, SSU and TEF1-α sequence data. Twenty-three strains are included in the combined gene analyses comprising 3865 characters after alignment (643 characters for ITS, 853 characters for LSU, 1438 characters for SSU, 931 characters for TEF1-α). Ohleria modesta (MGC and OM) is used as the outgroup taxon. The tree topology of the Bayesian analysis was similar to the maximum likelihood analysis. The best RAxML tree with a final likelihood value of − 13136.916046 is presented. The matrix had 883 distinct alignment patterns, with 33.71% undetermined characters or gaps. Estimated base frequencies were as follows: A = 0.241326, C = 0.251489, G = 0.273232, T = 0.233953; substitution rates AC = 1.629497, AG = 2.743632, AT = 1.443415, CG = 0.989741, CT = 7.278242, GT = 1.000000; gamma distribution shape parameter α = 0.150194. Bootstrap values for maximum likelihood equal to or greater than 70% and Bayesian posterior probabilities equal or greater than 0.95 BYPP are placed above or below the branches. Ex-type strains are in bold and newly generated sequence is in blue
Fig. 59
Fig. 59
Paradictyoarthrinium diffractum (MFLU 21-0065, new record). a, b Colonies on woody substrate. c Conidial masses arising from conidiogenous cells. di Conidiogenous cells with attached conidia. j, k Conidia. l Germinated conidium. m, n Culture on PDA from surface and reverse. Scale bars: c = 20 μm, di, l = 10 μm, j, k = 5 μm
Fig. 60
Fig. 60
Maximum likelihood phylogenetic tree based on a combined LSU, ITS, RPB2, SSU and TEF1-α sequence data of Paradictyoarthrinium taxa (Paradictyoarthriniaceae) and related families. The tree is rooted with Melanomma pulvis-pyrius (CBS 124080). Bootstrap support values for maximum likelihood (MLBS, left) equal to or greater than 70% is given above the nodes. Bayesian posterior probabilities (BYPP, right) equal to or greater than 0.95 are given above the nodes. Newly generated sequence is in blue
Fig. 61
Fig. 61
Pleopunctum thailandcum (MFLU 21-0043, holotype). ac Colonies on natural substrates. d, e Conidiophores with conidiogenous cells. fh Conidiogenous cells and conidia. i Conidium with basal hyaline cells. j Germinated conidium. k, l Culture on PDA from surface and reverse. Scale bars: b = 250 μm, c = 100 μm, eg, i, j = 20 μm, d, h = 10 μm
Fig. 62
Fig. 62
Phylogram generated from Bayesian analysis based on combined LSU, SSU, ITS and TEF1-α sequence data. Twenty-one strains are included in the combined analyses which comprised 3338 characters (866 characters for LSU, 999 characters for SSU, 550 characters for ITS, 923 characters for TEF1-α) after alignment. Tree topology of the maximum likelihood analysis is similar to the Bayesian analysis. The best RAxML tree with a final likelihood value of − 11657.841536 is presented. Estimated base frequencies were as follows: A = 0.239152, C = 0.258772, G = 0.277763, T = 0.224314; substitution rates AC = 1.083541, AG = 2.347613, AT = 1.453520, CG = 1.144548, CT = 7.950168, GT = 1.000000. Bootstrap support values for ML greater than 70% and Bayesian posterior probabilities greater than 0.95 are given near nodes respectively. The tree is rooted with Lophiohelichrysum helichrysi (MFLUCC 15-0701) and Lophiostoma macrostomum (JCM 13,544). Ex-type strains are in bold and newly generated sequence is in blue
Fig. 63
Fig. 63
Phaeosphaeriopsis aloes (KUN-HKAS 115783, new host and new geographical record). ad Ascomata observed on host substrate. e Vertical section through an ascoma. f Close of an ostiole. g Cells of peridium. h Pseudoparaphyses. jl Asci. i, mp Ascospores. Scale bars: d, e = 50 µm, g, ip = 20 µm, h = 10 µm
Fig. 64
Fig. 64
Phylogram generated from the best scoring of the RAxML tree based on a combined SSU, LSU, TEF1-α and ITS sequence dataset to indicate the representative species in Phaeosphaeriaceae. Twenty-six strains are included in the combined analyses which comprise a total of 2930 characters. Leptosphaeria doliolum (CBS 505.75) and Paraleptosphaeria dryadis (CBS 643.86) are selected as the outgroup taxa. The best RAxML tree with a final likelihood value of − 10260.911412 is presented. RAxML analysis yielded 541 distinct alignment patterns and 25.64% of undetermined characters or gaps. Estimated base frequencies were as follows: A = 0.247998, C = 0.227405, G = 0.266027, T = 0.258570; substitution rates AC = 1.142059, AG = 3.643753, AT = 2.176676, CG = 0.693405, CT = 7.632890, GT = 1.00; gamma distribution shape parameter alpha = 0.572735. Bootstrap support values for maximum likelihood (MLBS, left) equal to or greater than 60% are given above the nodes. Ex-type strains are in bold and newly generated sequence is in blue
Fig. 65
Fig. 65
Comoclathris permunda (TASM 6159, reference specimen). ac Appearance of ascomata on host surface. d Longitudinal section of an ascoma. e Section of the peridium. f Pseudoparaphyses. gi Asci. jl Ascospores surrounded by with a mucilaginous sheath. Scale bars: d = 50 μm, e, jl = 10 μm, f = 5 μm, gi = 20 μm
Fig. 66
Fig. 66
Phylogram generated from the best scoring of the RAxML tree based on a combined SSU, LSU, ITS, and RPB2 sequence dataset to indicate the species in Comoclathris. Twenty-six strains are included in the combined analyses which comprise a total of 3318 characters. Phaeosphaeriopsis dracaenicola (MFLUCC 11-0157, MFLUCC 11-0193) is selected as the outgroup taxon. The best RAxML tree with a final likelihood value of − 11070.111652 is presented. RAxML analysis yielded 691 distinct alignment patterns and 19.26% of undetermined characters or gaps. Estimated base frequencies were as follows: A = 0.25654, C = 0.224566, G = 0.266202, T = 0.252692, with substitution rates AC = 1.928472, AG = 4.365502, AT = 1.451146, CG = 1.060614, CT = 9.003466, GT = 1.000000; gamma distribution shape parameter alpha = 0.483396. Bootstrap support values for maximum likelihood (MLBS) equal to or greater than 60% is given above the nodes. Ex-type strains are in bold and newly generated sequence is in blue
Fig. 67
Fig. 67
Lepidosphaeria strobelii (AMH 10126, holotype; NFCCI 4579, ex-type culture). a, b Colonies morphology on potato dextrose agar (from surface and reverse views). c, d Colonies morphology on SDA, from surface and reverse views). e Stereoscopic view of colony growing on PDA. f, g Magnified view showing hyphal bundles. h Microscopic view of hyphal bundles. i Mycelia with septate hyphae (arrows). j Mycelia showing frequent anastomosis (arrows). k, l Mycelia with spiral twisting (arrows). m Young chlamydospores. n Mature chlamydospores in chain. o Mature chlamydospores in bunch. p Mature chlamydospore. Scale bars: ip = 20 μm
Fig. 68
Fig. 68
Phylogram generated from maximum likelihood method for Lepidosphaeria strobelii (NFCCI 4579); using combined ITS and LSU sequence dataset. The evolutionary history was inferred based on the General Time Reversible model (Nei and Kumar 2000). The tree with the highest log likelihood (− 7009.2670) is shown. The percentage of trees in which the associated taxa clustered together is shown next to the branches. A discrete GAMMA distribution was used to model evolutionary rate differences among sites [5 categories (+ G, parameter = 0.5660)]. The rate variation model allowed for some sites to be evolutionarily invariable [(+ I), 58.2766% sites]. The tree is drawn to scale, with branch lengths measured in the number of substitutions per site. The analysis involved 35 nucleotide sequences. All positions with less than 85% site coverage were eliminated. That is fewer than 15% alignment gaps, missing data, and ambiguous bases were allowed at any position. There were a total of 1322 positions in the final dataset. Evolutionary analyses were conducted in MEGA7 (Kumar et al. 2016). Sigarispora arundinis (formerly known as Lophiostoma arundinis) was used as an outgroup. Ex-type strains are in bold and newly generated sequence is in blue
Fig. 69
Fig. 69
Ernakulamia tanakae (MFLU 21-0066, new record). a, b Appearance of conidial masses on host substrate. cf Mature conidia. g Germinated conidium. h, i Culture on PDA from surface and reverse. Scale bars: cf = 10 µm, g = 20 µm
Fig. 70
Fig. 70
Maximum likelihood phylogenetic tree based on a combined LSU and ITS sequence dataset of Ernakulamia taxa and related genera in Tetraplosphaeriaceae. Thirty-eight strains are included in the combined analyses which comprise a total of 1468 characters. Amniculicola immersa (CBS 12308) and A. parva (CBS 123092) are selected as the outgroup taxa. The best RAxML tree with a final likelihood value of − 5624.746373 is presented. RAxML analysis yielded 413 distinct alignment patterns and 15% of undetermined characters or gaps. Estimated base frequencies were as follows: A = 0.236603, C = 0.245429, G = 0.293755, T = 0.224212, with substitution rates AC = 2.551620, AG = 2.407140, AT = 1.683194, CG = 0.618325, CT = 9.671311, GT = 1.000000; gamma distribution shape parameter alpha = 0.164106. Bootstrap support values for maximum likelihood (MLBS, left) equal to or greater than 70% are given above or below the nodes. Bayesian posterior probabilities (BYPP, right) equal to or greater than 0.95 are given above the nodes. Ex-type strains are in bold and newly generated sequence is in blue
Fig. 71
Fig. 71
Thyridaria aureobrunnea (MFLU 21-0067, holotype). a, b Ascomata on woody substrate. c Cross sections of ascoma. d Peridium. e Pseudoparaphyses. fh Asci. ik Ascospores. l Germinated ascospore. m, n Culture on PDA from surface and reverse at 1 month. Scale bars: c = 50 µm, d, e = 20 µm, fh = 10 µm, il = 5 µm
Fig. 72
Fig. 72
Maximum likelihood phylogenetic tree based on a combined LSU, ITS and TEF1-α sequence data of Thyridaria taxa (Thyridariaceae) and related families. Forty-two strains are included in the combined analysis, which comprise a total of 2216 characters. Occultibambusa bambusae (MFLUCC 11-0394 and MFLUCC 13-0855) are selected as the outgroup taxa. The best RAxML tree with a final likelihood value of − 12410.223662 is presented. RAxML analysis yielded 752 distinct alignment patterns and 19.90% of undetermined characters or gaps. Estimated base frequencies were as follows: A = 0.235389, C = 0.270091, G = 0.280715, T = 0.213806, with substitution rates AC = 1.372292, AG = 2.751820, AT = 1.999735, CG = 1.148507, CT = 6.478337, GT = 1.000000; gamma distribution shape parameter alpha = 0.169795. Bootstrap support values for maximum likelihood (MLBS, left) equal to or greater than 70% is given above or below the nodes. Bayesian posterior probabilities (BYPP, right) equal to or greater than 0.95 are given above the nodes. Ex-type strains are in bold and newly generated sequence is in blue
Fig. 73
Fig. 73
Cylindrotorula indica (AMH 10228, holotype). ad Sporodochial conidiomata on natural substrate. Scale bars: ad = 100 µm
Fig. 74
Fig. 74
Cylindrotorula indica (AMH 10228, holotype). ac SEM of conidiomata showing conidiophores and primary conidia. d Cylindrical elongated primary conidium. e Globose secondary conidium. f Base of primary conidium. g Secondary conidial development of primary conidia. Scale bars: a, c, d, g = 2 µm, b = 1 µm, e = 200 nm, f = 1 µm
Fig. 75
Fig. 75
Cylindrotorula indica (AMH 10228, holotype). a, b Sporodochial conidiomata. cg Primary conidia with monotretic secondary conidia. h, i Dark thick hilum of primary conidia. j, k Pleomorphic secondary conidia. l, m Monotretic secondary conidial development. n, o Branched conidiophore with primary conidia. Scale bars: ao = 10 µm
Fig. 76
Fig. 76
Phylogram generated from maximum likelihood analysis based on LSU, RPB2, ITS, and TEF1-α sequence dataset representing Torulaceae and related families. Related sequences are taken from Hyde et al. (2019). Sixty-eight strains are included in the combined analyses which comprise 2807 characters and 517 characters for ITS after alignment. Neooccultibambusa chiangraiensis (MFLUCC 12-0559) and Occultibambusa bambusae (MFLUCC 12-0559) in Occultibambusaceae (Pleosporales) are used as the outgroup taxa. Single gene analyses were also performed to compare the topology and clade stability with combined gene analyses. Tree topology of the maximum likelihood analysis is similar to the Bayesian analysis. The best RAxML tree with a final likelihood values of − 25944.916075 is presented. The matrix had 1201 distinct alignment patterns, with 23.66% undetermined characters or gaps. Estimated base frequencies were as follows: A = 0.240116, C = 0.269729, G = 0.272735, T = 0.217421; substitution rates AC = 1.567160, AG = 3.410853, AT = 1.595585, CG = 0.809155, CT = 7.747008, GT = 1.000000; gamma distribution shape parameter α = 0.645809. Bootstrap values for maximum likelihood (MLBS) equal to or greater than 60% and posterior probabilities (BYPP, right) equal to or greater than 0.95 (the rounding of values to 2 decimal places) from Bayesian inference analysis labeled on the nodes. The newly generated sequences are in blue bold
Fig. 77
Fig. 77
Dendryphion hydei (HKAS 112706, new record). a Colonies on submerged wood. bd Conidiophores with conidiogenous cells. e, f Conidiogenous cells with conidia. gl Conidia. m, n Culture on PDA (surface and reverse). Scale bars: a = 200 μm, b, c = 50 μm, df, hl = 10 μm, g = 20 μm
Fig. 78
Fig. 78
Torula lancangjiangensis (HKAS 112709, holotype). a, b Colonies on submerged wood. cf Conidiophores with conidiogenous cells. g, h Conidiophores, conidiogenous cells with conidia. ik Conidia. l Conidia in chain. m Germinated conidium. n Culture on PDA from surface and reverse. Scale bars: cm = 20 μm
Fig. 79
Fig. 79
Torula mackenziei (HKAS 112705, new record). a Colonies on submerged wood. bf Conidiophores with conidiogenous cells and conidia. g, h Conidia. ik Conidia in catenated chain. lo Branched chains of conidia. p Germinated conidium. q Culture on PDA from surface and reverse. Scale bars: ap = 10 μm
Fig. 80
Fig. 80
Phylogram generated from maximum likelihood analysis based on combined LSU, SSU, TEF1-α, RPB2 and ITS sequence dataset representing genera of Torulaceae and other related families in Pleosporales. The updated sequence dataset was derived from Hyde et al. (2020b) and Li et al. (2020a). Forty-seven strains are included in the combined analyses which comprise a total of 4193 characters. Paeadictyoarthrinium diffractun MFLUCC 13-0466 and P. hydei MFLUCC 17-2512 are selected as the outgroup taxa. The best RAxML tree with a final likelihood value of − 20632.568415 is presented. RAxML analysis yielded 1256 distinct alignment patterns and 34.11% of undetermined characters or gaps. Estimated base frequencies were as follows: A = 0.246275, C = 0.259573, G = 0.270969, T = 0.223183, with substitution rates AC = 1.544243, AG = 3.270041, AT = 1.437706, CG = 0.944551, CT = 7.854806, GT = 1.000000; gamma distribution shape parameter alpha = 0.178530. Bootstrap support values for maximum likelihood (MLBS, left) equal to or greater than 70% is given above the nodes. Bayesian posterior probabilities (BYPP, right) equal to or greater than 0.95 are given above the nodes. Ex-type strains are in bold and newly generated sequences are in blue
Fig. 81
Fig. 81
Wicklowia fusiformispora (MFLU 21-0068, holotype). a, b Appearance of ascomata on decaying submerged wood. c, d Cross sections of ascomata. e Section of peridium. f Pseudoparaphyses. gk Asci. lo Ascospores. p Ascospore stained in Nigrosine reagent. q Germinated ascospore. r, s Culture on MEA from above and below. Scale bars: c, d = 200 µm, ek, q = 20 µm, lp = 10 µm
Fig. 82
Fig. 82
Wicklowia submersa (MFLU 21-0069, new record). a Appearance of ascomata on substrate. b Cross section of ascomata. c Section of peridium. d Pseudoparaphyses. eh Asci. ik Ascospores (i and j = ascospores mounted in water, k = ascospore stained in Nigrosin reagent). l Germinated ascospore. m, n Culture on MEA from surface and reverse. Scale bars: b = 100 μm, ch, l = 20 μm, ik = 10 μm
Fig. 83
Fig. 83
Maximum likelihood phylogenetic tree based on a combined LSU and SSU sequence data of Wicklowia taxa (Wicklowiaceae) and related families. The tree is rooted with Delitschia chaetomioides (SMH 3253.2) and D. winteri (CBS 225.62). Bootstrap support values for maximum likelihood (MLBS, left) equal to or greater than 50% is given above the nodes. Bayesian posterior probabilities (BYPP, right) equal to or greater than 0.95 are given above the nodes. Ex-type strains are in bold and newly generated sequences are in blue
Fig. 84
Fig. 84
Helicosporium luteosporum (MFLU 17-0502, new record). a Colony on decaying wood. bd Conidiophores with lateral minute polyblastic denticles and attached conidia. ei Conidia. Scale bars: a = 200 µm, b, c = 50 µm, di = 20 µm
Fig. 85
Fig. 85
Helicosporium luteosporum sporulation in culture (MFLUCC 16-1233). a Germinated conidium. b, c Culture on MEA from surface and reverse after 1 month. df Mycelium and development of conidia in culture. gj Conidia. Scale bars: a, dj = 20 µm
Fig. 86
Fig. 86
Helicosporium sexuale (MFLU 21-0104, holotype). a Superficial ascomata on decaying wood substrate. b Squash mount of ascoma showing peridium. c Setae. df Asci. gj Ascospores. k Germinated conidium. l, m Culture on MEA from surface and reverse after 1 month. Scale bars: a = 200 µm, b = 100 µm, cf = 40 µm, gk = 20 µm
Fig. 87
Fig. 87
Maximum likelihood phylogenetic tree based on a combined ITS, LSU and TEF1-α sequence data of Helicosporium taxa and related genera in Tubeufiaceae. Thirty-two taxa are included in the combined analyses which comprise a total of 2367 characters. Berkleasmium thailandicum (MFLUCC 15-1248 and MFLUCC 17-1984) are selected as the outgroup taxa. The best RAxML tree with a final likelihood value of − 8690.594891 is presented. RAxML analysis yielded 609 distinct alignment patterns and 25.02% of undetermined characters or gaps. Estimated base frequencies were as follows: A = 0.231326, C = 0.266395, G = 0.273200, T = 0.229079, with substitution rates AC = 1.159455, AG = 2.641204, AT = 1.962575, CG = 0.673701, CT = 9.846706, GT = 1.000000; gamma distribution shape parameter alpha = 0.182397. Bootstrap support values for maximum likelihood (MLBS, left) equal to or greater than 70% is given above the nodes. Bayesian posterior probabilities (BYPP, right) equal to or greater than 0.95 are given above the nodes. Ex-type strains are in bold and newly generated sequences are in blue
Fig. 88
Fig. 88
Neohelicosporium irregulare (MFLU 21-0098, new record). a Colony on decaying wood. b, c Conidiophores with lateral minute polyblastic denticles and attached conidia. di Conidia. Scale bars: a = 100 µm, bi = 20 µm
Fig. 89
Fig. 89
Neohelicosporium irregulare sporulation in culture (MFLUCC 16-0722). a Germinated conidium. b, c Culture on MEA from surface and reverse. df Mycelium and development of conidia in culture. gl Conidia. Scale bars: a, el = 20 µm, d = 100 µm
Fig. 90
Fig. 90
Neohelicosporium parvisporum (MFLU 21-0123, new record). a Substrate. b, c Colony on decaying wood. df Conidiophores with conidia. gi Conidiogenous cells. jm Conidia. Scale bars: a = 20 mm, b, c = 500 μm, d = 100 μm; em = 20 μm
Fig. 91
Fig. 91
Maximum likelihood phylogenetic tree based on a combined ITS, LSU and TEF1-α sequence data of Neohelicosporium taxa and related genera in Tubeufiaceae. Forty-five taxa are included in the combined analyses which comprise a total of 2348 characters. Neochlamydotubeufia fusiformis (MFLUCC 16-0016) is selected as the outgroup taxon. The best RAxML tree with a final likelihood value of − 5971.586719 is presented. RAxML analysis yielded 343 distinct alignment patterns and 12.46% of undetermined characters or gaps. Estimated base frequencies were as follows: A = 0.230669, C = 0.271979, G = 0.266714, T = 0.230637, with substitution rates AC = 0.718733, AG = 2.140841, AT = 1.942223, CG = 0.669931, CT = 13.341832, GT = 1.000000; gamma distribution shape parameter alpha = 0.020000. Bootstrap support values for maximum likelihood (MLBS, left) equal to or greater than 70% is given above the nodes. Bayesian posterior probabilities (BYPP, right) equal to or greater than 0.95 are given above the nodes. Ex-type strains are in bold and newly generated sequences are in blue
Fig. 92
Fig. 92
Tubeufia chiangmaiensis (MFLU 21-0103, new record). a Superficial ascomata on decaying wood substrate. b Squash mount of ascoma showing peridium and subiculum hyphae at the base. c Pseudoparaphyses. df Asci. gi Ascospores. Scale bars: a = 200 µm, b = 100 µm, c = 10 µm, df = 50 µm, gi = 20 µm
Fig. 93
Fig. 93
Tubeufia chiangmaiensis sporulation in culture (MFLUCC 16-0197). a Germinated ascospore. b, c Culture on MEA from surface and reverse after 1 month. df Development of conidia and mycelium in culture. gj Conidia. Scale bars: a, f = 50 µm, d = 100 µm, e = 10 µm, gj = 20 µm
Fig. 94
Fig. 94
Tubeufia longihelicospora (MFLU 21-0100, holotype). a Colony on decaying wood. b, c Conidiophores and lateral minute denticles. dh Conidia. Scale bars: a = 200 µm, b, c = 10 µm, dh = 20 µm
Fig. 95
Fig. 95
Tubeufia longihelicospora (MFLUCC 16-0753, ex-type). a Germinated conidium. b, c Culture on MEA from surface and reverse after 1 month. df Mycelium and development on culture (Note: the formation of chlamydospores). Scale bars: a, df = 20 µm
Fig. 96
Fig. 96
Tubeufia roseohelicospora (MFLU 21-0101, new record). a Colony on decaying wood. b–d Conidiophores with lateral minute polyblastic denticles and attached conidia. ej Conidia. k Germinated conidium. l, m Culture on MEA from surface and reverse after 1 month. Scale bars: a = 200 µm, b, c = 50 µm, dk = 20 µm
Fig. 97
Fig. 97
Maximum likelihood phylogenetic tree based on a combined LSU, ITS and TEF1-α sequence dataset of Tubeufia taxa and related genera in Tubeufiaceae. Eighty-four strains are included in the combined analyses which comprise a total of 2395 characters. Pseudohelicomyces talbotii (MFLUCC 17-2021) is selected as the outgroup taxon. The best RAxML tree with a final likelihood value of − 11543.960875 is presented. RAxML analysis yielded 680 distinct alignment patterns and 15.58% of undetermined characters or gaps. Estimated base frequencies were as follows: A = 0.238955, C = 0.251270, G = 0.256785, T = 0.229079, with substitution rates AC = 0.670086, AG = 4.164732, AT = 3.398524, CG = 0.528840, CT = 7.628422, GT = 1.000000; gamma distribution shape parameter alpha = 0.148685. Bootstrap support values for maximum likelihood (MLBS, left) equal to or greater than 70% is given above the nodes. Bayesian posterior probabilities (BYPP, right) equal to or greater than 0.95 are given above the nodes. Ex-type strains are in bold and newly generated sequences are in blue
Fig. 98
Fig. 98
Megacapitula villosa (MFLU 19-0257, new geographical record). a, b Appearance of conidia with hyphal-like appendages and habit on wood substrate. c Immature conidium with hyphal-like appendages. dg Mature conidia with apical hyphal-like appendages. h Conidium changed to brown in lactoglycerol and composed of compressed prosenchyma cells. Scale bars: a, b = 200 µm, ch = 100 µm
Fig. 99
Fig. 99
Megacapitula villosa sporulated in culture (MFLUCC 16-1231). a Germinated conidium with germ tubes surrounded. b, c Cultures on MEA after 1 month. d, e Mycelium development in culture. fh Conidia. Scale bars: a, fh = 100 µm, d, e = 10 µm
Fig. 100
Fig. 100
Maximum likelihood phylogenetic tree based on a combined LSU and ITS sequence dataset of Megacapitula taxa and related families in Pleosporales. Sixty-seven strains are included in the combined analyses which comprise a total of 1456 characters. Cyclothyriella rubronotata CBS 385.39 is selected as the outgroup taxon. The best RAxML tree with a final likelihood value of − 12939.878192 is presented. RAxML analysis yielded 723 distinct alignment patterns and 29.63% of undetermined characters or gaps. Estimated base frequencies were as follows: A = 0.242721, C = 0.238518, G = 0.291320, T = 0.227442, with substitution rates AC = 1.943333, AG = 2.988826, AT = 2.324598, CG = 1.416039, CT = 8.575259, GT = 1.000000; gamma distribution shape parameter alpha = 0.245601. Bootstrap support values for maximum likelihood (MLBS, left) equal to or greater than 70% is given above the nodes. Bayesian posterior probabilities (BYPP, right) equal to or greater than 0.95 are given above the nodes. Ex-type strains are in bold and newly generated sequence is in blue
Fig. 101
Fig. 101
Cladophialophora abundans (MFLUCC 21-0105, new geographical record). a Culture on MEA from surface and reverse. b, c Long strongly coherent conidial chains. dg Conidiophores and conidia. h, i Conidia. Scale bars: b = 100 μm, cg = 50 μm, h, i = 20 μm
Fig. 102
Fig. 102
Cladophialophora aquatica (MFLUCC 21-0108, ex-type). a Culture on MEA from surface and reverse. bm Chlamydospores. Scale bars: b = 300 μm, c, d = 50 μm, em = 20 μm
Fig. 103
Fig. 103
Phylogram generated from maximum likelihood analysis based on combined LSU and ITS sequence data representing the species of Cladophialophora. Related sequences are taken from Kiyuna et al. (2018). Rhopalophora clavispora (CBS 637.73) and Fusichalara minuta (CBS 709.88) were used as the outgroup taxa. Fifty-three taxa are included in the combined analyses which comprised 1041 characters (502 characters for LSU, 539 characters for ITS) after alignment. The best scoring RAxML tree with a final likelihood value of − 9519.130038 is presented. The matrix had 524 distinct alignment patterns, with 16.53% of undetermined characters or gaps. Estimated base frequencies were as follows: A = 0.236745, C = 0.249453, G = 0.269107, T = 0.244695; substitution rates: AC = 1.891141, AG = 3.179450, AT = 1.427526, CG = 0.913317, CT = 6.628918, GT = 1.000000; gamma distribution shape parameter α = 0.260996. The MP analysis resulted a single most parsimonious tree (TL = 1789, CI = 0.455, RI = 0.710, RC = 0.323, HI = 0.545). Bootstrap support values for MLBS and MPBS equal to or greater than 75% and BYPP equal to or greater than 0.95 are given above the nodes. Ex-type strains are in bold and newly generated sequences are in blue
Fig. 104
Fig. 104
Aspergillus lannaensis (SDBR-CMUO8, holotype). Colonies incubated at 25 °C for 7 days. a Colony on CYA. b Colony on MEA. c Colony on CREA. d Conidiophores. e Conidia arranged in long chains. f Oval or ellipsoidal conidia. Scale bars: ac = 10 mm, d, e = 20 µm, f = 10 µm
Fig. 105
Fig. 105
Phylogenetic tree derived from maximum likelihood analysis of a combined Cam, BenA and RPB2 genes of 22 sequences and the aligned dataset was comprised of 2360 characters including gaps (Cam: 1–792, BenA: 793–1310 and RPB2: 1311–2360). The average standard deviation of the split frequencies of the BI analysis was 0.004276. A best scoring RAxML tree was established with a final ML optimization likelihood value of − 13462.8650. The matrix had 1055 distinct alignment patterns with 21.67% undetermined characters or gaps. Estimated base frequencies were found to be: A = 0.2500, C = 0.2468, G = 0.2390, T = 0.2642; substitution rates AC = 1.0520, AG = 3.4446, AT = 1.0037, CG = 0.6646, CT = 5.3732, GT = 1.0000; proportion of invariable sites = 0.1320 and gamma distribution = 0.6870. Aspergillus fructus NRRL 239 and Aspergillus versicolor CBS 583.65 were used as outgroup. Numbers above branches are the bootstrap statistics percentages (left) and Bayesian posterior probabilities (right). Branches with bootstrap values equal to or greater than 70% are shown at each branch and the bar represents 0.1 substitutions per nucleotide position. Hyphen (-) represents support values equal to or greater than 70%/0.95. Ex-type strains are in bold and newly generated sequences are in blue
Fig. 106
Fig. 106
Pseudobactrodesmium stilboideum (MFLU 21-0120). a Substrate. be Synnemata on submerged wood. fh Synnemata and densely branched conidiophores, conidiogenous cells and attached conidia. il Conidia and mucilaginous cap at the apex. m Germinated conidium. n Culture on MEA from surface and reverse. Scale bars: b, c = 500 μm, df = 200 μm, gm = 50 μm
Fig. 107
Fig. 107
Phylogenetic tree generated from maximum likelihood (ML) analysis based on combined LSU and ITS sequence data for the species from Dactylosporaceae. Five species of Sporidesmium aquaticum, S. bambusicola, S. fluminicola, S. submersum and S. thailandense (Sporidesmiaceae) are used as outgroup taxa. The dataset comprised and 1222 characters after alignment including gaps (LSU = 793 bp, ITS = 429 bp). The RAxML analysis of the combined dataset yielded a best scoring tree with a final ML optimization likelihood value of − 3662.794208. The matrix had 1053 distinct alignment patterns, with 51.86% undetermined characters or gaps. Estimated base frequencies were as follows: A = 0.266384, C = 0.211364, G = 0.273019, T = 0.249233; substitution rates AC = 1.261100, AG = 2.304874, AT = 1.337644, CG = 1.220148, CT = 5.907736, GT = 1.000000; gamma distribution shape parameter α = 0.284689. Support values for maximum likelihood (MLBS) above than 75% and Bayesian posterior probabilities (BYPP) greater than 0.95 are given at the nodes. Ex-type species are in bold and newly generated sequence is in blue
Fig. 108
Fig. 108
Hydrophilomyces hydraenae (FI WR2462, holotype). a Thallus from the type slide stained with acid fuchsin. b Thallus from the paratype slide stained with acid fuchsin. Scale bars: a, b = 100 µm
Fig. 109
Fig. 109
Laboulbenia divisa (FI WR3479a, holotype). a Whole thallus from the type slide. b Upper portion of an immature thallus from the type slide. Scale bars: a, b = 100 µm
Fig. 110
Fig. 110
Laboulbenia triarthronis (SYRF RKB 601a, holotype). a Thallus from the type slide stained with cotton blue. b Immature thallus from a paratype slide stained with cotton blue. Scale bars: a, b = 50 µm
Fig. 111
Fig. 111
Mimeomyces digitatus (FI WR3388, holotype). a, b Thalli from the type slide. Scale bars: a, b = 100 µm
Fig. 112
Fig. 112
Synandromyces makranczyi (FI WR3154, holotype). a, b Thalli from the type slide (BF). c Thallus from the type slide (DIC). Scale bars: ac = 100 µm
Fig. 113
Fig. 113
Erysiphe salicicola (CNUFC PWS1, holotype). a Symptoms of powdery mildew on black pussy willow (Salix gracilistyla var. melanostachys). b Chasmothecia on the leaf-surface. cg, i Young and mature chasmothecium with appendages. h Appendages. jp Asci containing ascospores. qs Conidiophores. t, u Conidia and conidial germ tubes. v, w Appressoria (Fig. b: observed under a stereomicroscope; Figs. c–w: light microscope). Scale bars: cf, h, jw = 20 µm, g, i = 50 µm
Fig. 114
Fig. 114
Phylogram generated from maximum likelihood analysis based on ITS and LSU sequence data for species of Erysiphe. Bootstrap value equal to or greater than 70% for ML analyses is presented at the nodes. Erysiphe australiana was used as outgroup. Type strains are in bold and newly generated sequences are in blue
Fig. 115
Fig. 115
Scolecoleotia eriocamporesi (MFLU 16-2133, holotype). a, b Appearance of conidiomata on host surface. c Section through conidioma. d, e Section through pycnidial wall. fi Conidiogenous cells with attached conidia stained in Congo red. jm Conidia. Scale bars: c = 500 μm, d, e = 50 μm, fi = 20 μm, jm = 10 μm
Fig. 116
Fig. 116
Phylogram generated from maximum likelihood analysis based on combined ITS, LSU, SSU and RPB2 sequence data. Fifty-one strains are included in the combined gene analyses comprising 3907 characters after alignment (632 characters for ITS, 1019 characters for LSU, 1283 characters for SSU, 973 characters for RPB2). Bacilliformis hyalinus (MFLU 18-2671 and MFLU 18-1811) and Darkera picea (CPC 23897) are used as outgroup taxa. The tree topology of the Bayesian analysis was similar to the maximum likelihood analysis. The best RAxML tree with a final likelihood value of − 19994.043154 is presented. The matrix had 1424 distinct alignment patterns. Estimated base frequencies were as follows: A = 0.256835, C = 0.219258, G = 0.273899, T = 0.250008; substitution rates AC = 2.087920, AG = 4.320672, AT = 2.285635, CG = 1.273283, CT = 9.026514, GT = 1.000000; gamma distribution shape parameter α = 0.216097. The final average standard deviation of split frequencies at the end of total MCMC generations calculated as 0.006795 in BI analysis. Bootstrap values for maximum likelihood equal to or greater than 50% and Bayesian posterior probabilities equal or greater than 0.90 BYPP are placed above or below the branches. Ex-type strains are in bold and newly generated sequences are in blue
Fig. 117
Fig. 117
Coryneum fagi (BJFC-S1782, holotype). a Conidiomata on the dead branch of Fagus sp. b Cross section of conidioma. ce Developing conidia from conidiogenous cells. fj Conidia. Scale bars: b = 100 μm, cj = 10 μm
Fig. 118
Fig. 118
Phylogram generated from RAxML analysis based on combined LSU, ITS, TEF1-α and RPB2 sequence data of Coryneum. Related sequences were obtained from GenBank. Thirty-two strains are included in the combined analyses, which comprise 4690 characters (1500 characters for ITS-LSU, 232 characters for TEF1-α, 1079 characters for RPB2) after alignment. Stilbospora macrosperma (CBS 115073) and Stegonsporium pyriforme (CBS 120522) are used as the outgroup taxa. The tree topology of the ML analysis was similar to the BI. The best scoring RAxML tree with a final likelihood value of − 12745.413163 is presented. The matrix had 817 distinct alignment patterns, with 18.15% of undetermined characters or gaps. Maximum likelihood bootstrap support values equal to or greater than 50% (MLBS, left), and Bayesian posterior probabilities equal to or greater than 0.90 (BYPP, right) are given at the nodes. The newly generated sequences are in blue bold
Fig. 119
Fig. 119
Diaporthe chamaeropicola (AVE-F-8, holotype). a Conidiomata formed on 1/2 PDA with conidia oozing in creamy mucoid masses. bd Short conidiogenous cells (white arrows point to collarettes, black arrows point at periclinal thickenings). e, g Long conidiogenous cells. f, h Paraphyses (black arrow indicates a branch that is functioning as a conidiogenous cell). i Conidia. Scale bars: a = 1 mm, bi = 5 μm
Fig. 120
Fig. 120
Diaporthe foeniculina (CDP 022, new record). a, b Conidiomata formed on 1/2 PDA. Conidia are oozing in yellowish cirri. ce Conidiophores and short conidiogenous cells. f, g Long conidiogenous cells. h Alpha and beta conidia. i Alpha conidia. Scale bars: a = 0.5 mm, b = 0.1 mm, ci = 5 μm
Fig. 121
Fig. 121
Diaporthe pseudophoenicicola (CDP 047, new record). a, b Conidiomata formed on 1/2 PDA. Conidia are oozing in creamy mucoid masses. c Section through conidioma loculus. d Section through conidioma loculus showing wall invaginations. e Section through conidiogenous layer. fh Conidiogenous cells and paraphyses (white arrows). i, j Conidia. Scale bars: a = 1 mm, b = 0.5 mm, ce = 10 μm, fj = 5 μm
Fig. 122
Fig. 122
Diaporthe pyracanthae (CDP 052, new record). a Conidiomata formed on 1/2 PDA. Conidia are oozing in pearl mucoid masses. b Vertical section of conidioma, showing its heart-shaped internal cavity. cg Conidiogenous cells. h, i Beta conidia. j, k Alpha conidia. Scale bars: a = 0.5 mm, b = 20 µm, ck = 5 µm
Fig. 123
Fig. 123
Maximum Likelihood tree generated by RAxML with GTR + G + I nucleotide substitution model using the combined four loci ITS, TEF1-α, TUB and CAL. The sequences were retrieved from GenBank according to BLAST searches with the ITS locus and by reference to the recent literature. Sixty-four strains are included in the combined analyses that comprise 2248 characters (including gaps) (502 characters for ITS, 669 for TUB, 411 for TEF1-α and 554 for CAL) after alignment and manual adjustment. The final likelihood score for the ML tree was − 15269.024241. The matrix had 1121 distinct alignment patterns, with 27.31% undetermined characters or gaps. ML bootstrap support values (> 50%) are shown above the branches. The scale bar represents the expected number of nucleotide changes per site. Diaporthe toxica (CBS 534.93) was included as an outgroup. Ex-type/ex-epitype/ex-isotype/ex-neotype cultures are in bold and newly generated sequences are in blue
Fig. 124
Fig. 124
Phaeocytostroma yomense (MFLU 21-0070, holotype). a, b Appearance of white conidiomata on decaying submersed wood substrate. ce Conidia. f Germinated conidium. g, h Culture on PDA from surface and reverse. Scale bars: a = 100 μm, b = 50 μm, c, e, f = 20 μm, d = 10 μm
Fig. 125
Fig. 125
Maximum likelihood phylogenetic tree based on a combined ITS, LSU and TEF1-α sequence data of Phaeocytostroma taxa and some related genera in Diaporthaceae. The tree is rooted with Phomopsis viticola (UCD2009SB). Bootstrap support values for maximum likelihood (MLBS, left) equal to or greater than 70% is given above the nodes. Bayesian posterior probabilities (BYPP, right) equal to or greater than 0.95 are given above the nodes. The newly generated sequence is in blue bold
Fig. 126
Fig. 126
Parafuscosporella nilotica (CBS H-22128, holotype). a, b Vertical section through sporodochium. c, d Squash of sporodochium. el Conidia at different stages of development. Scale bars: a, c = 120 µm, b, d = 20 µm, e, i = 10 µm, fh, jl = 5 µm
Fig. 127
Fig. 127
Phylogenetic relationship of Parafuscosporella nilotica with related taxa in Fuscosporellaceae based on the nucleotide sequences of the ITS. The maximum likelihood (ML) tree (-ln likelihood = 4928.50) was constructed in MEGA X (Kumar et al. 2018). The maximum parsimonious data set of the combined genes consisted of 25 taxa with 3 representatives of Savoryellales are used as the outgroup taxa. The dataset includes 503 total characters, of which 175 were constant, 30 parsimony-uninformative and 298 parsimony-informative. The parsimony analyses of the data matrix yielded 3 equally most parsimonious trees with a tree length of 1021 steps [consistency index (CI) = 0.6298, homoplasy index (HI) = 0.3702, retention index (RI) = 0.7816, rescaled consistency index (RC) = 0.4923]. Phylogenetic trees obtained from ML, maximum parsimony (MP) and Bayesian inference posterior probabilities (BIPP) were similar in topology. Bootstrap support on the nodes represents MLBS and MPBS equal to or greater than 50%. Branches with a BYPP of equal to or greater than 95% are in bold. The new taxon is in yellow box
Fig. 128
Fig. 128
Fusarium atrovinosum (BRIP 70767a, new record). a, b Culture on PDA from surface and reverse. c Conidiophores. d Conidia. e Chlamydospores. Scale bars: a, b = 1 cm, ce = 10 µm
Fig. 129
Fig. 129
Phylogram generated from Bayesian analysis based on combined CAL, RPB1, RPB2 and TEF1-α sequence data representing Fusarium chlamydosporum species complex and related taxa. The second measure of branch support was obtained through Maximum Likelihood (ML) analysis of the same alignment using RAxML v. 8 (Stamatakis 2014) based on the GTR substitution model with gamma-distribution rate variation for each partition. Reference strains were obtained from Lombard et al. (2019b). The tree is rooted to Fusarium concolor (NRRL 13459). The analysis was performed using MrBayes v. 3.2.4 (Ronquist et al. 2012) based on the K80, K80 + G, and HKY + G nucleotide substitution models selected for CAL, RPB2, and TEF1-α, respectively, using PAUP v. 4.0 (Swofford 2003) and MrModeltest v. 2.3. (Nylander 2009). Maximum likelihood bootstrap support values (MLBS) greater than 80% are placed above the nodes and Bayesian posterior probabilities (BYPP) equal to or greater than 0.95. Branches with MLBS = 100% and BYPP = 1.00 are thickened. Scale bar indicates the number of substitutions per nucleotide. Ex-type strains are in bold and newly isolate is in blue
Fig. 130
Fig. 130
Fusarium clavum (BRIP 70756a, new record). a, b Culture on PDA from surface and reverse. c, d Conidia and chlamydospores. Scale bars: a, b = 1 cm, c, d = 10 µm
Fig. 131
Fig. 131
Phylogram generated from Bayesian analysis based on combined CAL, RPB2, and TEF1-α sequence data representing Fusarium incarnatum-equiseti species complex and related taxa. The second measure of branch support was obtained through Maximum Likelihood (ML) analysis of the same alignment using RAxML v. 8 (Stamatakis 2014) based on the GTR substitution model with gamma-distribution rate variation for each partition. Reference sequence were obtained from Xia et al. (2019). The tree is rooted to Fusarium concolor (NRRL 13459). The analysis was performed using MrBayes v. 3.2.4 (Ronquist et al. 2012) based on the K80, K80 + G, and HKY + G nucleotide substitution models selected for CAL, RPB2, and TEF1-α, respectively, using PAUP v. 4.0 (Swofford 2003) and MrModeltest v. 2.3. (Nylander 2009). Maximum likelihood bootstrap support values (MLBS) greater than 80% are placed above the nodes and Bayesian posterior probabilities (BYPP) equal to or greater than 0.95. Branches with MLBS = 100% and BYPP = 1.00 are thickened. Scale bar indicates the number of substitutions per nucleotide. Ex-type strains are in bold and newly isolate is in blue
Fig. 132
Fig. 132
Fusarium queenslandicum (BRIP 70769a, holotype). a, b Culture on PDA from surface and reverse. c Conidiophores with false heads. d Microconidia. e Chlamydospores. Scale bars: a, b = 1 cm, ce = 10 µm
Fig. 133
Fig. 133
Phylogram generated from Bayesian analysis based on combined CAL, RPB2, TEF1-α, and TUB2 sequence data representing Fusarium oxysporum species complex and related taxa. The second measure of branch support was obtained through Maximum Likelihood (ML) analysis of the same alignment using RAxML v. 8 (Stamatakis 2014) based on the GTR substitution model with gamma-distribution rate variation for each partition. Reference sequence were obtained from Lombard et al. (2019a) and Maryani et al. (2019). The tree is rooted to Fusarium foetens (CBS 120665). The analysis was performed using MrBayes v. 3.2.4 (Ronquist et al. 2012) based on the K80, K80 + G, HKY + G, and SYM + I + G nucleotide substitution models selected for CAL, RPB2, TEF1-α, and TUB2, respectively, using PAUP v. 4.0 (Swofford 2003) and MrModeltest v. 2.3. (Nylander 2009). Maximum likelihood bootstrap support values (MLBS) greater than 80% are placed above the nodes and Bayesian posterior probabilities (BYPP) equal to or greater than 0.95. Branches with BYPP = 1.00 and MLBS = 100% are thickened. Scale bar indicates the number of substitutions per nucleotide. Ex-type strains are in bold and newly sequence is in blue
Fig. 134
Fig. 134
Mariannaea camelliae (SDBR-CMU329, holotype). a Culture on PDA. b Culture on MEA. c Culture on OA. d, e Conidiophores and phialides. f Conidia. g Chlamydospores. Scale bars: ac = 1 cm, dg = 10 µm
Fig. 135
Fig. 135
Phylogenetic tree derived from maximum likelihood analysis of a combined ITS, LSU, TUB-2 and TEF1-α genes of 37 sequences and the aligned dataset was comprised of 2360 characters including gaps (ITS: 1–602, LSU: 603–1437, TUB-2: 1437–2061 and TEF1-α: 2062–2645). The average standard deviation of the split frequencies of the BI analysis was 0.002106. A best scoring RAxML tree was established with a final ML optimization likelihood value of − 14705.9596. The matrix had 1180 distinct alignment patterns with 33.94% undetermined characters or gaps. Estimated base frequencies were found to be: A = 0.2219, C = 0.2777, G = 0.2538, T = 0.2466; substitution rates AC = 1.4433, AG = 2.8971, AT = 1.5532, CG = 0.7904, CT = 5.2827, GT = 1.0000; proportion of invariable sites = 0.4850 and gamma distribution = 0.6770. Memnoniella echinata CBS 344.39 and Stachybotry chartarum CBS 129.13 were used as outgroup. Numbers above branches are the bootstrap statistics percentages (left) and Bayesian posterior probabilities (right). Branches with bootstrap values equal to or greater than 70% are shown at each branch and the bar represents 0.1 substitutions per nucleotide position. Hyphen (-) represents support values equal to or less than 70%/0.95. Ex-type strains are in bold and newly generated sequence is in blue
Fig. 136
Fig. 136
Thyronectria caudata (TASM 6160, KUN-HKAS 115784, new record). a, b Perithecial aggregates on host surface. c Longitudinal section of a perithecium. d Section of the peridium cells. e Paraphyses. fh Asci. i, j Ascospores. k Ascoconidia. Scale bars: c = 100 μm, d, fh = 20 μm, e, i, j = 10 μm, k = 5 μm
Fig. 137
Fig. 137
Phylogram generated from the best scoring of the RAxML tree based on combined LSU, ITS, ACT, BTUB and TEF1-α sequence dataset to indicate the taxa in Thyronectria. Forty-one strains are included in the combined analyses which comprise a total of 4040 characters. Hydropisphaera fungicola (CBS 122304) and Verrucostoma freycinetiae (TPP-h 523) are selected as the outgroup taxa. The best RAxML tree with a final likelihood value of − 28737.934247 is presented. RAxML analysis yielded 1441 distinct alignment patterns and 21.81% of undetermined characters or gaps. Estimated base frequencies were as follows: A = 0.218868, C = 0.290291, G = 0.260083, T = 0.230759, with substitution rates AC = 0.91049, AG = 2.312893, AT = 1.471029, CG = 0.955498, CT = 5.294875, GT = 1.000000; gamma distribution shape parameter alpha = 0.629127. Bootstrap support values for maximum likelihood (MLBS) equal to or greater than 70% is given above the nodes. Newly generated sequences are in blue
Fig. 138
Fig. 138
Phaeoisaria aquatica (MFLU 21-0071, new record). a Conidiomata synnemata on wood. b, c Conidiophores. df Conidiogenous cells. g, h Conidia. i Germinated conidium. j, k Culture on MEA from surface and reverse. Scale bars: b, c = 300 µm, df = 50 µm, g, h = 5 µm, i = 10 µm
Fig. 139
Fig. 139
Phaeoisaria synnematicus (AMH 10055, holotype). a Substrate (Bark of Azadirchta indica). b Colony morphology (front view). c Reverse view of colony. d, e Stereoscopic view of synnemata (in culture). f Numerous synnemata (slide culture microscopic view). g Synnema showing splaying conidiophores. h Numerous simple to catenate chlamydospores. i Persistent lateral to terminal produced sub-globose chlamydospores. j Enlarged view of conidiophores showing acropleurogenous conidiogenous cells and conidia. k Enlarged microscopic view of fusoid to clavate conidia and hyphae. l Curved and cylindrical guttulate conidia produced from small conidiophores. Scale bars: gl = 20 μm
Fig. 140
Fig. 140
Pleurotheciella dimorphospora (MFLU 20-0138, holotype; KUMCC 20-0185, ex-type). a Appearance of black, shiny conidia on host substrate. b Squash mount showing mycelia partly immersed in host substrate. c, d Conidiophores erect on host surface. e Black, muriform conidia on natural substrate. f Germinated conidium on WA. g Colony on PDA after 4 weeks. h Conidial masses induced on culture growing on PDA after 4 weeks. i, mo Dark brown, muriform conidia on PDA. jl Conidiogenous cells with attached conidia. p Hyaline, didymosporous conidia associated with dark brown, muriform conidia. q, r Conidiogenesis of hyaline conidia. sw Hyaline conidia. x, y Lateral and intercalary conidia. Scale bars: b, f, i, x = 50 μm, c, ln, q, y = 30 μm, d, e, k, o, p = 20 μm, j, rw = 10 μm
Fig. 141
Fig. 141
Maximum likelihood phylogenetic tree based on a combined LSU, ITS, SSU and RPB2 sequence data of genera in Pleurotheciaceae. Conioscypha peruviana CBS 137657 and C. pleiomorpha FMR 13,134 were selected as the outgroup taxa. Bootstrap support values for maximum likelihood (MLBS, left) equal to or greater than 70% is given above the nodes. Bayesian posterior probabilities (BYPP, right) equal to or greater than 95% are given above the nodes. Ex-type strains are in bold and newly generated sequences are in blue
Fig. 142
Fig. 142
Pseudodactylaria albicolonia (MFLU 21-0095, holotype). a Colony on decaying wood. bd Conidiophores with conidia. eg Conidiogenous cells with attached conidia. hk conidia. l Colony on MEA medium. Scale bars: bk = 10 µm
Fig. 143
Fig. 143
Phylogram generated from the best scoring of the RAxML tree based on combined LSU, ITS, sequence dataset to indicate the new species Pseudodactylaria albicolonia and related genera in Pseudodactylariales. Twenty-eight strains are included in the combined analysis, which comprise a total of 1306 characters. Arthrinium arundinis CBS 133509 and A. montagnei AFTOL ID-951 are selected as the outgroup taxa. The best RAxML tree with a final likelihood value of − 10010.943263 is presented. RAxML analysis yielded 664 distinct alignment patterns and 21.66% of undetermined characters or gaps. Estimated base frequencies were as follows: A = 0.246125, C = 0.236142, G = 0.297752, T = 0.219981, with substitution rates AC = 0.978864, AG = 2.183946, AT = 1.688622, CG = 0.686434, CT = 5.976862, GT = 1.000000; gamma distribution shape parameter alpha = 0.403195. Bootstrap support values for maximum likelihood (MLBS, left) equal to or greater than 70% is given above the nodes. Bayesian posterior probabilities (BYPP, right) equal to or greater than 0.95 are given above the nodes. Newly generated sequences are in blue and bold
Fig. 144
Fig. 144
Canalisporium caribense (MFLU 21-0072, new record). ac Sporodochia on wood. d, e Squash mount of sporodochia. f Conidiogenous cells with conidia. gj Conidia. k Germinated conidium. l, m Culture on PDA from surface and reverse. n Mycelium on PDA. Scale bars: ac = 20 μm, dn = 5 μm
Fig. 145
Fig. 145
Rhexoacrodictys nigrospora (MFLU 21-0073, holotype). a, b Conidiomata on the substrate. c Squash of mount of conidia. d Conidiophores with minutely conidiogenous cells. eg Conidia. h Germinated conidium. i, j Culture on PDA from surface and reverse. Scale bars: c, e, f = 10 µm, d, g = 20 µm
Fig. 146
Fig. 146
Maximum likelihood phylogenetic tree based on a combined LSU, ITS, SSU, TEF1-α and RPB2 sequence data of genera in Savoryellaceae. Conioscypha aquatica MFLUCC 18-1333 and C. submersa MFLU 18-1639 are selected as the outgroup taxa. Bootstrap support values for maximum likelihood (MLBS, left) equal to or greater than 70% is given above the nodes. Bayesian posterior probabilities (BYPP, right) equal to or greater than 0.95 are given above the nodes. Ex-type strains are in bold and newly generated sequences are in blue
Fig. 147
Fig. 147
Cercophora dulciaquae (MFLU 21-0122, holotype). ac Appearance of ascomata on host substrate. d Vertical section through ascoma. e Section of pycnidial wall. f Paraphyses. gl Asci. mr Ascospores with bipolar appendages (arrow). Scale bars: a, b = 1 mm, c, d = 500 μm, e, ir = 50 μm, f = 20 μm, g, h = 100 μm
Fig. 148
Fig. 148
Phylogenetic tree generated from maximum likelihood (ML) analysis based on combined LSU and ITS sequence data for the species from Lasiosphaeriaceae. Microthecium quadrangulatum (CBS 112763) and M. tenuissimum (CBS 112764) were used as outgroup taxa. The dataset comprised and 1243 characters after alignment including gaps (LSU = 828 bp and ITS = 415 bp). The RAxML analysis of the combined dataset yielded a best scoring tree with a final ML optimization likelihood value of − 4540.010304. The matrix had 520 distinct alignment patterns, with 17.16% undetermined characters or gaps. Estimated base frequencies were as follows: A = 0.243204, C = 0.239086, G = 0.300179, T = 0.217531; substitution rates AC = 1.598327, AG = 1.651124, AT = 2.172105, CG = 0.801233, CT = 6.709684, GT = 1.000000; gamma distribution shape parameter α = 0.254987. Bootstrap support values for ML and MP equal to or greater than 60% and BYPP equal to or greater than 0.90 are given above the nodes. The newly generated sequence is in blue and bold
Fig. 149
Fig. 149
Khaleijomyces umikazeanus (CBS H-23860, holotype). a Squash of ascoma. b Vertical section through ascoma. c Close up of neck show periphyses. d Close up of peridium. e, f Asci and paraphyses. g Ascal tips. h, i Ascospores with amorphous material. Scale bars: a, b = 60 µm, c, d, gi = 10 µm, e, f = 15 µm
Fig. 150
Fig. 150
Phylogenetic relationship of Khaleijomyces umikazeanus with related taxa in Juncigenaceae based on the nucleotide sequences of the combined SSU and LSU rDNA. The maximum likelihood (ML) tree (-ln likelihood = 14429.06) was constructed in PAUP 4 (Swofford 2002). The maximum parsimonious data set of the combined genes consisted of 35 taxa with 3 representatives of Xylariales used as outgroup. The combined dataset includes 1116 total characters, of which 712 were constant, 89 parsimony-uninformative and 315 parsimony-informative. The parsimony analyses of the data matrix yielded 2 equally most parsimonious trees with a tree length of 1084 steps [consistency index (CI) = 0.5424, homoplasy index (HI) = 0.4576, retention index (RI) = 0.7385, rescaled consistency index (RC) = 0.4005]. Phylogenetic trees obtained from ML, maximum parsimony (MP) and Bayesian inference posterior probabilities (BYPP) were similar in topology. Bootstrap support on the nodes represents MLBS and MPBS equal to or greater than 50%. Branches with a BYPP of equal to or greater than 0.95 are in bold. The newly taxon is in yellow box
Fig. 151
Fig. 151
Eutypa flavovirens (MFLU 19-0717, new record). a, b Stromata on substrate. c Cross-section of stroma. d, e Vertical section through stromata showing ostiolar canals. f Peridium. g Paraphyses. hk Asci. lo Ascospores. p, q Culture on PDA from above and below. Scale bars: a = 500 μm, b, c = 200 μm, d = 100 μm, e = 50 μm, hl = 20 μm, fg = 10 μm, mo = 5 μm
Fig. 152
Fig. 152
Eutypa lata (MFLU 19-0501, new record). a, b Stromata on substrate. c Cross-section of ascoma. d Ostiole. e Peridium. f Paraphyses. gi Asci. jl Ascospores. m, n Culture on PDA from above and below. Scale bars: a = 200 μm, b, c = 100 μm, d = 50 μm, f, h, i = 20 μm, e, g = 10 μm, jl = 5 μm
Fig. 153
Fig. 153
Phylogram generated from maximum likelihood analysis based on combined ITS and TUB2 sequence data representing Diatrypaceae in Xylariales. Related sequences are taken from Konta et al. (2020) and additions according to the BLAST searches in NCBI. Hundred and twenty-nine strains are included in the combined analyses which comprised 1180 characters (665 characters for ITS and 515 characters for TUB2) after alignment. Kretzschmaria deusta (CBS 826.72) and Xylaria hypoxylon (CBS 122620) in Xylariaceae (Xylariales) were used as the outgroup taxa. The best scoring RAxML tree with a final likelihood value of − 17362.853779 is presented. The matrix had 906 distinct alignment patterns, with 37.13% of undetermined characters or gaps. Estimated base frequencies were as follows: A = 0.224946, C = 0.263658, G = 0.237000, T = 0.274396; substitution rates: AC = 1.093989, AG = 3.037146, AT = 1.238822, CG = 0.814851, CT = 4.048082, GT = 1.000000; gamma distribution shape parameter α = 0.183977. Bootstrap support values for ML equal to or greater than 75% are given above the nodes (left side). Bayesian posterior probabilities (BYPP) equal to or greater than 0.95 are given above the nodes (right side). Ex-type strains are in bold and newly generated sequences are in blue
Fig. 153
Fig. 153
Phylogram generated from maximum likelihood analysis based on combined ITS and TUB2 sequence data representing Diatrypaceae in Xylariales. Related sequences are taken from Konta et al. (2020) and additions according to the BLAST searches in NCBI. Hundred and twenty-nine strains are included in the combined analyses which comprised 1180 characters (665 characters for ITS and 515 characters for TUB2) after alignment. Kretzschmaria deusta (CBS 826.72) and Xylaria hypoxylon (CBS 122620) in Xylariaceae (Xylariales) were used as the outgroup taxa. The best scoring RAxML tree with a final likelihood value of − 17362.853779 is presented. The matrix had 906 distinct alignment patterns, with 37.13% of undetermined characters or gaps. Estimated base frequencies were as follows: A = 0.224946, C = 0.263658, G = 0.237000, T = 0.274396; substitution rates: AC = 1.093989, AG = 3.037146, AT = 1.238822, CG = 0.814851, CT = 4.048082, GT = 1.000000; gamma distribution shape parameter α = 0.183977. Bootstrap support values for ML equal to or greater than 75% are given above the nodes (left side). Bayesian posterior probabilities (BYPP) equal to or greater than 0.95 are given above the nodes (right side). Ex-type strains are in bold and newly generated sequences are in blue
Fig. 154
Fig. 154
Xylaria apiospora (NFCCI-4370, holotype). a Stromata on decaying host. b, c Horizontal section of stromata. d Paraphyses. eh Asci. i Striations on stromatal surface. j Cross section of stroma. k Peridium. lq Ascospores. Scale bars: b = 100 μm, c, j, k = 50 μm, dh = 20 μm, lq = 10 μm
Fig. 155
Fig. 155
Xylaria haemorrhoidalis (NFCCI-4369, new record) a Stromata on decaying host. b, c Horizontal section of ascoma. d Peridium. e Paraphyses. fh Asci. i Hyphae on stromata surface. j, k Ascospores. Scale bars: c = 200 μm, d, h, i = 50 μm, eg = 20 μm, k, n = 10 μm
Fig. 156
Fig. 156
Maximum parsimony tree of Xylariaceae constructed by using the ITS sequence. The tree includes both ML and MP values. Rosellinia australiensis is selected as an outgroup taxon. RAxML analysis yielded a minimum scoring tree with a final ML optimization likelihood value of − 5854.053127. The matrix had 393 distinct alignment patterns with 10.20% of undetermined characters or gaps. The maximum parsimonious dataset consists of 626 characters of which 278 were constant, 233 parsimony-informative and 115 parsimony-uninformative. The parsimony analysis of the data matrix resulted in one thousand equally parsimonious trees with a length of 1041 steps (CI 0.540, RI = 0.829, RC 0.447, HI = 0.460) in the first tree. The overall topology of the phylogenetic trees resulted from ML and MP were similar and incongruent in with earlier studies. The phylogenetic analysis showed that Xylaria haemorrhoidalis NFCC-4369 nested with Xylaria haemorrhoidalis 89041207 with 100% MLBS and 100% MPBS support. Similarly, Xylaria apiospora NFCC-4370 branched with Xylaria multiplex 1010 with week bootstrap support of MPBS. The newly generated sequences are indicated in blue bold
Fig. 157
Fig. 157
Melanographium smilacis (MFLU 21-0075, holotype). a, b Appearance of colonies on natural substrate. c, d Squash mount of conidiophores with attached conidia. e, f Close-up of conidiophores showing septation with paler at the apex. g, h Apex of conidiophores with developing conidia. il Conidia with a basal scar. m Germinated conidium. n, o Culture on MEA from surface and reverse. Scale bars: b = 100 µm, c, d = 200 µm, eh = 50 µm, il = 5 µm, m = 10 µm
Fig. 158
Fig. 158
Maximum likelihood phylogenetic tree based on a combined LSU and ITS sequence data of Melanographium taxa and related genera. The tree is rooted with Fasciatispora calami (MFLUCC 15-0294) and F. cocoes (MFLUCC 18-1445). Bootstrap support values for maximum likelihood (MLBS, left) equal to or greater than 70% is given above the nodes. Bayesian posterior probabilities (BYPP, right) equal to or greater than 0.95 are given above the nodes. Ex-type strains are in bold and newly generated sequence is in blue
Fig. 159
Fig. 159
Basidiomata of Chlorophyllum demangei (HNL502498, new record)
Fig. 160
Fig. 160
Microcharacters of Chlorophyllum demangei (HNL502498). a Basidiospores. b Basidia. c Cheilocystidia. d Element cells at pileus covering. Scale bars: ac = 10 µm, d = 20 µm
Fig. 161
Fig. 161
Chlorophyllum globosum (HNL503445, new record). ac Basidiomata
Fig. 162
Fig. 162
Microcharacters of Chlorophyllum demangei (HNL503445). a Basidiospores. b basidia. c Cheilocystidia. d Element cells at pileus covering. Scale bars: ac = 10 µm, d = 20 µm
Fig. 163
Fig. 163
Chlorophyllum hortense (HNL502149, new record). a, b Basidiomata
Fig. 164
Fig. 164
Microcharacters of Chlorophyllum hortense (HNL502149). a Basidiospores. b Basidia. c Cheilocystidia. d Element cells at pilus covering. Scale bars: ac = 10 µm, d = 20 µm
Fig. 165
Fig. 165
Maximum likelihood phylogenetic tree of Chlorophyllum based on nrITS sequences. The maximum likelihood (ML) analysis was performed in RAxML 7.2.6 (Stamatakis et al. 2008) and maximum parsimony (MP) analysis was performed the program PAUP* 4.0 b10 (Swofford 2004). Bootstrap values of ML/MP equal to or greater than 70% are given above branches. GenBank accession number is indicated after species name. Agaricus bisporus (FJ223228) is an outgroup. The three shows six different sections. Newly sequences generated from Laos are in blue
Fig. 166
Fig. 166
Micropsalliota globocystis (HNL501777, new record). a, b Basidiomata
Fig. 167
Fig. 167
Microcharacters of Micropsalliota globocystis (HNL501777). a Basidiospores. b Cheilocystidia. c Element cells at pileus covering. Scale bars: a = 5 µm, b = 10 µm, c = 20 µm
Fig. 168
Fig. 168
Micropsalliota gracilis (HNL503436, new record). ac Basidiomata
Fig. 169
Fig. 169
Microcharacters of Micropsalliota grcilis (HNL503436). a Basidiospores. b Cheilocystidia. c Element cells at pileus covering. Scale bars: a = 5 µm, b = 10 µm, c = 20 µm
Fig. 170
Fig. 170
Maximum likelihood phylogenetic tree of Micropsalliota based on nrITS sequences. The maximum likelihood (ML) analysis was performed in RAxML 7.2.6 (Stamatakis et al. 2008) and maximum parsimony (MP) analysis was performed the program PAUP* 4.0 b10 (Swofford 2004). Bootstrap values of ML/MP equal to or greater than 70% are given above branches. GenBank accession number is indicated after species name. Leucoagaricus meleagris (MT252565) is an outgroup. Newly sequences generated from Laos are in blue
Fig. 171
Fig. 171
Xanthagaricus necopinatus (HNL502083, new record). a, b Basidiomata
Fig. 172
Fig. 172
Microcharacters of Xanthagaricus necopinatus (HNL502083). a Basidiospores. b Cheilocystidia. c Basidia. d Element cells at pileus covering. Scale bars: a = 5 µm, bd = 10 µm
Fig. 173
Fig. 173
Maximum likelihood phylogenetic tree of Xanthagaricus based on nrITS sequences. The maximum likelihood (ML) analysis was performed in RAxML 7.2.6 (Stamatakis et al. 2008) and maximum parsimony (MP) analysis was performed the program PAUP* 4.0 b10 (Swofford 2004). Bootstrap values of ML/MP equal to or greater than 70% are given above branches. GenBank accession number is indicated after species name. Clarkeinda trachodes (HM488751) is an outgroup. Newly sequences generated from Laos is in blue
Fig. 174
Fig. 174
Saproamanita manicata (SDBR-CMU-NK0356, new record). a Basidiomata. b Basidiospores. c Basidia. Scale bars: a = 5 cm, b = 5 µm, c = 10 µm
Fig. 175
Fig. 175
Phylogenetic tree derived from maximum likelihood analysis of a combined ITS, LSU and TEF1-α genes of 26 sequences and the aligned dataset was comprised of 2352 characters including gaps (ITS: 1–923, LSU: 924–1788 and TEF1-α: 1789–2352). The average standard deviation of the split frequencies of the BI analysis was 0.00535. A best scoring RAxML tree was established with a final ML optimization likelihood value of − 10465.4175. The matrix had 949 distinct alignment patterns with 48.95% undetermined characters or gaps. Estimated base frequencies were found to be: A = 0.2711, C = 0.2011, G = 0.2422, T = 0.2850; substitution rates AC = 1.2478, AG = 2.7197, AT = 1.6015, CG = 0.6534, CT = 3.9595, GT = 1.0000; proportion of invariable sites = 0.0700 and gamma distribution = 1.0010. Amanita phalloides HKAS75773 and Amanita vestita HKAS75773 were used as outgroup. Numbers above branches are the bootstrap statistics percentages equal to or greater than 70% (MLBS, left) and Bayesian posterior probabilities equal to or greater than 0.95 (BYPP, right). Ex-type strains are in bold and newly generated sequence is in blue
Fig. 176
Fig. 176
Cortinarius alutarius (LOD(F):47001, holotype). a Basidiomata. b Basidiospores. c Pileipellis structure. d, e Ascending elements of pileipellis. Scale bars: a = 20 mm, b = 10 µm, ce = 20 µm
Fig. 177
Fig. 177
Cortinarius mammillatus (LOD(F):48001, holotype). a Basidiomata. b Basidiospores. c Pileipellis structure. Scale bars: a = 20 mm, b = 10 µm, c = 20 µm
Fig. 178
Fig. 178
Cortinarius mammillatus—additional collections (basidiomata). a H:7000935. b H:7000963. c LOD(F):48003. d LOD(F):48004. e LOD(F):48002. f LOD(F):48002a. Notes: Photographs: a, b K. Liimatainen, cf I.L. Kałucka
Fig. 179
Fig. 179
Cortinarius quercoflocculosus (LOD(F):47002, holotype). a Basidiomata. b Basidiospores. c Oleiferous hypha in trama. d Pileipellis structure. Scale bars: a = 20 mm, b = 10 µm, c, d = 20 µm
Fig. 180
Fig. 180
Phylogram resulting from the RAxML (Stamatakis 2014) analysis of ITS region. Bootstrap values equal to or greater than 50% are indicated above the nodes. The specimens in boldface represent the type specimens of the species. The newly generated sequences are in blue
Fig. 181
Fig. 181
Laccaria populina (GDOR 411, holotype). a Basidiomata in the field. b Section of stem. c Stipitipellis in KOH 3%. d Section of gills in Phloxin B. e Pileipellis in Phloxin B. f Basidiospore in KOH 3%. g Basidia in Phloxin B. h terminal elements of pileipellis in KOH 3%. Scale bars: c, e, g, h = 50 µm, d = 100 µm, f = 10 µm
Fig. 182
Fig. 182
Phylogram generated from maximum likelihood analysis based on LSU and ITS sequence data representing Laccaria of northern hemisphere and tropical areas. Related sequences aretaken from previous studies (Wilson et al. ; Popa et al. ; Luo et al. ; Ramos et al. ; Vincenot et al. ; Cho et al. ; Wang et al. 2019b). One hundred fifty-six strains are included in the combined analyses which comprise 1624 characters. Mythicomyces corneipes (AFTOL ID972) is used as the outgroup taxa. Single gene analyses were also performed to compare the topology and clade stability with combined gene analyses. Tree topology of the maximum likelihood analysis is similar to the Bayesian analysis. The best RaxML tree with a final likelihood values of − 9283.670199 is presented. Estimated base frequencies for the two partitions were as follows: the ITS partition A = 0.248432, C = 0.203290, G = 0.210151, T = 0.338126; substitution rates AC = 1.729861, AG = 6.506286, AT = 2.326472, CG = 0.685905, CT = 5.294619, GT = 1.000000, gamma distribution shape parameter α = 0.357610; the LSU partition A = 0.269370, C = 0.185989, G = 0.290996, T = 0.253645; substitution rates AC = 1.151721, AG = 25.007835, AT = 2.282933, CG = 0.751032, CT = 11.631350, GT = 1.000000, gamma distribution shape parameter α = 0.144016. Bootstrap values for maximum likelihood (MLBS) equal to or greater than 70% and clade credibility values greater than 0.95 (the rounding of values to 2 decimal proportions) from Bayesian-inference analysis labeled on the nodes. Ex-type strains are in bold and newly generated sequences are in blue
Fig. 182
Fig. 182
Phylogram generated from maximum likelihood analysis based on LSU and ITS sequence data representing Laccaria of northern hemisphere and tropical areas. Related sequences aretaken from previous studies (Wilson et al. ; Popa et al. ; Luo et al. ; Ramos et al. ; Vincenot et al. ; Cho et al. ; Wang et al. 2019b). One hundred fifty-six strains are included in the combined analyses which comprise 1624 characters. Mythicomyces corneipes (AFTOL ID972) is used as the outgroup taxa. Single gene analyses were also performed to compare the topology and clade stability with combined gene analyses. Tree topology of the maximum likelihood analysis is similar to the Bayesian analysis. The best RaxML tree with a final likelihood values of − 9283.670199 is presented. Estimated base frequencies for the two partitions were as follows: the ITS partition A = 0.248432, C = 0.203290, G = 0.210151, T = 0.338126; substitution rates AC = 1.729861, AG = 6.506286, AT = 2.326472, CG = 0.685905, CT = 5.294619, GT = 1.000000, gamma distribution shape parameter α = 0.357610; the LSU partition A = 0.269370, C = 0.185989, G = 0.290996, T = 0.253645; substitution rates AC = 1.151721, AG = 25.007835, AT = 2.282933, CG = 0.751032, CT = 11.631350, GT = 1.000000, gamma distribution shape parameter α = 0.144016. Bootstrap values for maximum likelihood (MLBS) equal to or greater than 70% and clade credibility values greater than 0.95 (the rounding of values to 2 decimal proportions) from Bayesian-inference analysis labeled on the nodes. Ex-type strains are in bold and newly generated sequences are in blue
Fig. 183
Fig. 183
Hygrocybe boertmannii (US 1552, holotype). a Fresh basidiomata in the field. b Pileus surface with fine squamules. c Lamellae with lamellulae d Cystidia-like hyphoid elements. e Transverse section through hymenium showing basidia and basidiospores. f Terminal elements of pileipellis. Scale bars: a = 25 mm, d, e = 10 µm, f = 20 µm
Fig. 184
Fig. 184
Phylogenetic analyses were based on data set of nrITS sequences. Reference sequences were selected from relevant literature (Lodge et al ; Singh et al. 2017), BLAST searches (Altschul et al. 1997) and data retrieved from GenBank (Clark et al. 2016). Species of Hygroaster are selected as the outgroup taxa (Lodge et al ; Singh et al. 2017). Multiple sequence alignment was performed using MAFFT v.7 (Katoh and Standley 2013). Alignments were manually edited in BioEdit v 7.2.5 (Hall 1999). To change the multiple alignment format, Alignment Transformation Environment (ALTER) was used (Glez-Peña et al. 2010). Maximum Likelihood analysis was performed with the programme RAxML GUI 1.5 (Silvestro and Michalak 2012). One thousand bootstrap replicates were analysed to obtain nodal support values. Bayesian inference was computed independently twice in MrBayes v.3.2.2 (Ronquist et al. 2012), under different models. The best-fit substitution model of nucleotide evolution was carried out in MrModeltest 3.7 (Posada and Crandall 1998). Bayesian posterior probabilities (BPP) were calculated in two simultaneous runs with Markov chain Monte Carlo (MCMC) algorithm (Larget and Simon 1999). Markov chains were run for 10 million generations, saving a tree every 100th generation. Default settings in MrBayes were used for the incremental heating scheme for the chains (3 heated and 1 cold chain), unconstrained branch length [unconstrained: exponential (10.0)] and uniformative topology (uniform) priors. The first 25% of trees was discarded as burnin (Hall 2004). Ex-type strains are in black bold and newly generated sequences are indicated in blue
Fig. 185
Fig. 185
Field pictures of the basidiomata. a, b Marasmius benghalensis (CUH AM214, holotype), habitats of basidiomata and lower side of the pileus showing lamellae features. Scale bars: a, b = 10 mm
Fig. 186
Fig. 186
Marasmius benghalensis (CUH AM214, holotype). a Basidiospores. b Basidioles. c Cheilocystidia. d Siccus-type pileipellis cells. e Caulocystidia. Scale bars: ac = 5 μm, de = 10 μm
Fig. 187
Fig. 187
Phylogram generated from maximum likelihood (ML) analysis based on nrDNA ITS sequence data of Marasmius species using best-fit model (HKY + G) with Bayesian Information Criterion (BIC) value of 14371.193718. Related sequences are mostly taken from Wannathes et al. (2009) and Antonín et al. (2012). Thirty-six taxa of Marasmius and one outgroup taxon are included in the analyses comprising 742 characters after alignment. Crinipellis dipterocarpi is used as the outgroup taxon following Wannathes et al. (2009). Bayesian analysis (BA) reached a standard deviation of split frequencies of 0.004984 after 106 generations and produced 11210 credible set of trees after discarding initial 3,792 trees as burnin phase. Tree topology of the ML analysis is similar to the BA. The best RaxML tree with a final likelihood values of − 6870.939953 is presented. The matrix had 483 distinct alignment patterns, with 17.46% proportion of gaps and completely undetermined characters. Estimated base frequencies were as follows: A = 0.2461, C = 0.2043, G = 0.2006, T = 0.3490; gamma distribution shape parameter = 0.4030. ML Bootstrap values (MLBS) equal or greater than 50% (on the left of ‘/’) and posterior probabilities (BYPP) values equal or greater than 0.50 (on the right of ‘/’) from BA are labeled above or below the nodes. The newly generated sequences are in blue bold. Representative sections and series of the Marasmius taxa are marked in the right side
Fig. 188
Fig. 188
Marasmius jinfoshanensis (HGASMF 01-4344, holotype): Basidiomata of on decaying leaves of dicotyledons in the litter in a subtropical-montane forest
Fig. 189
Fig. 189
Marasmius jinfoshanensis (HGASMF 01-4344, holotype): Microscopic structures. a Basidiospores. b Basidia. c Cheilocystidia. d Pileipellis. Scale bar: d = 10 μm
Fig. 190
Fig. 190
Maximum likelihood tree inferred from ITS-LSU nrDNA, using RAxML GUI v. 2.0.0 (Edler et al. 2020), showing the placement of Marasmius jinfoshanensis. Support values (> 50% with 1,000 replicates) are shown above branches. Marasmius ruforotula (FJ936150, FJ936152, MK278352) and M. siccus (FJ904985, JN943596) were chosen as outgroup. Ex-type strain is in bold and newly generated sequences are in blue
Fig. 191
Fig. 191
Field pictures of the basidiomata. a, b Marasmius subtropicus (CUH AM226, holotype), habitats of basidiomata and lamellae showing intervenose nature. Scale bars: a, b = 10 mm
Fig. 192
Fig. 192
Marasmius subtropicus (CUH AM226, holotype). a Basidiospores. b basidia. c Siccus-type cheilocystidia. d Siccus-type pileipellis cells. Scale bars: ad = 5 μm
Fig. 193
Fig. 193
Phylogram generated from maximum likelihood (ML) analysis based on nrDNA ITS sequence data of Marasmius species using best-fit model (HKY + G) with Bayesian Information Criterion (BIC) value of 14371.193718. Related sequences are mostly taken from Wannathes et al. (2009) and Antonín et al. (2012). Thirty-six taxa of Marasmius and one outgroup taxon are included in the analyses comprising 742 characters after alignment. Crinipellis dipterocarpi is used as the outgroup taxon following Wannathes et al. (2009). Bayesian analysis (BA) reached a standard deviation of split frequencies of 0.004984 after 106 generations and produced 11210 credible set of trees after discarding initial 3,792 trees as burnin phase. Tree topology of the ML analysis is similar to the BA. The best RAxML tree with a final likelihood values of 6870.939953 is presented. The matrix had 483 distinct alignment patterns, with 17.46% proportion of gaps and completely undetermined characters. Estimated base frequencies were as follows: A = 0.2461, C = 0.2043, G = 0.2006, T = 0.3490; gamma distribution shape parameter = 0.4030. ML Bootstrap values (MLBS) equal or greater than 50% (on the left of ‘/’) and posterior probabilities (BYPP) values equal or greater than 0.50 (on the right of ‘/’) from BA are labeled above or below the nodes. The newly generated sequences are in blue bold. Representative sections and series of the Marasmius taxa are marked in the right side
Fig. 194
Fig. 194
Cruentomycena uttarakhandina (US 1510, holotype). a Habitat. b Basidiomata. c Basidiospores d Transverse section through hymenium showing basidia, pleurocystidia and lamellar trama. e Cheilocystidia. f Pleurocystidia. g Caulocystidia. Scale bars: a = 20 mm, b = 10 mm, c, eg = 10 µm, d = 25 µm
Fig. 195
Fig. 195
Phylogenetic analyses were based on data set of nrITS sequences. Reference sequences were selected from relevant literature (Petersen et al. 2008), BLAST searches (Altschul et al. 1997) and data retrieved from GenBank (Clark et al. 2016). Species of Mycena are selected as the outgroup taxa (Petersen et al. 2008). Multiple sequence alignment was performed using MAFFT v.7 (Katoh and Standley 2013). Alignments were manually edited in BioEdit v 7.2.5 (Hall 1999). To change the multiple alignment format, Alignment Transformation Environment (ALTER) was used (Glez-Peña et al. 2010). Maximum Likelihood analysis was performed with the programme RAxML GUI 1.5 (Silvestro and Michalak 2012). One thousand bootstrap replicates were analysed to obtain nodal support values. Bayesian inference was computed independently twice in MrBayes v.3.2.2 (Ronquist et al. 2012), under different models. The best-fit substitution model of nucleotide evolution was carried out in MrModeltest 3.7 (Posada and Crandall 1998). Bayesian posterior probabilities (BYPP) were calculated in two simultaneous runs with Markov chain Monte Carlo (MCMC) algorithm (Larget and Simon 1999). Markov chains were run for 10 million generations, saving a tree every 100th generation. Default settings in MrBayes were used for the incremental heating scheme for the chains (3 heated and 1 cold chain), unconstrained branch length [unconstrained: exponential (10.0)] and uniformative topology (uniform) priors. The first 25% of trees was discarded as burnin (Hall 2004). Ex-type strain is in bold and newly generated sequences are in blue
Fig. 196
Fig. 196
Cyathus uniperidiolus (AMH-10196, holotype, NFCCI-4697 ex-type culture). a Substrate (stem of Muhlenbergia sp. with attached basidiocarps). b Basidiocarps bearing single globose peridiole. c Globose peridioles with shiny surfaces. d Sections of peridioles showing emptied cavity inside. e Transverse section of basidiocarp showing different layers, innermost region showed emptied. f Transverse section of peridiole showing layer of cortex and sub-cortex (a part view). g Terminal and subterminal thick-walled encrusted loose and interwoven cells of basidiocarp. h Hymenial layer with hyphae and basidiospores. i Enlarged view of basidiospores. j Colony morphology on MEA (front view). k Colony with developing basidiocarps. l Harvested basidiocarps with velvety surfaces from culture. m Hyphae with clamps. Scale bars: fi, m = 10 μm
Fig. 197
Fig. 197
Phylogram generated from maximum likelihood analysis for Cyathus uniperidiolus (NFCCI: 4697) using combined ITS and LSU sequence data based on the General Time Reversible model (Nei and Kumar 2000). A discrete Gamma distribution was used to model evolutionary rate differences among sites (5 categories (+ G, parameter = 0.2814)). Bootstrap support values are indicated at the nodes and values below 50% are not shown. Phylogenetics analyses were conducted in MEGA7 (Kumar et al. 2016). Nidula niveotomentosa SWFC 3000, Crucibulum leave SWFC 21,261 and Cystoderma amianthinum AFTOL-ID 1553 were used as outgroup. Type specimens are in bold and newly sequence is in blue
Fig. 198
Fig. 198
Marasmiellus palmivorus (SDBR-CMU-NK076, new record). a Basidiomata. b Basidiospores. c Basidia. d Cheilocystidia. e Caulocystidia. Scale bars: a = 1 cm, be = 10 μm
Fig. 199
Fig. 199
Phylogenetic tree derived from maximum likelihood analysis of a combined ITS, and LSU genes of 22 sequences and the aligned dataset was comprised of 2070 characters including gaps (ITS: 1–1120 and LSU: 1121–2070). The average standard deviation of the split frequencies of the BI analysis was 0.00731. A best scoring RAxML tree was established with a final ML optimization likelihood value of − 10104.6944. The matrix had 806 distinct alignment patterns with 56.72% undetermined characters or gaps. Estimated base frequencies were found to be: A = 0.2519, C = 0.1827, G = 0.2462, T = 0.3193; substitution rates AC = 1.0427, AG = 3.9637, AT = 1.7229, CG = 0.7530, CT = 4.8493, GT = 1.0000; proportion of invariable sites = 0.0510 and gamma distribution = 0.4750. Gymnopus nebrevipes TFB14505 and Gynnopus pygmaeus URM90003 were used as outgroup. Numbers above branches are the bootstrap statistics percentages equal to or greater than 70% (MLBS, left) and Bayesian posterior probabilities equal to or greater than 0.95 (BYPP, right). Ex-type strains are in bold and newly generated sequence is in blue
Fig. 200
Fig. 200
Coprinellus punjabensis (LAH35321, holotype). a Fresh basidiomata. b Basidiospores. c–e Veil elements. f Hymenium having immature and mature basidia. g A mature basidium with sharp strigmata. h Pileipellis. Microscopic structures were captured after stain with Congo red. Scale bars: a = 10 mm, b = 10 µm, cg = 20 µm, h = 15 µm
Fig. 201
Fig. 201
Phylogram generated from maximum likelihood analysis based on ITS sequence data representing Coprinellus punjabensis (MT180990) and related species. Related sequences are taken from Hussain et al. (2018). Fifty-five sequences are included in the analysis which comprise 708 characters after alignement. Psathyrella candolleana (KJ917666) is used as the outgroup taxon. The best RAxML tree with a final likelihood values of − 4869.810366 is presented. The matrix had 351 distinct alignment patterns, with 15.82% undetermined characters or gaps. Estimated base frequencies were as follows: A = 0.233377, C = 0.241159, G = 0.233394, T = 0.292070; substitution rates AC = 1.849754, AG = 2.784571, AT = 1.813146, CG = 1.135142, CT = 1.135142, GT = 1.000000; gamma distribution shape parameter α = 0.294349. Bootstrap values for maximum likelihood (MLBS) equal to or greater than 75%. The newly generated sequence is in blue bold
Fig. 202
Fig. 202
Geastrum gorgonicum (MA-Fungi 92118, holotype). a, b Fresh basidiomata in field. c, d Rhizomorphs with acicular crystals. e, f Basidiospores. Scale bars: a = 1 cm, b = 5 mm, c = 10 µm, df = 2 µm
Fig. 203
Fig. 203
Phylogram generated from Bayesian analysis based on ITS and LSU nrDNA sequence data representing Geastrum from Section Corollina, with G. pleosporum from Sect Micelistroma as outgroup. Related sequences are mainly taken from Zamora et al. (2014). Twenty-three sequences are included in the combined analyses, which comprise 1561 characters. Maximum parsimony (MP) and maximum likelihood (ML) analyses were undertaken; MP and ML tree topologies (not shown) were similar to the Bayesian one. Bootstrap values for MP and ML equal to or greater than 50%, and clade credibility values greater than 0.90 (the rounding of values to 2 decimal places) from Bayesian-inference analysis are labeled on the nodes. The newly generated sequences are in blue bold
Fig. 204
Fig. 204
Geastrum hansagiense (BP110893, holotype). a Habitat of G. hansagiense. b Basidiomata. c Columella. d Peristome. e Basidiospore under SEM f Basidiospores and eucapillitium under LM. Scale bars: e = 1 µm, f = 6 µm
Fig. 205
Fig. 205
Maximum likelihood (ML) phylogenetic tree of Geastrum species derived from concatenated internal transcribed spacer (ITS) and 28S rRNA (LSU) regions. Analysis was performed by RAxML under GTR + GAMMA model. Myriostoma coliforme (KC582020) is selected as the outgroup taxon. ML bootstrap values were obtained from 1000 replicates and values greater than 70% were indicated. The scale bar represents 0.007 expected nucleotide changes per site. The novel species are in blue, holotype specimen is in bold, herbarium numbers and NCBI Accession Numbers in brackets
Fig. 206
Fig. 206
Hyphodontia yunnanensis (CL Zhao 6804, holotype). a, b Basidiomata. Scale bars: a = 2 cm, b = 3 mm
Fig. 207
Fig. 207
Hyphodontia yunnanensis (drawn from the holotype), microscopic structures. a Basidiospores. b Basidia and basidioles. c Cystidia. d A section of aculei trama. Scale bars: ad = 10 µm
Fig. 208
Fig. 208
Maximum parsimony strict consensus tree of Hyphodontia yunnanensis and related species in Hyphodontia based on ITS sequences. The ITS dataset included sequences from 38 fungal specimens representing 24 taxa. Fibrodontia gossypina (GEL 5042) was selected as an outgroup for phylogenetic analyses of ITS phylogenetic trees (Zhao et al. 2014). The PCR procedure and editing the DNA sequences and approaches to phylogenetic analysis from maximum parsimony, maximum Likelihood (ML) and Bayesian inference (BI) followed previous studies (Dai ; Zhao and Wu ; Cui et al. 2019).The dataset had an aligned length of 755 characters in the dataset, of which 307 characters are constant, 92 are variable and parsimony-uninformative, and 356 are parsimony-informative. Maximum parsimony analysis yielded 1 equally parsimonious tree (TL = 1954, CI 0.4417, HI = 0.5583, RI = 0.6329, RC = 0.2795). Best model for ITS estimated and applied in the Bayesian analysis: GTR + I + G, lset nst = 6, rates = invgamma; prset statefreqpr = dirichlet (1,1,1,1). Bayesian analysis resulted in the similar topology with an average standard deviation of split frequencies = 0.009980 (BI). The ITS region was amplified with primer pairs ITS5 and ITS4 (White et al. 1990). Branches are labeled with maximum likelihood bootstrap values greater than 70% (MLBS), parsimony bootstrap values higher than 50% (MPBS) and Bayesian posterior probabilities greater than 0.95 (BYPP), respectively
Fig. 209
Fig. 209
Odontia huanrenensis (Yuan 10663, holotype): Basidiomata
Fig. 210
Fig. 210
Odontia huanrenensis (Yuan 10663, holotype): SEM of basidiospores
Fig. 211
Fig. 211
Odontia huanrenensis (drawn from the holotype), microscopic structures. a Section through basidiomata. b Section through rhizomorph. c Basidiospores in frontal and lateral view
Fig. 212
Fig. 212
Odontia parvispina (Yuan 10652, holotype): Basidiomata
Fig. 213
Fig. 213
Odontia parvispina (Yuan 10652, holotype): SEM of basidiospores
Fig. 214
Fig. 214
Odontia parvispina (drawn from the holotype), microscopic structures. a Section through basidiomata. b Section through rhizomorph. c Basidiospores in frontal and lateral view
Fig. 215
Fig. 215
Maximum likelihood tree illustrating the phylogeny of Odontia huanrenensis, O. parvispina and related taxa based on ITS sequence dataset. Fifty sequences are included in the analyses. Polyzellus multiplex SMI299 was selected as the outgroup taxa. Branches are labeled with maximum likelihood bootstrap support greater than 50% (MLBS), parsimony bootstrap proportions greater than 50% (MPBS) and Bayesian posterior probabilities greater than 0.95 (BYPP). The new species and new record are in bold
Fig. 216
Fig. 216
Hyphoderma australosetigerum (13970MD, MA-Fungi 92235, holotype). a Basidiomata dry specimen. b Hymenophore. c Septate cystidium. d Septate and encrusted cystidium. e Basal hyphae thick-walled, with clamps. f Basidium and probasidia. g Spores. Scale bars: a, b = 5 mm, ce = 20 µm, fg = 10 µm
Fig. 217
Fig. 217
Phylogram generated from Bayesian analysis based on newly-generated ITS sequence data and including sequences mainly from Nilsson et al. (2003) and Yurchenko and Wu (2014); Cerrena unicolor, Panus lecomtei, Spongipellis delectans and S. pachyodon are included as outgroup. The alignment comprises 701 characters. Maximum parsimony (MP) and maximum likelihood (ML) analyses were also performed; the tree topologies were similar to the Bayesian one. Bootstrap values for MP and ML analyses equal to or greater than 50%, and posterior probabilities of the Bayesian analysis are labeled on the nodes. The newly generated sequence is in blue bold
Fig. 218
Fig. 218
Efibula rodriguezarmasiae (17681Tell., MA-Fungi 86635, holotype). a Basidiomata dry specimen. b Hymenophore. c, d Basidiomata young and dry specimen. e Basal hyphae with clamp. f Hyphae with a vesicle. g Basidia, probasidia and subhymenial hyphae with thin crystals. h, i Basidia. j Spores. Efibula rodriguezarmasiae (18761Tell., MA-Fungi 86652). d Basidiomata with little strands. Scale bars: ad = 5 mm, ej = 5 µm
Fig. 219
Fig. 219
Phylogram generated from Bayesian analysis based on new generated ITS + LSU sequences data and including sequences from clades 5 (Phanerochaete s.l.) and 6 (Efibula) in Floudas and Hibbett (2015). The sequence of Efibula tropica (paratype) is included (Floudas and Hibbett : Fig. S5B, 1) and Ceriporiopsis aneirina as outgroup. The alignment comprises 2061 characters. Maximum parsimony (MP) and maximum likelihood (ML) analyses were also performed; the tree topologies were similar to the Bayesian one. Bootstrap values for MP and ML analyses equal to or greater than 50%, and posterior probabilities to the Bayesian analysis are labeled on the nodes. The newly generated sequences are in blue bold
Fig. 220
Fig. 220
Phanerochaete hainanensis (BJFC 022063, holotype). a Basidiospores. b Basidia and basidiole. c Cystidia. d Hyphae from subiculum
Fig. 221
Fig. 221
Phylogenetic tree obtained from maximum parsimony analysis of a concatenated ITS and nrLSU sequence data of Phanerochaete s.s. Branches are labelled with parsimony bootstrap values equal to or greater than 50% (front), likelihood bootstrap values equal to or greater than 50% (middle) and Bayesian posterior probabilities equal to or greater than 0.95 (back). The new species is in bold
Fig. 222
Fig. 222
Favolus septatus (AMH 10219, new record). a Habitat. b Basidiomata growing on substrate. c Basidioma showing hexagonal pores on lower surfaces. d, e Basidia with sterigmata. f, g Basidiospores. h, i Generative hyphae. j Skeletal binding hyphae. k Culture on PDA after 24 days (surface view). l Simple and compact hyphal bundle. m, n Simple and rope like twisted hyphae. o Parallel loose bundles of hyphae. Scale bars: do = 10 µm
Fig. 223
Fig. 223
The phylogenetic tree has been generated using maximum likelihood analysis based on LSU and ITS sequence data. Thirty-five strains are included in the LSU and ITS combined analyses comprising 1532 sites of which 1202 were the conserved and 320 were the variable sites, and 264 parsimony-informative sites. Neofavolus species are used as the outgroup taxa. The optimal tree with a final likelihood value of − 5057.256 is presented. Estimated base frequencies were as follows: A = 0.250, C = 0.250, G = 0.250, T = 0.250; substitution rates AC = 1.00000, AG = 4.63563, AT = 1.00000, CG = 1.00000, CT = 8.90564, GT = 1.00000; gamma distribution shape parameter α = 0.961. Bootstrap values for maximum likelihood (ML) equal to or greater than 50% are labeled on the nodes. Type sequences are in bold and newly generated sequence of Favolus septatus NFCCI 4776 is in blue bold
Fig. 224
Fig. 224
Lactarius pallidozonarius (HBAU 15004, holotype). a Appearance of basidiomata on ground. b SEM photo of basidiospores. c Basidia. d Pseudocystidia. e Pileipellis. Scale bars: a = 10 mm, ce = 10 µm
Fig. 225
Fig. 225
Phylogram generated from maximum likelihood analysis based and ITS sequence data representing Lactarius pallidozonarius and closely related species. Related sequences are taken from Lee et al. (2019), UNITE and GenBank databases. Forty-nine sequences are included in the combined analysis which comprises 2505 characters 546 characters for ITS after alignment. Lactarius friabilis (GENT FH12-103), L. fuliginosus (GENT MTB97-24) and L. pterosporus (GENT DS09-614) in subg. Plinthogalus are used as the outgroup taxa. Tree topology of the maximum likelihood analysis is similar to the Bayesian analysis. The best RAxML tree with a final likelihood values of − 2161.573832 is presented. The matrix had 158 distinct alignment patterns, with 0.71% undetermined characters or gaps. Estimated base frequencies were as follows: A = 0.229615, C = 0.259476, G = 0.226053, T = 0.284855; substitution rates AC = 0.965485, AG = 9.458565, AT = 0.865989, CG = 0.392267, CT = 8.367348, GT = 1.000000; gamma distribution shape parameter α = 0.217720. Bootstrap values for maximum likelihood (ML) greater than 50% and posterior probability values greater than 0.90 (the rounding of values to 2 decimal proportions) from Bayesian-inference analysis are shown above the nodes. Sequences of type specimens are presented in bold and newly generated sequences are in blue
Fig. 226
Fig. 226
Russula paravioleipes (HBAU 15001, holotype). a Appearance of basidiomata on ground. b SEM photo of basidiospores. c Basidia. d Pseudocystidia. e Pileipellis. Scale bars: a = 10 mm, ce = 10 µm
Fig. 227
Fig. 227
Phylogram generated from maximum likelihood analysis based and ITS sequence data representing Russula paravioleipe and related species in Sect. Heterophyllae. Related sequences are retrieved from GenBank and UNITE databases. Forty-seven ITS sequences are included in the analysis comprises 546 characters after alignments. Russula dinghuensis (GDGM 45244), R. lotus (HKAS 76139), R. nigrovirens (HKAS 55222) and R. variata (TENN 067302) in Sect. Cyanoxanthinae (Subg. Heterophyllidia) are used as the outgroup taxa. Tree topology of the maximum likelihood analysis is similar to the Bayesian analysis. The best RAxML tree with a final likelihood values of − 4326.910274 is presented. The matrix had 281 distinct alignment patterns, with 2.78% undetermined characters or gaps. Estimated base frequencies were as follows: A = 0.217569, C = 0.256487, G = 0.225771, T = 0.300173; substitution rates AC = 1.359519, AG = 4.554062, AT = 0.588669, CG = 0.728567, CT = 5.548012, GT = 1.000000; gamma distribution shape parameter α = 0.379017. Bootstrap values for maximum likelihood (ML) greater than 50% and posterior probability values greater than 0.90 (the rounding of values to 2 decimal proportions) from Bayesian-inference analysis are shown above the nodes. Type and ex-type are indicated in bold and the newly generated sequences are indicated in blue
Fig. 228
Fig. 228
Microbotryum polycnemoides (SOMF 30200, holotype). a Habit. b, c Spores in LM (in median and surface view, respectively). dh Spores in SEM. Scale bars: a = 0.5 cm, b, c = 10 μm, dg = 5 μm, h = 1 μm
Fig. 229
Fig. 229
Most likely tree inferred by maximum likelihood analysis via RAxML version 8.2.11 (Stamatakis 2014) based on concatenated MAFFT v7.450 (Katoh and Standley 2013) alignments of ITS and LSU dataset for Microbotryum species and several closely related genera in Microbotryales. The tree is based on the same dataset as in Kemler et al. (2009), but was pruned to only show one specimen per fungal species. Values at nodes indicate bootstrap values inferred by 100 replicates; only values greater than 50% are shown. The newly generated sequence is in blue bold
Fig. 230
Fig. 230
Mortierella solitaria (OAS3, holotype). a, b Sporangiophores formed on aerial or basal hyphae. c Sphaerical sporangial head with intact smooth peridium and small apophysis-like widening of the sporangiophore. d Tip of a sporangiophore with collarette and spores. e Sporangiospores released from the sporangium. fh Initial stages of gametangiogamy with empty, aborted zygospore. Scale bars: a, b = 20 µm, ch = 10 µm
Fig. 231
Fig. 231
Sporangia of Mortierella solitaria. a Length of the sporangia (–500 µm tall). b Sporangiophore tips showing collarette and the spores. c Details of the peridial wall of the sporangia. Scale bars: ac = 10 µm
Fig. 232
Fig. 232
Growth rates of Mortierella solitaria as boxplots. a Boxplot displaying the mean 25th and 75th percentiles as box and outside values as dots. b, c Seven days old culture of the isolates on LcA and PDA
Fig. 233
Fig. 233
Phylogenetic relationship of Mortierella solitaria with related taxa based on the nucleotide sequences of the ITS. The maximum likelihood (ML) tree (-ln likelihood = 1899.6675) was constructed in MEGA X (Kumar et al. 2018). Five representatives of Mortierella alpina complex are used as the outgroup taxa. The dataset includes 494 total characters. Phylogenetic trees obtained from ML and Bayesian inference posterior probabilities (BYPP) were similar in topology. Bootstrap support on the nodes represents MPBS/BYPP. The new species M. solitaria is highlighted in blue in the yellow box
Fig. 234
Fig. 234
Phylogenetic relationship of Mortierella solitaria with related taxa based on the concatenated nucleotide sequences of the ITS and LSU. The maximum likelihood (ML) tree (-ln likelihood = 5141.7516) was constructed in MEGA X (Kumar et al. 2018). Mortierella horticola and M. globalpina are used as the outgroup taxa. The dataset includes 1439 total characters. Phylogenetic trees obtained from ML, and Bayesian inference posterior probabilities (BYPP) were similar in topology. Bootstrap support on the nodes represents MPBS/BYPP. The new species Mortierella solitaria is highlighted in blue in the yellow box
Fig. 235
Fig. 235
Mucor harpali (CNUFC ICT18001, ex-type living culture). a A bombardier beetle of Harpalus sp. belonging to Coleoptera. b Colony on synthetic mucor agar (SMA). c Colony on potato dextrose agar (PDA). d Colony on malt extract agar (MEA). e, f Sporangiophores and sporangia. g Sterile sporangium. hj Typical columellae. k Sporangiospores. l Rhizoids (Fig. e: observed under a stereomicroscope; Figs. f–l: light microscope). Scale bars: fl = 20 µm
Fig. 236
Fig. 236
Phylogram generated from maximum likelihood analysis based on ITS sequence data for the species of Mucor. Bootstrap values equal to or greater than 70% for ML analyses is presented at the nodes. Mucor amphibiorum is used as the outgroup taxon. Type strains are in bold and newly generated sequences are in blue
Fig. 237
Fig. 237
Phylogram generated from maximum likelihood analysis based on LSU sequence data for the species of Mucor. Bootstrap values equal to or greater than 70% for ML analyses is presented at the nodes. Mucor amphibiorum is used as the outgroup taxon. Type strains are in bold and newly generated sequences are in blue

References

    1. Abdel-Wahab MA, El-Sharouny HM, Jones EBG. Two new intertidal lignicolous Swampomyces species from Red Sea mangroves in Egypt. Fungal Divers. 2001;8:35–40.
    1. Abdel-Wahab MA, El-Samawaty AMA, El Gorban AM, Yassin MA, Alsaadi MH. Khaleijomyces marinus gen. et sp. nov. (Juncigenaceae, Torpedosporales) a new lignicolous marine fungus from Saudi Arabia. Phytotaxa. 2018;340:277–285. doi: 10.11646/phytotaxa.340.3.8. - DOI
    1. Abdel-Wahab MA, Jones EBG, Bahkali AHA, El-Gorban AM. Marine fungi from Red Sea mangroves in Saudi Arabia with Fulvocentrum rubrum sp. nov. (Torpedosporales, Ascomycota) Nova Hedwig. 2019;108:365–377. doi: 10.1127/nova_hedwigia/2018/0511. - DOI
    1. Abdollahzadeh J. Diplodia bulgarica, as a new pathogen and potential threat to the apple industry in Iran. Phytopathol Mediterr. 2015;54:128–132.
    1. Abdollahzadeh J, Zolfaghari S. Efficiency of rep-PCR fingerprinting as a useful technique for molecular typing of plant pathogenic fungal species: Botryosphaeriaceae species as a case study. FEMS Microbiol Lett. 2014;361:144–157. doi: 10.1111/1574-6968.12624. - DOI - PubMed

LinkOut - more resources