. 2021 Nov 24:15:734501.
doi: 10.3389/fnhum.2021.734501. eCollection 2021.

Deep Learning Recurrent Neural Network for Concussion Classification in Adolescents Using Raw Electroencephalography Signals: Toward a Minimal Number of Sensors

Affiliations

Deep Learning Recurrent Neural Network for Concussion Classification in Adolescents Using Raw Electroencephalography Signals: Toward a Minimal Number of Sensors

Karun Thanjavur et al. Front Hum Neurosci. .

Abstract

Artificial neural networks (ANNs) are showing increasing promise as decision support tools in medicine and particularly in neuroscience and neuroimaging. Recently, there has been increasing work on using neural networks to classify individuals with concussion using electroencephalography (EEG) data. However, to date the need for research grade equipment has limited the applications to clinical environments. We recently developed a deep learning long short-term memory (LSTM) based recurrent neural network to classify concussion using raw, resting state data using 64 EEG channels and achieved high accuracy in classifying concussion. Here, we report on our efforts to develop a clinically practical system using a minimal subset of EEG sensors. EEG data from 23 athletes who had suffered a sport-related concussion and 35 non-concussed, control athletes were used for this study. We tested and ranked each of the original 64 channels based on its contribution toward the concussion classification performed by the original LSTM network. The top scoring channels were used to train and test a network with the same architecture as the previously trained network. We found that with only six of the top scoring channels the classifier identified concussions with an accuracy of 94%. These results show that it is possible to classify concussion using raw, resting state data from a small number of EEG sensors, constituting a first step toward developing portable, easy to use EEG systems that can be used in a clinical setting.

Keywords: LSTM; adolescents; concussion; concussion classification; deep learning; machine learning; mild traumatic brain injury; resting state EEG.


Conflict of interest statement

The authors declare that the research was conducted in the absence of any commercial or financial relationships that could be construed as a potential conflict of interest.

Figures
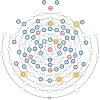
FIGURE 1
FIGURE 1
Locations of the EEG electrodes on the scalp. The locations of the six most important channels with respect to classification performance of the neural network are marked by yellow squares.
FIGURE 2
FIGURE 2
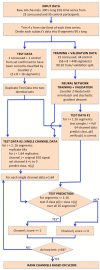
Flowchart illustrating the steps followed in Stage I for the identification of the channels which have the highest impact on the classification performance of ConcNet 2. The flowchart begins with the input dataset, followed by the trimming and segmentation of each participant’s data, and then splitting into training, validation and test datasets. ConcNet 2 was trained and validated using the standard procedure of mini-batch SGD. For Stage I, two test sets are created in parallel as shown, one to benchmark ConcNet 2’s performance against earlier results described in Paper I, and the other for ranking the channels by their impact on classification, as explained in the text. As indicated by the asterisks on the outputs of the conditional box for the test prediction, each channel was awarded a score of 1 if and only if the median prediction score ≥ 0.9, and the 2.5th percentile ≥ 0.85, which demanded a high degree of confidence in making a correct classification for all 16 test segments in this test. Finally, this test procedure, and the additional complementary test with three concussed-control pairs described in the text, were each repeated nine times, and the channels ranked based on their total score ranging from 0 to 18, as explained in “Results” section. The six top scoring channels from this overall ranking were taken to be those with the highest impact on the classification performance, and therefore were then used for Stage II of our work.
FIGURE 3
FIGURE 3
Flowchart illustrating the procedure followed for the MCCV tests in Stage II to compare the performance of ConcNet 3 using only 6-channel data against that of ConcNet 2, which used 64-channel data. As shown, a new dataset was created which contained data for only the six top scoring channels identified in Stage I for all the participants (23 concussed and 35 controls). These data were trimmed and segmented into eight segments for each participant. The dataset was then split in a 80:10:10 ratio into training, validation and test datasets, taking care to ensure the training and validation datasets were balanced between the two classes. ConcNet 3 was trained and validated using standard mini-batch SGD, after re-tuning three of its hyperparameters, the dropout fraction, learning rate and total number of training epochs to reduce overfitting on the 6-channel data. The predictions made by the trained ConcNet 3 for the 16 test segments were compared with the known class labels of each segment to obtain the accuracy and other performance metrics for each MCCV cycle. By repeating the cycle 100 times, the median and the quartiles of the accuracy and various other performance metrics reported in Table 2 were obtained, and compared with those of ConcNet 2 obtained from the MCCV tests reported in Paper I, and reproduced in Table 3 for ease of reference.
FIGURE 4
FIGURE 4
Classification scores of ConcNet 2 for a pair of one control and one concussed participant based on a total of sixteen data segments.
FIGURE 5
FIGURE 5
Representative example of ConcNet 2 test output scores (circle markers), PHlth and PMtbi, respectively, for one control (bottom) and one concussed (top) participants. The horizontal axis marks the channel number used as input, and the vertical axes correspond to test output scores in the range [0, 1]. The error bars are based on the results of eight data segments per participant, and the circle marker corresponds to the median of these values. Green markers represent channels with medians above 0.9 and 2.5th percentile greater than 0.85. Blue markers correspond to channels with median greater than 0.5 but lower percentiles below 0.85, while red markers correspond to channels with medians less than 0.5 (i.e., misclassifications).
FIGURE 6
FIGURE 6
ConcNet 3 MCCV classification test output scores (circle markers), i.e., PHlth and PmTBI, respectively, for control (bottom) and concussed (top) participants. The horizontal axis marks the different participants in each group, and the vertical axes correspond to test output scores in the range [0, 1]. The error bars are based on the classification results of 100 Monte Carlo cross validation experiments. Blue markers correspond to participants who were correctly classified at least 50% of the time, while red markers correspond to misclassified participants (median classification score less than 0.5).
FIGURE 7
FIGURE 7
ConcNet 2 MCCV classification test output scores (circle markers), i.e., PHlth and PmTBI, respectively, for control (bottom) and concussed (top) participants. These results are based on information from all 64 EEG channels. The horizontal axis marks the different participants in each group, and the vertical axes correspond to test output scores in the range [0, 1]. The error bars are based on the classification results of 100 Monte Carlo cross validation experiments. Blue markers correspond to participants who were correctly classified at least 50% of the time, while red markers correspond to misclassified participants (median classification score less than 0.5).
FIGURE 8
FIGURE 8
A bar plot representation of the Monte Carlo cross validation test results obtained by means of the ConcNet 3 ensemble of networks (using the six top-scoring channels as input) for the concussed (top) and control (bottom) participants. The blue and red regions in each column illustrate the relative fractions of times that a participant was properly or wrongly classified by the MCCV ensemble. This figure is complementary to Figure 5 which shows the ConcNet 3 median and quartile scores per participant. Two control participants and one concussed participant tended to be systematically misclassified by the networks in the ensemble.
FIGURE 9
FIGURE 9
A bar plot representation of the Monte Carlo cross validation test results obtained by means of the ConcNet 2 ensemble of networks (using all 64 channels as input) for the concussed (top) and control (bottom) participants. The blue and red regions in each column illustrate the relative fractions of times that a participant was properly or wrongly classified by the MCCV ensemble. This figure is complementary to Figure 4 which shows the ConcNet 2 median and quartile scores per participant. Three control and two concussed participants were systematically misclassified by the networks in the ensemble.
FIGURE 10
FIGURE 10
Receiver operating characteristic (ROC) curves for the 100 ConcNet 3 networks used in MCCV. The gray curves show the results for each of the 100 networks and the blue curve shows the median. The ensemble median Area Under the Curve (AUC) is 0.971 (the 25% and the 75% percentile are 0.964 and 0.978, respectively).
FIGURE 11
FIGURE 11
Receiver operating characteristic (ROC) curves for the 100 ConcNet 2 networks used in MCCV. The gray curves show the results for each of the 100 networks and the blue curve shows the median. The ensemble median Area Under the Curve (AUC) is 0.961 (the 25% and the 75% percentile are 0.952 and 0.969, respectively).

References

    1. Asken B. M., Bauer R. M., Guskiewicz K. M., McCrea M. A., Schmidt J. D., Giza C. C., et al. (2018). Immediate removal from activity after sport-related concussion is associated with shorter clinical recovery and less severe symptoms in collegiate student-athletes. Am. J. Sports Med. 46 1465–1474. 10.1177/0363546518757984 - DOI - PMC - PubMed
    1. Borich M., Babul A.-N., Yuan O. H., Boyd L., Virji-Babul N. (2015). Alterations in resting-state brain networks in concussed adolescent athletes. J. Neurotrauma 32 265–271. 10.1089/neu.2013.3269 - DOI - PubMed
    1. Borich M., Makan N., Boyd L., Virji-Babul N. (2013). Combining whole-brain voxel-wise analysis with in vivo tractography of diffusion behavior after sports-related concussion in adolescents: a preliminary report. J. Neurotrauma 30 1243–1249. 10.1089/neu.2012.2818 - DOI - PubMed
    1. Boshra R., Ruiter K. I., DeMatteo C., Reilly J. P., Connolly J. F. (2019). Neurophysiological correlates of concussion: deep learning for clinical assessment. Sci. Rep. 9:17341. 10.1038/s41598-019-53751-9 - DOI - PMC - PubMed
    1. Caeyenberghs K., Verhelst H., Clemente A., Wilson P. H. (2017). Mapping the functional connectome in traumatic brain injury: what can graph metrics tell us? NeuroImage 160 113–123. 10.1016/j.neuroimage.2016.12.003 - DOI - PubMed

LinkOut - more resources