. 2021 Nov 25:12:772276.
doi: 10.3389/fphys.2021.772276. eCollection 2021.

Eph-ephrin Signaling Affects Eye Lens Fiber Cell Intracellular Voltage and Membrane Conductance

Affiliations

Eph-ephrin Signaling Affects Eye Lens Fiber Cell Intracellular Voltage and Membrane Conductance

Catherine Cheng et al. Front Physiol. .

Abstract

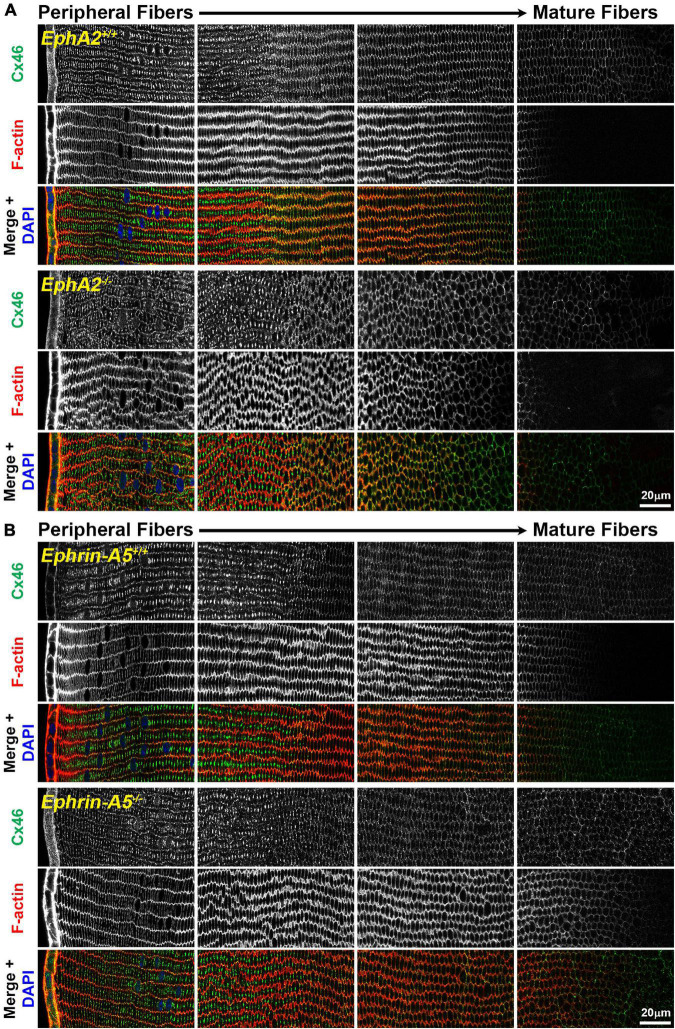
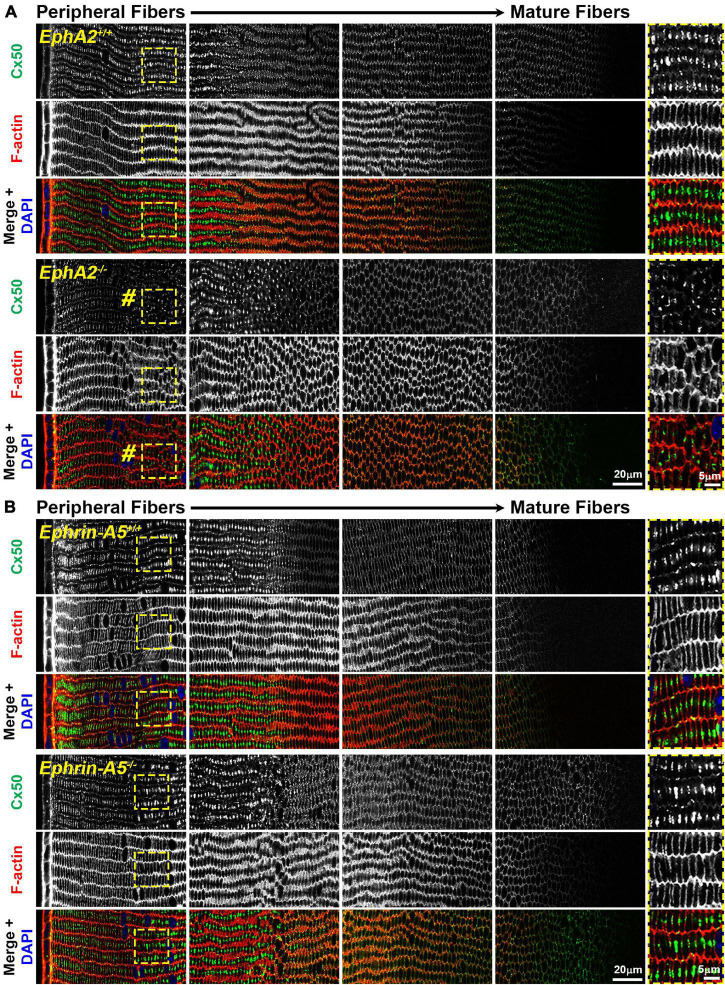
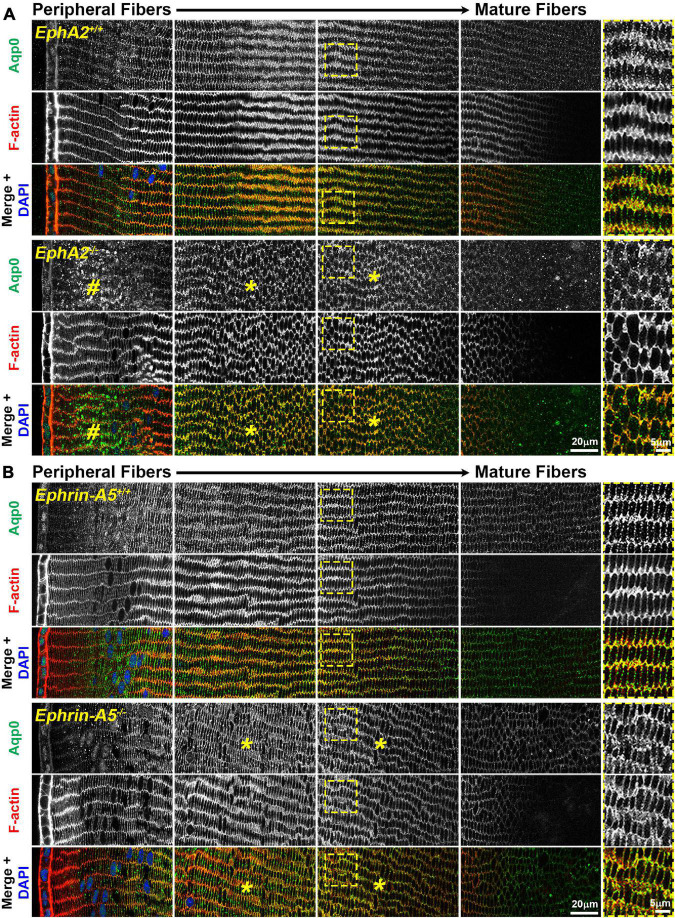
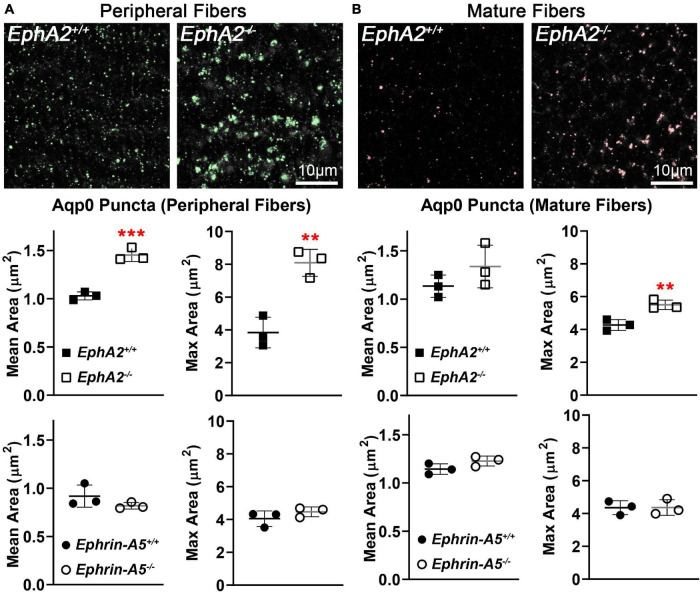
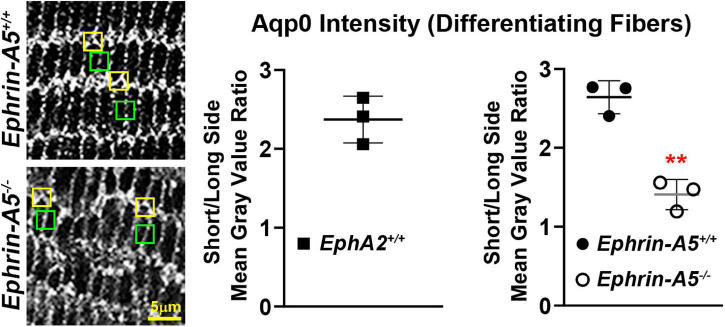
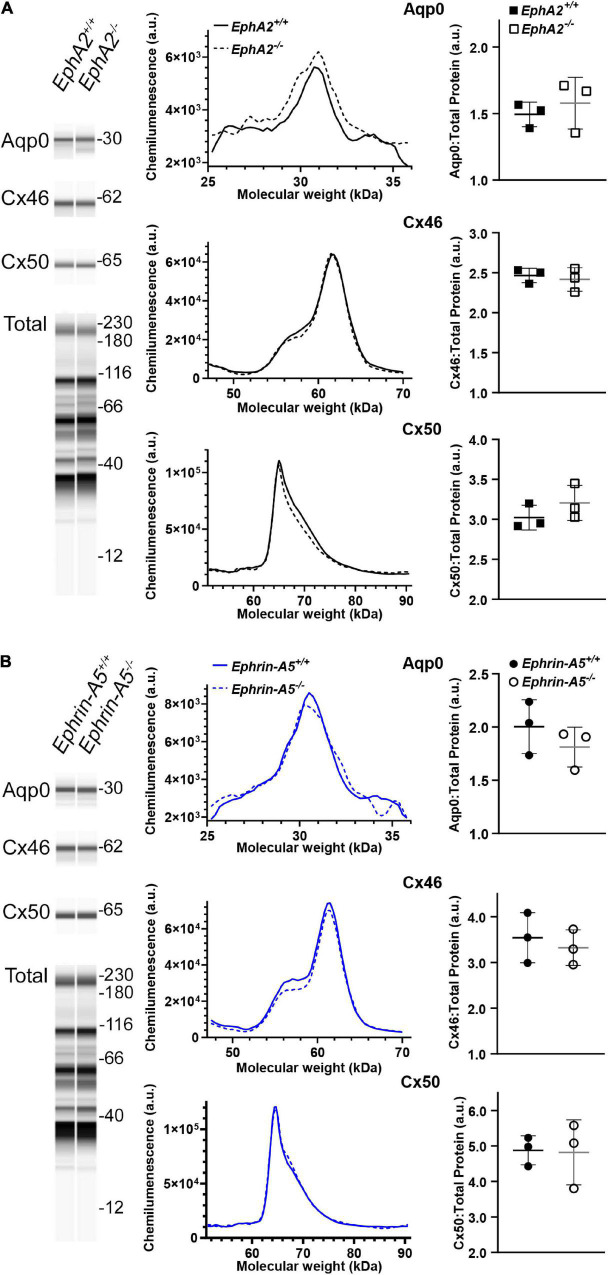
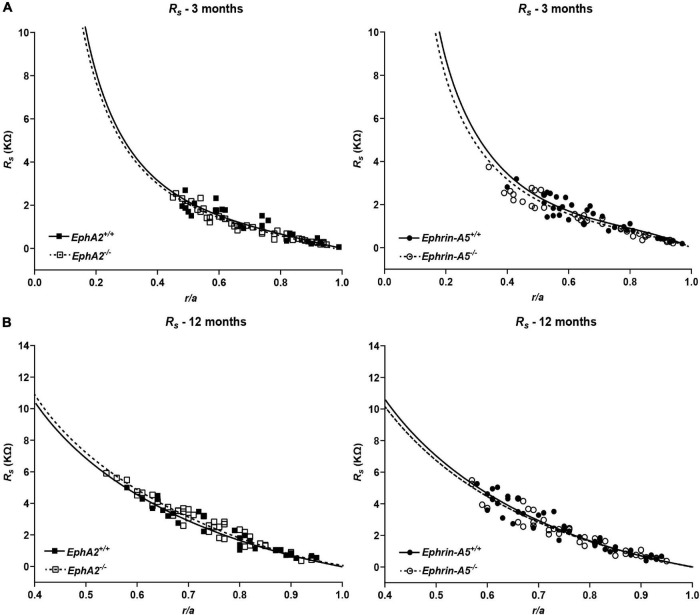
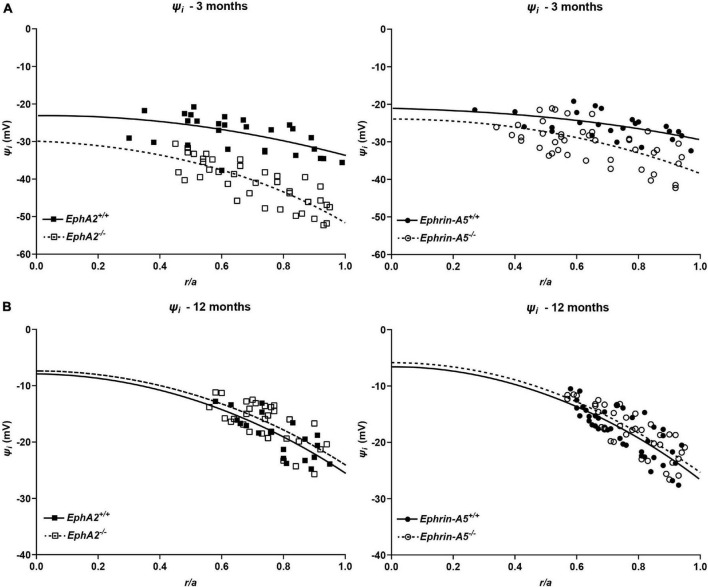
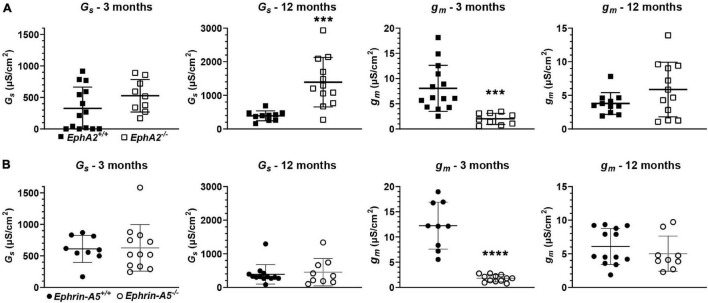
The avascular eye lens generates its own microcirculation that is required for maintaining lifelong lens transparency. The microcirculation relies on sodium ion flux, an extensive network of gap junction (GJ) plaques between lens fiber cells and transmembrane water channels. Disruption of connexin proteins, the building blocks of GJs, or aquaporins, which make up water and adhesion channels, lead to lens opacification or cataracts. Recent studies have revealed that disruption of Eph-ephrin signaling, in particular the receptor EphA2 and the ligand ephrin-A5, in humans and mice lead to congenital and age-related cataracts. We investigated whether changes in lens transparency in EphA2 or ephrin-A5 knockout (-/-) mice is related to changes in GJ coupling and lens fluid and ion homeostasis. Immunostaining revealed changes in connexin 50 (Cx50) subcellular localization in EphA2 -/- peripheral lens fibers and alteration in aquaporin 0 (Aqp0) staining patterns in ephrin-A5 -/- and EphA2 -/- inner mature fiber cells. Surprisingly, there was no obvious change in GJ coupling in knockout lenses. However, there were changes in fiber cell membrane conductance and intracellular voltage in knockout lenses from 3-month-old mice. These knockout lenses displayed decreased conductance of mature fiber membranes and were hyperpolarized compared to control lenses. This is the first demonstration that the membrane conductance of lens fibers can be regulated. Together these data suggest that EphA2 may be needed for normal Cx50 localization to the cell membrane and that conductance of lens fiber cells requires normal Eph-ephrin signaling and water channel localization.

Keywords: EphA2; aquaporin; connexin; ephrin-A5; gap junction coupling; resistivity.


Conflict of interest statement

The authors declare that the research was conducted in the absence of any commercial or financial relationships that could be construed as a potential conflict of interest.

Figures

FIGURE 1
FIGURE 1
Connexin 46 (Cx46, green) and phalloidin (F-actin, red) staining in cross sections from control, EphA2–/– and ephrin-A5–/– lenses. Images are from the periphery to the inner mature fiber cells of the lens. (A) Cx46 is present at the cell membrane and is enriched on the long sides of peripheral differentiating fiber cells and becomes uniformly distributed around the cell membrane during maturation. The staining pattern is similar between control and EphA2–/– lens fibers, despite the disorganization of EphA2–/– cells. (B) Cx46 displays a similar localization pattern in peripheral and mature control and ephrin-A5–/– lens fibers. Scale bars, 20 μm.
FIGURE 2
FIGURE 2
Connexin 50 (Cx50, green) and phalloidin (F-actin, red) staining in cross sections from control, EphA2–/– and ephrin-A5–/– lenses. Images are from the periphery to the inner mature fiber cells of the lens. (A) In control lens fibers, Cx50 is present at the cell membrane of peripheral cells and enriched in large plaques in the middle of the long sides of those cells. As fiber cells mature, Cx50 is distributed around the cell membrane with slight enrichment at the short sides. Unexpectedly, in EphA2–/– peripheral lens fibers, there is a distinct region where the Cx50 signal is reduced at the cell membrane and is no longer in large plaques in the middle of the long side of the fibers (pound signs and high magnification panels on the right). As the cells mature, the Cx50 signal in EphA2–/– fiber cells is comparable to the control. (B) Cx50 staining signals are comparable between control and ephrin-A5–/– lens fibers in the peripheral and mature fibers. Scale bars, 20 and 5 μm.
FIGURE 3
FIGURE 3
Aquaporin 0 (Aqp0, green) and phalloidin (F-actin, red) staining in cross sections from control, EphA2–/– and ephrin-A5–/– lenses. Images are from the periphery to the inner mature fiber cells of the lens. (A) In control peripheral lens fibers, Aqp0 is added to the cell membrane and evenly distributed around the membrane. As the cells mature, Aqp0 is enriched on the short sides of the fiber cells. In EphA2–/– peripheral fiber cells, there are large puncta/aggregates of Aqp0 (pound signs), and as the cells mature, Aqp0 is distributed around the cell membrane without enrichment along the short sides of the cells (asterisks and high magnification panels on the right). (B) Compared to control fibers, Aqp0 distribution in differentiating and maturing ephrin-A5–/– fibers is around the entire cell membrane (asterisks and high magnification panels on the right) while Aqp0 is enriched along the short sides of control lens fibers. Scale bars, 20 and 5 μm.
FIGURE 4
FIGURE 4
Quantification of Aqp0 puncta in peripheral and mature fiber cells from cross sections of control, EphA2–/– and ephrin-A5–/– lenses. (A) In control peripheral lens fibers, there are relatively small Aqp0 puncta, while in EphA2–/– cells, there are much larger Aqp0 puncta/aggregates (highlighted in green). Quantification from three staining samples shows small Aqp0 puncta (mean and max puncta area, μm2) in EphA2+/+, ephrin-A5+/+ and ephrin-A5–/– peripheral lens fibers. In contrast, Aqp0 puncta/aggregates are significantly larger (mean and max area) in EphA2–/– peripheral lens fibers. (B) In mature EphA2–/– lens fibers, larger Aqp0 puncta/aggregates are observed (highlighted in red). Quantification shows increased Aqp0 max puncta area in EphA2–/– mature fibers. There are no changes in Aqp0 puncta found in ephrin-A5–/– mature lens fibers. Scale bars, 10 μm. **, p < 0.01 and ***, p < 0.001.
FIGURE 5
FIGURE 5
Comparison of the intensity of the Aqp0 immunostaining signal between the long and short sides of differentiating lens fiber cells. Quantification was performed by measuring the mean gray value of at the short side (yellow boxes) and the neighboring long side of the same cell (green boxes). Measurements were made in three different lens sections from each genotype. Immunostaining signal from EphA2–/– mature lens fibers could not be measured as the cell shape is irregular, and the long and short sides of the cells could not be reliably distinguished. In control (EphA2+/+ and ephrin-A5+/+) mature lens fibers, the ratio of mean gray value (intensity) between the short and long side of the cell was over 2.5, indicating a stronger Aqp0 staining signal on the short side of the cell compared to the long side. In contrast, the ratio of intensity is just above 1 in ephrin-A5–/–, suggesting that Aqp0 staining intensity was similar between the short and long sides of these KO cells. Scale bar, 5 μm. **, p < 0.01.
FIGURE 6
FIGURE 6
WES capillary-based Westerns for Cx46, Cx50, and Aqp0 in whole lens protein lysates from 6-week-old control, EphA2–/– and ephrin-A5–/– lenses. Representative gel bands for Aqp0 (30 kDa), Cx46 (60 kDa), and Cx50 (64 kDa) and total protein profiles (12–230 kDa) are shown in pseudo-lane views. (A) Representative electropherogram of Aqp0, Cx46, and Cx50 peaks are plotted for control and EphA2–/– samples. Dot plots show the average and standard deviation of Aqp0, Cx46, and Cx50 protein levels normalized to the total protein. There is no difference detected between control and KO lenses in the protein amount for Aqp0, Cx46, and Cx50 (p > 0.3). (B) The same analysis was conduced for control and ephrin-A5–/– lenses. There were no statistically significant differences in Aqp0, Cx46, or Cx50 protein levels detected.
FIGURE 7
FIGURE 7
Series resistance measurements in lenses from 3- and 12-month-old control, EphA2–/– and ephrin-A5–/– mice. (A) Series resistance (Rs) in lenses from 3-month-old EphA2+/+ (black squares with solid fit line), EphA2–/– (open squares with dashed fit line), ephrin-A5+/+ (black circles with solid fit line), and ephrin-A5–/– (open circles with dashed fit line) lenses as a function of distance from lens center (r/a), where r (cm) is actual distance and a (cm) is lens radius. There are no obvious differences in resistance between control and KO lenses (n ≥ 6). (B) Series resistance (Rs) in lenses from 12-month-old EphA2+/+ (black squares with solid fit line), EphA2–/– (open squares with dashed fit line), ephrin-A5+/+ (black circles with solid fit line), and ephrin-A5–/– (open circles with dashed fit line) lenses as a function of distance from the lens center. There are no significant differences in resistance between control and KO lenses (n ≥ 6).
FIGURE 8
FIGURE 8
Intracellular voltage (ψi) in lenses from 3- and 12-month-old control, EphA2–/– and ephrin-A5–/– mice. (A) Intracellular voltage in lenses from 3-month-old EphA2+/+ (black squares with solid fit line), EphA2–/– (open squares with dashed fit line), ephrin-A5+/+ (black circles with solid fit line), and ephrin-A5–/– (open circles with dashed fit line) lenses as a function of distance from lens center (r/a), where r (cm) is actual distance and a (cm) is lens radius. KO lenses were hyperpolarized when compared to controls (n ≥ 6). (B) Intracellular voltage in lenses from 12-month-old EphA2+/+ (black squares with solid fit line), EphA2–/– (open squares with dashed fit line), ephrin-A5+/+ (black circles with solid fit line), and ephrin-A5–/– (open circles with dashed fit line) lenses as a function of distance from the lens center. There are no significant differences in intracellular voltage between control and KO lenses (n ≥ 6).
FIGURE 9
FIGURE 9
Surface conductance (GS) and mature fiber conductance (gm) in lenses from 3- and 12-month-old control, EphA2–/– and ephrin-A5–/– mice. (A) Mean and standard deviation of GS and gm in lenses from 3- or 12-month-old EphA2+/+ (black squares) and EphA2–/– (open squares) mice. While GS is comparable between lenses from young control and KO mice, GS is elevated in lenses from 12-month-old EphA2–/– mice. gm is decreased in lenses from 3-month-old EphA2–/– mice. (B) Mean and standard deviation of GS and gm in lenses from 3- or 12-month-old ephrin-A5+/+ (black circles) and ephrin-A5–/– (open circles) mice. There is no obvious change in GS in lenses from KO mice at either age or gm in lenses from young KO mice. However, gm is decreased in lenses from 12-month-old ephrin-A5–/– mice. ***, p < 0.001; ****, p < 0.0001.

References

    1. Arvanitis D., Davy A. (2008). Eph/ephrin signaling: networks. Genes Dev. 22 416–429. 10.1101/gad.1630408 - DOI - PMC - PubMed
    1. Baldo G. J., Mathias R. T. (1992). Spatial variations in membrane properties in the intact rat lens. Biophys. J. 63 518–529. 10.1016/S0006-3495(92)81624-7 - DOI - PMC - PubMed
    1. Bassnett S. (2002). Lens organelle degradation. Exp. Eye Res. 74 1–6. 10.1006/exer.2001.1111 - DOI - PubMed
    1. Beyer E. C., Paul D. L., Goodenough D. A. (1987). Connexin43: a protein from rat heart homologous to a gap junction protein from liver. J. Cell Biol. 105 2621–2629. 10.1083/jcb.105.6.2621 - DOI - PMC - PubMed
    1. Biswas S., Son A., Yu Q., Zhou R., Lo W. K. (2016). Breakdown of interlocking domains may contribute to formation of membranous globules and lens opacity in ephrin-A5(-/-) mice. Exp. Eye Res. 145 130–139. 10.1016/j.exer.2015.11.017 - DOI - PMC - PubMed

LinkOut - more resources