Review
. 2021 Nov 26:8:780228.
doi: 10.3389/fnut.2021.780228. eCollection 2021.

Chemometric-Guided Approaches for Profiling and Authenticating Botanical Materials

Affiliations
Review

Chemometric-Guided Approaches for Profiling and Authenticating Botanical Materials

Evelyn J Abraham et al. Front Nutr. .

Abstract

Botanical supplements with broad traditional and medicinal uses represent an area of growing importance for American health management; 25% of U.S. adults use dietary supplements daily and collectively spent over $9. 5 billion in 2019 in herbal and botanical supplements alone. To understand how natural products benefit human health and determine potential safety concerns, careful in vitro, in vivo, and clinical studies are required. However, botanicals are innately complex systems, with complicated compositions that defy many standard analytical approaches and fluctuate based upon a plethora of factors, including genetics, growth conditions, and harvesting/processing procedures. Robust studies rely upon accurate identification of the plant material, and botanicals' increasing economic and health importance demand reproducible sourcing, as well as assessment of contamination or adulteration. These quality control needs for botanical products remain a significant problem plaguing researchers in academia as well as the supplement industry, thus posing a risk to consumers and possibly rendering clinical data irreproducible and/or irrelevant. Chemometric approaches that analyze the small molecule composition of materials provide a reliable and high-throughput avenue for botanical authentication. This review emphasizes the need for consistent material and provides insight into the roles of various modern chemometric analyses in evaluating and authenticating botanicals, focusing on advanced methodologies, including targeted and untargeted metabolite analysis, as well as the role of multivariate statistical modeling and machine learning in phytochemical characterization. Furthermore, we will discuss how chemometric approaches can be integrated with orthogonal techniques to provide a more robust approach to authentication, and provide directions for future research.

Keywords: adulteration; authentication; biochemometrics; botanicals; chemometrics; dietary supplements; metabolomics; multi-omics.


Conflict of interest statement

The authors declare that the research was conducted in the absence of any commercial or financial relationships that could be construed as a potential conflict of interest.

Figures

Figure 1
Figure 1
Pattern recognition methods. ANN, artificial neural networks; PCA, principal component analysis; PLS, partial least squares; SIMCA, soft independent modeling of class analogy; SOM, self-organizing maps.
Figure 2
Figure 2
Principal component analysis (PCA) scores (A) and loadings (B) plot demonstrating differentiation between fruit juices based upon untargeted metabolomic analysis. Reproduced with permission from Zhang et al. (76). Copyright 2018, American Chemical Society.
Figure 3
Figure 3
Principal component analysis (PCA) from Cinnamomum verum and C. cassia from different geographical origins, and representative commercial oil, using 1H-NMR (n = 3) metabolomics. The scores plot (A) demonstrates clusters at distinct spatial points in the PC1-PC2 scores plot, and loadings plot (B) highlights major contributing molecules to the separation of the samples. Reproduced with permission from Farag et al. (77). Copyright 2018, Elsevier Ltd.
Figure 4
Figure 4
Unsupervised clustering analysis of four species of Sarsaarilla using cheometric modeling of 1H NMR data. Peak patterns are also provided to illustrate differences between four major species. Reproduced under a Creative Commons Attribution 4.0 license from Kesanakurti et al. (82).
Figure 5
Figure 5
PLS-DA analysis of gaharu (Aquilaria malaccensis) woods by 1H-NMR untargeted analysis. The PLS-DA scores plot (A) effectively discriminated between lower grade products (“E” and “H”) and higher grades. And the corresponding loadings plot (B) demonstrated that the lower quality products contained higher levels of aquilarone derivates. Reproduced under a Creative Commons CC BY 4.0 license from Ismail et al. (93).
Figure 6
Figure 6
PLS-DA discrimination plots according to the geographical region of production of paprika. (A) La Vera PDO vs. other regions; (B) Murcia vs. the other two; (C) Czech Republic vs. other classifications. The dashed red line indicates the classification boundary between the two designations. Open symbols represent the training data; the solid symbols are the test data. Reproduced with permission from Barbosa et al. (95). Copyright 2020, American Chemical Society.
Figure 7
Figure 7
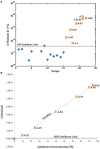
Use of SIMCA to determine adulteration of H. canadenis by C. chinesis. (A) SIMCA demonstrating that pure H. candenis samples (blue diamonds) are below the 95% confidence interval and adulterated samples (orange squares) are above the 95% confidence interval. (B) The Q-residual of each adulterated sample. The blue diamond represents the mean Q-residual for the unadulterated H. canadenis samples. Reproduced with permission from Wallace et al. (79). Copyright 2020, Springer Nature.
Figure 8
Figure 8
Use of classification trees to identify unknown avocado oil samples as a specific cultivar or as no class based on HPLC-CAD metabolite profiles of a training set. Reproduced with permission from Martin-Torres et al. (97). Copyright 2019, John Wiley and Sons.
Figure 9
Figure 9
Support Vector Machine (SVM) model for differentiating between Dendrobrium species. Using a low-level fusion strategy of MIR and NIR spectral data from 12 Dendrobrium sp. Reproduced under a Creative Commons Attribution License 4.0 from Wang et al. (107).
Figure 10
Figure 10
Metabolomics workflow for ANN. Metabolite features are loaded as inputs (red circle), which are fed through hidden neuron networks (gray circles), and categorized into output categories (blue circles). Each connection (gray line) has a weight, and each neuron has a bias, which are used for the activation functions. Reproduced with permission from Pomyen et al. (112) Copyright 2020, Elsevier Ltd.
Figure 11
Figure 11
Partial least squares-discriminate analysis of Lagerstroemia samples. Scores plot (A) from the PLS-DA model accounted for 40.4% of model variability, and demonstrated two distinct clusters of samples. The S-plots (B) revealed two flavonol glycosides (myricetin-3-O-β-D-rhamnoside and quercetin 3-O-β-D-rhamnoside) and corosolic acid as potential discriminatory biomarkers with activity in stimulating glucose uptake. Reproduced with permission from Kim et al. (133). Copyright 2020, Elsevier Ltd.
Figure 12
Figure 12
Integration of metabolomics, DNA barcoding, and electronic noise increases accuracy of Citri Reticulatae Pericarpium cultivar distinction compared to each method alone. Reproduced with permission from Li et al. (135) Copyright 2020, Springer Nature.
Figure 13
Figure 13
Integration of multiple-omics datasets and potential outputs using the mixOmics R package. Reproduced under a Creative Commons CC BY 4.0 license from Rohart et al. (151).
Figure 14
Figure 14
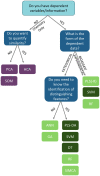
A decision tree to establish which analysis is more appropriate to analyzing complex chemical data. Based upon the presence of response data, and how the overall analysis needs to be structured/interpreted. ANN, artificial neural networks; DT, decision trees; GA, genomic algorithms; HCA, hierarchical clustering analysis; PCA, principal component analysis; PLS, partial least squares; PLS-DA, partial least squares-discriminate analysis; RF, random forests; SIMCA, soft independent modeling of class analogies; SOM, self-organized maps; SVM, support vector machines. Light green boxes represent “soft” classification techniques. Dark green boxes represent “hard” classification techniques.

References

    1. Vogtman H. Dietary supplement usage increases, says new survey. The Council for Responsible Nutrition. Available online at: https://www.crnusa.org/newsroom/dietary-supplement-usage-increases-says-... (accessed July 29, 2021).
    1. Smith T, May G, Eckl V, Reynolds CM. US Sales of herbal supplements increase by 8.6% in 2019. HerbalGram. (2019) 127:54–69. Available online at: http://cms.herbalgram.org/herbalgram/issue127/hg127-mktrpt-2019.html
    1. Li C, Hansen RA, Chou C, Calderón AI, Qian J. Trends in botanical dietary supplement use among US adults by cancer status: The National Health and Nutrition Examination Survey, 1999 to 2014. Cancer. (2018) 124:1207–15. 10.1002/cncr.31183 - DOI - PubMed
    1. Sun Y, Wang R, Tang W, Li C, Huo N. Trends and factors of botanical dietary supplement use among US adults with COPD from 1999 to 2016. PLoS ONE. (2020) 15:e0239674. 10.1371/journal.pone.0239674 - DOI - PMC - PubMed
    1. Kuszak AJ, Hopp DC, Williamson JS, Betz JM, Sorkin BC. Approaches by the US National Institutes of Health to support rigorous scientific research on dietary supplements and natural products. Drug Test Anal. (2016) 8:413–7. 10.1002/dta.1931 - DOI - PMC - PubMed

LinkOut - more resources