

Trends in health equity in mortality in the United States, 1969-2019
- PMID: 34901375
- PMCID: PMC8637635
- DOI: 10.1016/j.ssmph.2021.100966
Trends in health equity in mortality in the United States, 1969-2019
Abstract
Rationale: Health equity is a significant concern of public health, yet a comprehensive assessment of health equity in the United States over time is lacking. While one might presume that overall health will improve with rising living standards, no such presumption is warranted for health equity, which may decline even as average health improves.
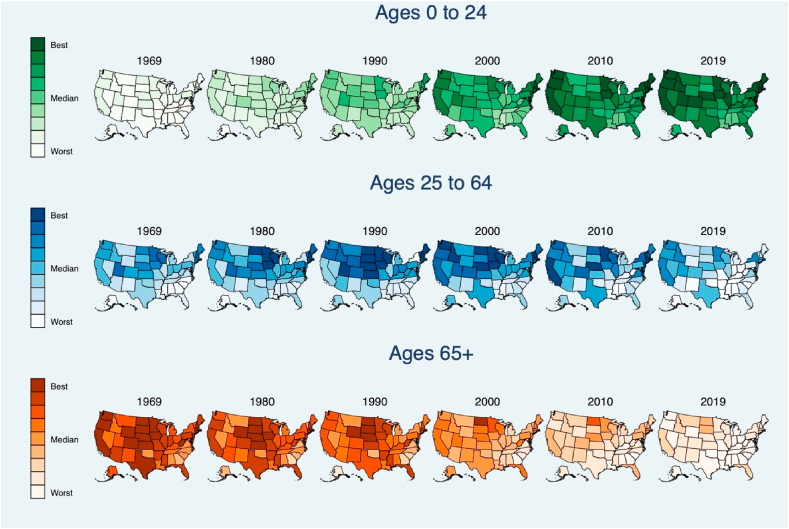
Objectives: To assess trends in national and state-level health equity in mortality for people up to age 25, ages 25-64 and aged 65 and older.
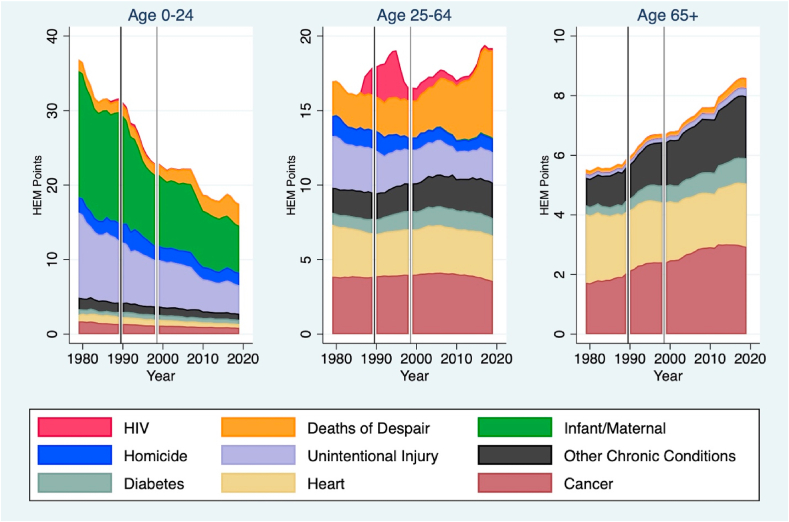
Methods: A health equity metric was calculated as the weighted mean life expectancy relative to a benchmark level, defined as the life expectancy of the most socially-privileged subpopulation (white, non-Latinx males with a college education or higher).We analyzed 114,558,346 death records from the National Center for Health Statistics, from January 1, 1969 to December 31, 2019 to estimate health equity annually at the national and state-level. Using ICD-9/ICD-10 classification codes, inequities in health were decomposed by major causes of death.
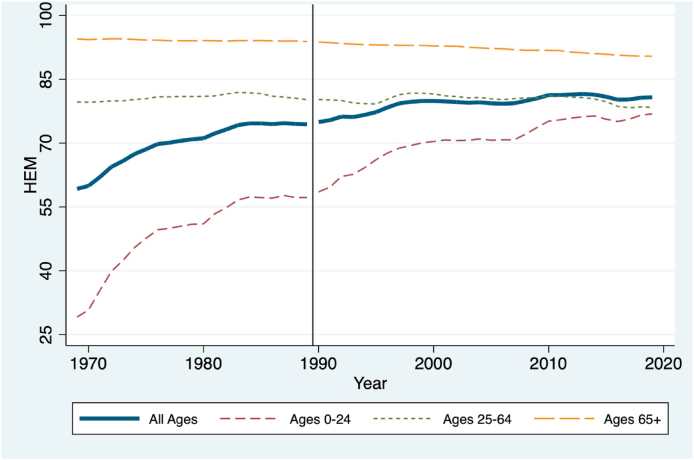
Results: From 1969 to 2019, health equity in the United States improved (+0.36 points annually [95% CI 0.31-0.41]), albeit at a slower rate over the last two decades (+0.08 points annually [95% CI 0.03-0.14] from 2000 to 2019, compared to +0.57 points annually from 1969 to 2000 [95% CI 0.50-0.65]). Health equity among those under 25 improved substantially (+0.82 points annually [95% CI 0.75-0.89]) but remained flat for adults 25-64 (-0.01 points annually [95% CI -0.03-0.003]) For those over 65, health equity displayed a downward trend (-0.08 points annually [95% CI -0.09 to -0.07]). Gains in equity from reduced unintentional injuries and homicides have been largely offset by rising mortality attributable to drug overdoses.
Conclusions: The US is failing to advance health equity, especially for adults. Keeping policy-makers accountable to a summary measure of health equity may help coordinate efforts at improving population health.
© 2021 The Authors.
Conflict of interest statement
None.
Figures

Similar articles
-
Trends in Health Equity in the United States by Race/Ethnicity, Sex, and Income, 1993-2017.JAMA Netw Open. 2019 Jun 5;2(6):e196386. doi: 10.1001/jamanetworkopen.2019.6386. JAMA Netw Open. 2019. PMID: 31251377 Free PMC article.
-
CDC National Health Report: leading causes of morbidity and mortality and associated behavioral risk and protective factors--United States, 2005-2013.MMWR Suppl. 2014 Oct 31;63(4):3-27. MMWR Suppl. 2014. PMID: 25356673
-
Comparison of All-Cause Mortality Rates and Inequities Between Black and White Populations Across the 30 Most Populous US Cities.JAMA Netw Open. 2021 Jan 4;4(1):e2032086. doi: 10.1001/jamanetworkopen.2020.32086. JAMA Netw Open. 2021. PMID: 33471116 Free PMC article.
-
The Minderoo-Monaco Commission on Plastics and Human Health.Ann Glob Health. 2023 Mar 21;89(1):23. doi: 10.5334/aogh.4056. eCollection 2023. Ann Glob Health. 2023. PMID: 36969097 Free PMC article. Review.
-
Increases in United States life expectancy through reductions in injury-related death.Popul Health Metr. 2017 Aug 30;15(1):32. doi: 10.1186/s12963-017-0150-4. Popul Health Metr. 2017. PMID: 28854976 Free PMC article. Review.
Cited by
-
Policy implementation and outcome evaluation: establishing a framework and expanding capacity for advocacy organizations to assess the impact of their work in public policy.Health Res Policy Syst. 2024 Feb 20;22(1):27. doi: 10.1186/s12961-024-01110-0. Health Res Policy Syst. 2024. PMID: 38378597 Free PMC article.
-
Somatotropic Axis, Pace of Life and Aging.Front Endocrinol (Lausanne). 2022 Jul 14;13:916139. doi: 10.3389/fendo.2022.916139. eCollection 2022. Front Endocrinol (Lausanne). 2022. PMID: 35909509 Free PMC article. Review.
-
Heterogeneity in Disparities in Life Expectancy Across US Metropolitan Areas.Epidemiology. 2022 Nov 1;33(6):890-899. doi: 10.1097/EDE.0000000000001537. Epub 2022 Oct 5. Epidemiology. 2022. PMID: 36220582 Free PMC article.
-
Trends and structural factors affecting health equity in the United States at the local level, 1990-2019.SSM Popul Health. 2024 Apr 25;26:101675. doi: 10.1016/j.ssmph.2024.101675. eCollection 2024 Jun. SSM Popul Health. 2024. PMID: 38711568 Free PMC article.
-
Mortality by Education Before and During the COVID-19 Pandemic, U.S., 2017-2020.Am J Prev Med. 2023 Jan;64(1):105-116. doi: 10.1016/j.amepre.2022.08.015. Epub 2022 Oct 13. Am J Prev Med. 2023. PMID: 36528352 Free PMC article.
References
-
- Anderson R.N., Miniño A.M., Hoyert D.L., Rosenberg H.M. In: National vital Statistics reports: Centers for disease control and prevention. Statistics N.C.f.H., editor. 2001. Comparability of cause of death between ICD–9 and ICD–10: Preliminary estimates. - PubMed
-
- Bosworth B. Increasing disparities in mortality by socioeconomic status. Annual Review of Public Health. 2018;39:237–251. - PubMed
-
- Braveman P., Arkin E., Orleans T., Proctor D., Plough A. What is health equity? And what difference does a definition make? R.W.J. Foundation; Princeton, NJ: 2017.
