. 2022 Jan 21;25(1):103602.
doi: 10.1016/j.isci.2021.103602. Epub 2021 Dec 8.

Standardized two-step testing of antibody activity in COVID-19 convalescent plasma

Affiliations

Standardized two-step testing of antibody activity in COVID-19 convalescent plasma

Pavlo Gilchuk et al. iScience. .

Abstract

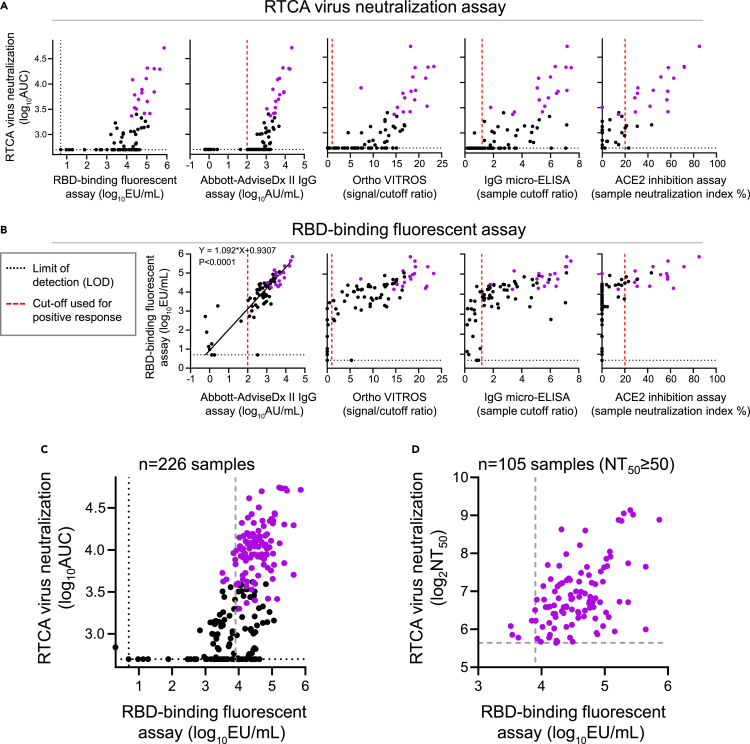
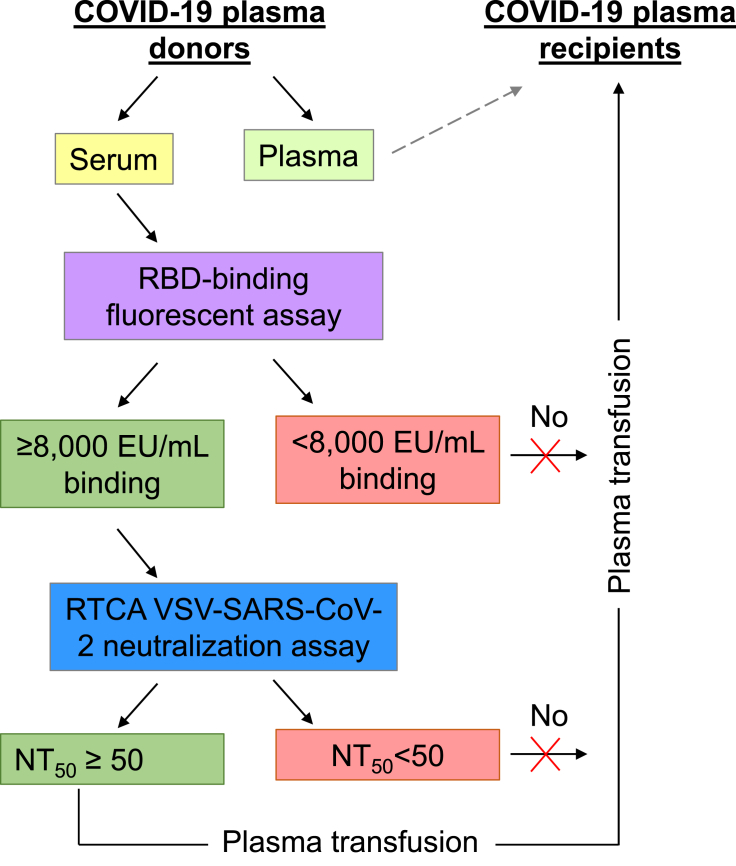
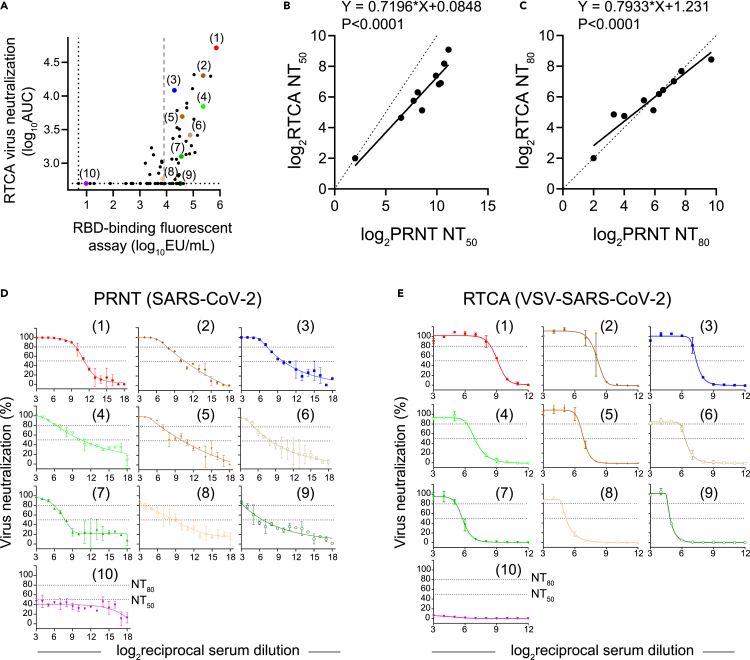
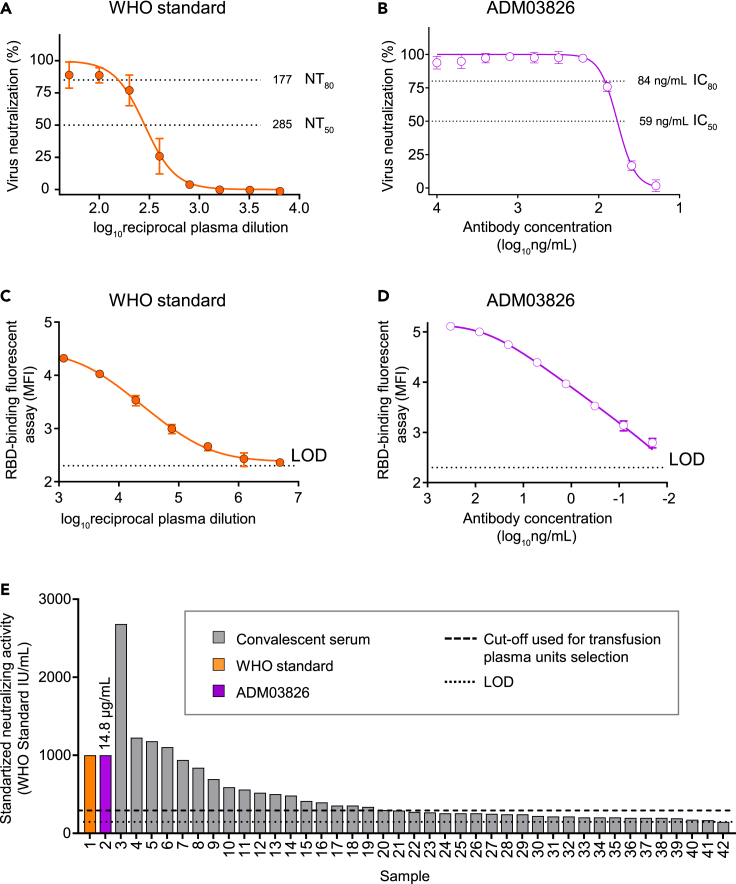
The COVID-19 pandemic revealed an urgent need for rapid profiling of neutralizing antibody responses and development of antibody therapeutics. The current Food and Drug Administration-approved serological tests do not measure antibody-mediated viral neutralization, and there is a need for standardized quantitative neutralization assays. We report a high-throughput two-step profiling approach for identifying neutralizing convalescent plasma. Screening and downselection for serum antibody binding to the receptor-binding domain are followed by quantitative neutralization testing using a chimeric vesicular stomatitis virus expressing spike protein of SARS-CoV-2 in a real-time cell analysis assay. This approach enables a predictive screening process for identifying plasma units that neutralize SARS-CoV-2. To calibrate antibody neutralizing activity in serum from convalescent plasma donors, we introduce a neutralizing antibody standard reagent composed of two human antibodies that neutralize SARS-CoV strains, including SARS-CoV-2 variants of concern. Our results provide a framework for establishing a standardized assessment of antibody-based interventions against COVID-19.

Keywords: Immunology; Virology.


Conflict of interest statement

I.T. reports grants from NIH/NIAID, during the conduct of the study, and has served as a consultant for Nashville Biosciences and Horizon Therapeutics. J. D. C., L.J.S., and M.R.D. report grants from NIH/NCATS, during the conduct of the study. T.W.R. reports grants from NIH/NCATS, during the conduct of the study; personal fees from Cumberland Pharmaceuticals, Inc, personal fees from Sanofi Pharma, and personal fees from Cytovale, outside the submitted work. T.G.S. reports grants from NIH, during the conduct of the study. W.H.S. reports grants from NCATS of the NIH, during the conduct of the study. M.S.D. is a consultant for Inbios, Vir Biotechnology, Fortress Biotech, and Carnival Corporation and on the Scientific Advisory Boards of Moderna and Immunome. The Diamond laboratory has received funding support in sponsored research agreements from Moderna, Vir Biotechnology, and Emergent BioSolutions. J.E.C. has served as a consultant for Luna Biologics, is a member of the Scientific Advisory Board of Meissa Vaccines and is Founder of IDBiologics. The Crowe laboratory at Vanderbilt University Medical Center has received sponsored research agreements from Takeda Vaccines, IDBiologics, and AstraZeneca and grants from NIH, and DARPA during the conduct of the study. Vanderbilt University has applied for patents related to antibodies described in this paper. All other authors declare no competing interests.

Figures

None
Graphical abstract
Figure 1
Figure 1
Analysis of accuracy and reproducibility of high-throughput automated RTCA neutralization assay measurements (A) Dose-response neutralization curves for potently neutralizing human monoclonal antibodies that were diluted in incubation medium or medium containing normal human serum at 1:50 dilution for the assay.. Antibodies tested included mAb COV2-2196 and a combination of two mAbs COV2-2130 and COV2-2381 designated as ADM03826. Neutralization was assessed against VSV-SARS-CoV-2 WA1/2020 virus. Data show mean ± SD of quadruplicates. (B) Representative dose-response RTCA neutralization curves for 76 convalescent serum samples as in (A). Each curve represents one sample. Data show mean of duplicates for one of two independent experiments. (C) Orthogonal (Deming) regression analysis of area under the curve mean values from two independent experiments as in (B). Duplicate measurements were performed for each independent experiment. Each dot represents one sample, the regression line is indicated with solid line, and line of identity is dotted. p value is indicated. LOD is 2.7 log10AUC. (D) Bland–Altman plot of AUC values from two independent experiments as in (C). Duplicate measurements were performed for each independent experiment. The 95% limits of agreement are shown as two dotted lines. (E) Orthogonal (Deming) regression analysis of NT50 values from two independent experiments as in (B). Duplicate measurements were performed for each independent experiment. Only 17 of 76 samples that revealed NT50 ≥ 50 are shown. The regression line is indicated with solid line, and dotted line indicates line of equal X and Y coordinates for every point. p value is indicated. (F) Bland–Altman plot of NT50 values from two independent experiments as in (E). Duplicate measurements were performed for each independent experiment. The 95% limits of agreement are shown as two dotted lines.
Figure 2
Figure 2
Relationship of the RTCA neutralization and binding measurements for convalescent human serum (A) Comparison of measurements from the high-throughput RTCA chimeric VSV-SARS-CoV-2 virus neutralization assay with those from the indicated binding assays using 76 serum samples. Seventeen samples from Figure 1D with NT50 values ≥50 are indicated using violet dots. Red dotted line indicates designated cutoff for commercial tests, and black dotted line depicts the assay limit of detection. (B) Comparison of measurements from high-throughput RBD-binding fluorescent assay with those from the indicated binding assays using 76 serum samples as in (A). Seventeen samples from Figure 1E with NT50 values ≥50 are shown using violet dots. Orthogonal (Deming) regression analysis was performed to compare RBD-binding fluorescent assay measurements to those from Abbot AdviseDx II IgG assay, and p value is indicated. (C) Relationship of RTCA and RBD-binding fluorescent assay measurements using a larger collection of 226 serum samples, which included 76 samples as in (A and B). Violet dots indicate 105 samples with NT50 values ≥50. Samples with an antibody-binding level above 8,000 EU/mL and NT50 values ≥50 were selected for transfusion in the trial. Gray dashed line is empirically defined cutoff for positive binding response as detailed in the STAR Methods section. (D) Relationship of RTCA and RBD-binding fluorescent assay measurements using 105 serum samples from (C) with NT50 values ≥50 are shown. Gray dashed lines indicate empirically defined cutoffs for positive binding and neutralizing responses as detailed in the STAR Methods section.
Figure 3
Figure 3
Two-step testing of antibody activity in serum to select COVID-19 convalescent plasma for transfusion trial A schematic of the sequential approach consisting of donor’s serum screening by RBD-binding fluorescent assay followed by antiviral potency quantification using the RTCA VSV-SARS-CoV-2 neutralization assay is shown. For transfusion trial, plasma units were selected based on serum screening results and included units with an estimated ≥8,000 EU/mL binding and NT50 ≥ 50 neutralizing activities.
Figure 4
Figure 4
Relationship between VSV-SARS-CoV-2 RTCA and authentic SARS-CoV-2 PRNT neutralization assay measurements (A) Ten samples from a panel of 76 selected for parallel testing using RTCA and PRNT neutralization assays are shown with color dots and numbers. Black dotted line indicates assay LOD, and gray dashed line indicates suggested cutoff for positive response as in Figure 1A. (B) Orthogonal (Deming) regression analysis of NT50 values from PRNT and RTCA neutralization assays. Each dot represents one sample, the regression line is indicated with solid line, and the line of identity is dotted. p value is indicated. (C) Orthogonal (Deming) regression analysis of NT80 values from PRNT and RTCA neutralization assays. Each dot represents one sample, the regression line is indicated with solid line, and the line of identity is dotted. p value is indicated. (D) Dose-response neutralization curves obtained from PRNT assay using authentic SARS-CoV-2 WA1/2020 virus. Data show mean ± SD of two independent experiments. Numbers in parentheses indicate designated identifiers for ten samples as in (A). (E) Dose-response neutralization curves obtained from RTCA assay using chimeric VSV-SARS-CoV-2 WA1/2020 virus. Numbers in parentheses indicate designated identifiers for ten samples as in (A). Data show mean ± SD of duplicates from one experiment (n = 2).
Figure 5
Figure 5
Standardization of RTCA neutralization assay measurements using internal reference anti-SARS-CoV-2 human immunoglobulin reagents (A) Dose-response RTCA neutralization curve for WHO international anti-SARS-CoV-2 human immunoglobulin standard using VSV-SARS-CoV-2 WA1/2020. Data show mean ± SD of quadruplicates. One representative of two independent experiments is shown. (B) Dose-response RTCA neutralization curve for ADM03826 that formulated with two potent human monoclonal antibodies using VSV-SARS-CoV-2 WA1/2020. Data show mean ± SD of quadruplicates. One representative of two independent experiments is shown. (C and D) Dose-response RBD-binding curve for WHO international anti-SARS-CoV-2 human immunoglobulin standard (C) and ADM03826 (D) using RBD-binding fluorescent assay. Data show mean ± SD of triplicates. MFI – median fluorescence intensity. One representative of two independent experiments is shown. (E) Forty convalescent serum samples (gray bars) are rank-ordered based on their neutralizing activity against VSV-SARS-CoV-2 WA1/202, which was determined using international units (IU) of neutralizing activity. ADM03826 was used as an internal reference to calibrate the activity in serum samples, and the activity of ADM03826 was pre-determined using WHO international anti-SARS-CoV-2 human immunoglobulin standard as in (A and B). The amount of ADM03826 monoclonal antibody with estimated activity of 1,000 IU (14.8 μg/mL) is shown for a comparative purpose (violet bar). Serum samples were analyzed in duplicates from serial two-fold dilutions starting from 1:25, and ADM03826 was analyzed in quadruplicates from serial two-fold dilutions starting from 1 μg/mL. Only 40 samples that revealed equal or greater than 80% virus neutralization at the lowest tested dilution (1:25) from total 76 tested samples are shown.
Figure 6
Figure 6
Neutralizing activity against SARS-CoV-2 variants of concern by the reagents used for standardization of RTCA neutralization assay (A and B) WHO Standard reagent (A) and ADM03826 (B) were assessed for neutralizing activity against authentic SARS-CoV-2 WA1/2020 bearing a D614G mutation (blue), a B.1.1.7 isolate (red), chimeric Wash-B.1.351 (green), chimeric Wash-B.1.1.28 (black), and authentic B.1.617.2 (gray) viruses by FRNT assay. Authentic SARS-CoV-2 WA1/2020 virus was used as a control for the parental virus (violet). (C) NT80 values were estimated from dose-response neutralization curves in (A and B). Serum samples were analyzed in duplicate from serial two-fold dilutions starting from 1:50, and ADM03826 was analyzed in duplicate from serial three-fold dilutions starting from 10 μg/mL. Data show mean ± SD of duplicates of two independent experiments (n = 4).

References

    1. Addetia A., Crawford K.H.D., Dingens A., Zhu H., Roychoudhury P., Huang M.L., Jerome K.R., Bloom J.D., Greninger A.L. Neutralizing antibodies correlate with protection from SARS-CoV-2 in humans during a fishery vessel outbreak with a high attack rate. J. Clin. Microbiol. 2020;58:e02107–e02120. - PMC - PubMed
    1. Anderson E.J., Rouphael N.G., Widge A.T., Jackson L.A., Roberts P.C., Makhene M., Chappell J.D., Denison M.R., Stevens L.J., Pruijssers A.J., et al. Safety and immunogenicity of SARS-CoV-2 mRNA-1273 vaccine in older adults. N.Engl. J. Med. 2020;383:2427–2438. - PMC - PubMed
    1. Baden L.R., El Sahly H.M., Essink B., Kotloff K., Frey S., Novak R., Diemert D., Spector S.A., Rouphael N., Creech C.B., et al. Efficacy and safety of the mRNA-1273 SARS-CoV-2 vaccine. N.Engl. J. Med. 2021;384:403–416. - PMC - PubMed
    1. Baum A., Ajithdoss D., Copin R., Zhou A., Lanza K., Negron N., Ni M., Wei Y., Mohammadi K., Musser B., et al. REGN-COV2 antibodies prevent and treat SARS-CoV-2 infection in rhesus macaques and hamsters. Science. 2020;370:1110–1115. - PMC - PubMed
    1. Bennett M., Yoder S., Brady E., Pulley J.M., Rhoads J.P., Stewart T.G., Bernard G.R., Creech C.B., Wheeler A.P., Thomsen I. A high-throughput liquid bead array assay confirms strong correlation between SARS-CoV-2 antibody level and COVID-19 severity. iScience. 2021;24:102052. - PMC - PubMed

LinkOut - more resources