. 2021 Nov 10;24(12):103415.
doi: 10.1016/j.isci.2021.103415. eCollection 2021 Dec 17.

Robust deep learning model for prognostic stratification of pancreatic ductal adenocarcinoma patients

Affiliations

Robust deep learning model for prognostic stratification of pancreatic ductal adenocarcinoma patients

Jie Ju et al. iScience. .

Abstract

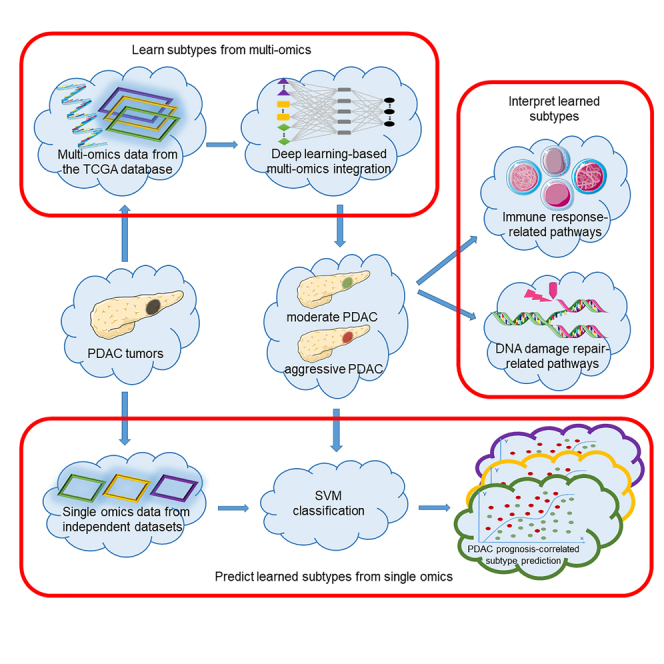
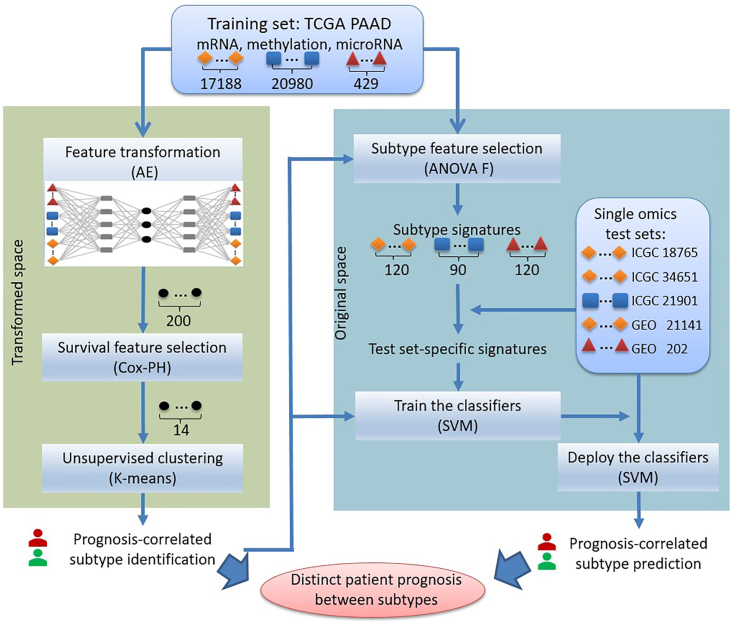
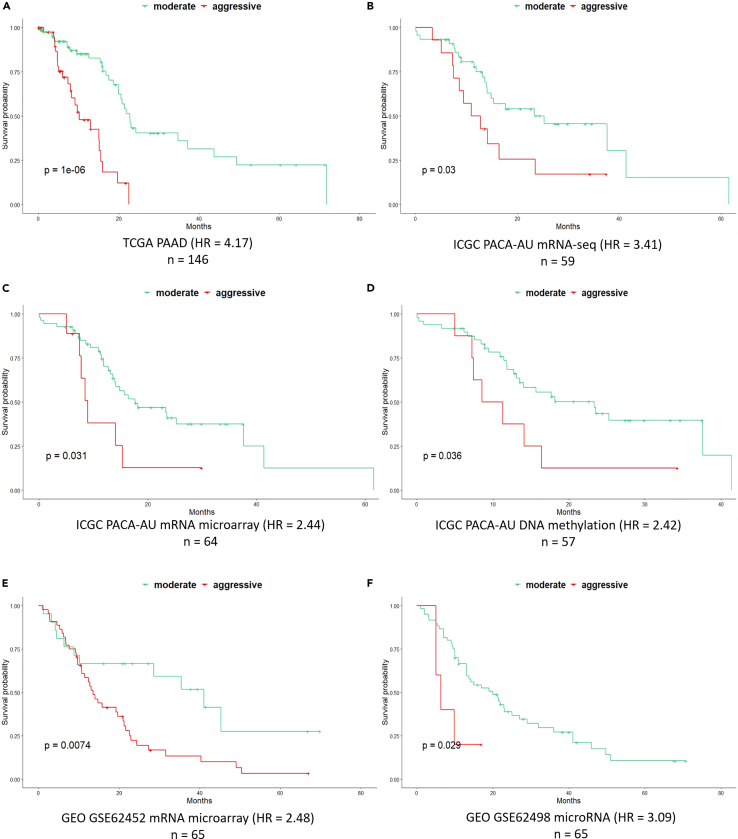
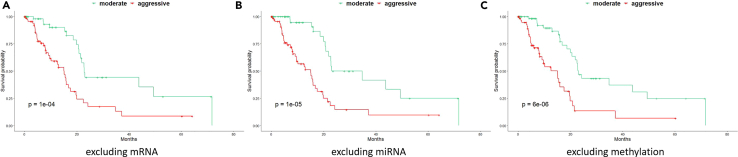
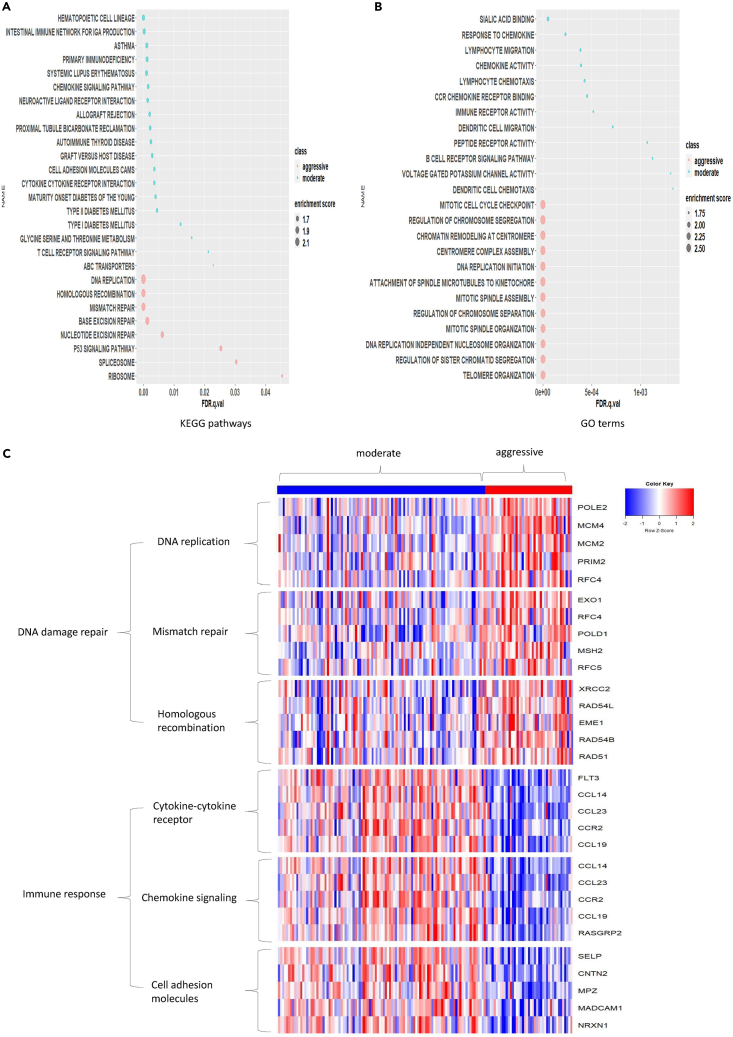
A major challenge for treating patients with pancreatic ductal adenocarcinoma (PDAC) is the unpredictability of their prognoses due to high heterogeneity. We present Multi-Omics DEep Learning for Prognosis-correlated subtyping (MODEL-P) to identify PDAC subtypes and to predict prognoses of new patients. MODEL-P was trained on autoencoder integrated multi-omics of 146 patients with PDAC together with their survival outcome. Using MODEL-P, we identified two PDAC subtypes with distinct survival outcomes (median survival 10.1 and 22.7 months, respectively, log rank p = 1 × 10⁻⁶), which correspond to DNA damage repair and immune response. We rigorously validated MODEL-P by stratifying patients in five independent datasets into these two survival groups and achieved significant survival difference, which is superior to current practice and other subtyping schemas. We believe the subtype-specific signatures would facilitate PDAC pathogenesis discovery, and MODEL-P can provide clinicians the prognoses information in the treatment decision-making to better gauge the benefits versus the risks.

Keywords: Biocomputational method; Cancer; Cancer systems biology.


Conflict of interest statement

The authors declare no competing interests.

Figures

None
Graphical abstract
Figure 1
Figure 1
Study design of MODEL-P First, the multi-omics features in the training set were integrated by autoencoder (AE), after which the transformed features were selected with regard to survival outcomes for clustering to identify the prognosis-correlated subtypes. Second, the features in the original space that differ between the prognosis-correlated subtypes were selected as subtype signatures. Afterward, we selected those subtype signatures that were present in the test sets as the test set-specific signatures. The classifiers were trained on the TCGA training set using these signatures and the predictions were made on the corresponding test sets. The numbers of features are given for each data type. AE, autoencoder; Cox-PH, Cox Proportional-Hazards model; SVM, support vector machine.
Figure 2
Figure 2
Results of PDAC prognosis subtype identification and prediction (A) Kaplan-Meier plot of two prognosis-correlated subtypes identified in the TCGA PAAD cohort, with a log rank p value of 1 × 10−6 and the hazard ratio of 4.17. (B–F) Kaplan-Meier plots of the prognosis-correlated subgroups predicted on five single omics test sets: (B). ICGC PACA-AU mRNA-seq, (C). ICGC PACA-AU mRNA microarray, (D) ICGC PACA-AU DNA methylation, (E). GEO GSE62452 mRNA microarray, (F) GEO GSE62498 microRNA. The log rank p values of the datasets are given in each individual plot, together with the name of the datasets, the sample sizes, and the hazard ratios below the plots.
Figure 3
Figure 3
Contributions of mRNA, microRNA, and methylation omics to subtype identification in TCGA PAAD cohort (A–C) In each Kaplan-Meier plot, the two subtypes were identified excluding (A) mRNA (log rank p value = 1 × 10−4), (B) microRNA (log rank p value = 1 × 10−5), or (C) methylation (log rank p value = 6 × 10−6). Note that a larger p value here indicates that leaving out that data type reduces the prognostic performance the most, i.e. the results need to be compared with Figure 2A.
Figure 4
Figure 4
KEGG pathways and biological processes enriched in PDAC “aggressive” and “moderate” subtypes identified from mRNA expressions on the TCGA training set (A) The KEGG pathways. (B) The top 12 GO terms. For A and B, the size of each circle represents the absolute value of the normalized enrichment scores and the color represents the subtype enriched in PDAC “aggressive” and “moderate” subtypes. (C) Heatmap of the KEGG pathways corresponding to DNA damage repair and immune response in “aggressive” and “moderate” subtypes, respectively. The top five ranked genes were given in the panel.
Figure 5
Figure 5
The percentage of each identified single-base substitution (SBS) signature in MODEL-P subtypes (A) The “moderate” subtype. (B) The “aggressive” subtype.

References

    1. Abadi M., Barham P., Chen J., Chen Z., Davis A., Dean J., Devin M., Ghemawat S., Irving G., Isard M., et al. Proceedings of the 12th USENIX conference on Operating Systems Design and Implementation. USENIX Association; 2016. TensorFlow: A system for Large-Scale Machine Learning; pp. 265–283. - DOI
    1. Aguirre A.J. Refining classification of pancreatic cancer subtypes to improve clinical care. Gastroenterology. 2018;155:1689–1691. - PubMed
    1. Alexandrov L.B., Nik-Zainal S., Wedge D.C., Aparicio S.A.J.R., Behjati S., Biankin A.V., Bignell G.R., Bolli N., Borg A., Børresen-Dale A.-L., et al. Signatures of mutational processes in human cancer. Nature. 2013;500:415–421. - PMC - PubMed
    1. Alexandrov L.B., Kim J., Haradhvala N.J., Huang M.N., Tian Ng A.W., Wu Y., Boot A., Covington K.R., Gordenin D.A., Bergstrom E.N., et al. The repertoire of mutational signatures in human cancer. Nature. 2020;578:94–101. - PMC - PubMed
    1. de Anda-Jáuregui G., Hernández-Lemus E. Computational Oncology in the multi-omics era: state of the art. Front. Oncol. 2020;10:423. - PMC - PubMed

LinkOut - more resources