Review
. 2022 Jul:89:101033.
doi: 10.1016/j.preteyeres.2021.101033. Epub 2021 Dec 11.

Diabetic macular ischaemia- a new therapeutic target?

Affiliations
Review

Diabetic macular ischaemia- a new therapeutic target?

Chui Ming Gemmy Cheung et al. Prog Retin Eye Res. 2022 Jul.

Abstract

Diabetic macular ischaemia (DMI) is traditionally defined and graded based on the angiographic evidence of an enlarged and irregular foveal avascular zone. However, these anatomical changes are not surrogate markers for visual impairment. We postulate that there are vascular phenotypes of DMI based on the relative perfusion deficits of various retinal capillary plexuses and choriocapillaris. This review highlights several mechanistic pathways, including the role of hypoxia and the complex relation between neurons, glia, and microvasculature. The current animal models are reviewed, with shortcomings noted. Therefore, utilising the advancing technology of optical coherence tomography angiography (OCTA) to identify the reversible DMI phenotypes may be the key to successful therapeutic interventions for DMI. However, there is a need to standardise the nomenclature of OCTA perfusion status. Visual acuity is not an ideal endpoint for DMI clinical trials. New trial endpoints that represent disease progression need to be developed before irreversible vision loss in patients with DMI. Natural history studies are required to determine the course of each vascular and neuronal parameter to define the DMI phenotypes. These DMI phenotypes may also partly explain the development and recurrence of diabetic macular oedema. It is also currently unclear where and how DMI fits into the diabetic retinopathy severity scales, further highlighting the need to better define the progression of diabetic retinopathy and DMI based on both multimodal imaging and visual function. Finally, we discuss a complete set of proposed therapeutic pathways for DMI, including cell-based therapies that may provide restorative potential.

Keywords: Diabetic macular ischaemia; Diabetic macular oedema; Diabetic retinopathy; Foveal avascular zone; Optical coherence tomography; Optical coherence tomography angiography.


Conflict of interest statement

Declarations of interest

Chui Ming Gemmy Cheung: Bayer, Novartis, Roche, Allergan, Boehringer-Ingelheim, Topcon, Zeiss.

Amani Fawzi: Roche, Regeneron, Genentech, Boehringer-Ingelheim.

Kelvin YC Teo: Bayer, Novartis, Roche.

Sagnik Sen: None.

Hisashi Fukuyama: None.

Wei-Shan Tsai: None.

Sobha Sivaprasad has received funding/fees from Bayer, Novartis, Allergan, Roche, Boehringer Ingelheim, Optos, Oxurion, Oculis, Biogen, Apellis and Heidelberg Engineering.

Figures

Fig. 1.
Fig. 1.
Schematic to represent the arrangement of the three retinal plexuses. The superficial capillary plexus (SCP) is located between the retinal ganglion cell layer (RGCL) and the superficial portion of the inner plexiform layer (IPL). The intermediate capillary plexus (ICP), also known as the middle capillary plexus (MCP), starts from the inner border of the IPL to the superficial portion of the inner nuclear layer (INL). The deep capillary plexus (DCP) is distributed across the outer border of the INL. DCP = deep capillary plexus; HFL = Henle’s fibre layer; ICP = intermediate capillary plexus; INL = inner nuclear layer; IPL = inner plexiform layer; MCP = middle capillary plexus; OLM = outer limiting membrane; ONL = outer nuclear layer; OPL = outer plexiform layer; RGCL = retinal ganglion cell layer; SCP = superficial capillary plexuses. Figure courtesy of Nesper PL and Fawzi AA from Human Parafoveal Capillary Vascular Anatomy and Connectivity Revealed by Optical Coherence Tomography Angiography. Invest Ophthalmol Vis Sci. 2018 Aug 1; 59(10):3858–3867. https://doi.org/10.1167/iovs.18-24710.
Fig. 2.
Fig. 2.
Categorisation of diabetic macular ischaemia quantification on optical coherence tomography angiography (above) and fluorescein angiography (below). DMI = diabetic macular ischaemia; FA = fluorescein angiography; FAZ = foveal avascular zone; OCTA = optical coherence tomography.
Fig. 3.
Fig. 3.
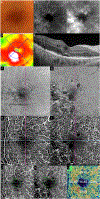
Multimodal imaging of an eye with diabetic maculopathy and diabetic macula ischaemia. (A) The colour fundus photograph illustrates the presence of dot and blot haemorrhages in the macula. (B) In the early phase of fluorescein angiography, microaneurysms can be seen. The foveal avascular zone is acircular and enlarged (dotted yellow line). (C) In the late phase of fluorescein angiography, diffuse leakage suggests the presence of macular oedema. Large cysts are detected as areas of well-circumscribed, circular areas of hyperfluorescence (*). These cysts are also represented by the * symbol in the optical coherence tomography (OCT) structural (G) and OCT angiography scans (K). (D) The Distribution of oedema can be appreciated in en face OCT retinal thickness map and the corresponding cross-sectional OCT scan (E). (E) showed the presence of intraretinal cysts and subretinal fluid, further confirming the presence of macular oedema. The central subfield thickness is 403 μm. F to L are images from Triton/Topcon platform. (F and G) are the structural enface OCT scans of the superficial capillary plexus (SCP) and the deep capillary plexus (DCP). Retinal cysts are much better appreciated on the structural scan of the DCP (G), with the three corresponding cysts on the other scans denoted by (*). H to L are images from OCT angiography (OCTA) covering a 3 × 3 mm area centred over the fovea. H and I are unannotated OCTA scans of the SCP and the DCP, respectively. (H) The FAZ outline is acircular and enlarged, with reduced perfusion in the perifoveal area. (I) In the corresponding deep plexus OCT angiography, the FAZ area appears larger than that in the superficial plexus. The capillary bed appears disrupted in the area inferotemporal to the fovea centre. J (SCP) and K (DCP) are the same OCTA images in H and L, with annotated areas of FAZ outlined manually in green and areas calculated automatically. The intraretinal cysts are marked by (*). (L) The automated perfusion density scan shows the proportion of perfused (areas with the flow) versus the total area of interest. This automated perfusion density measure is an inbuilt algorithm within the Imagenet (Topcon) software.
Fig. 4.
Fig. 4.
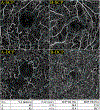
Examples of the quantification of perfusion density, vessel length density, and foveal avascular zone (FAZ) generated by the in-built algorithms available on the commercial OCTA instruments. This figure shows the automated readouts and presentation modes on the three commercially available OCTA platforms. The first column shows the unannotated OCTA images of the superficial plexus of a normal eye. The second column shows the perfusion density (expressed as a percentage of white pixels over the region of interest). The third column shows the vessel length density currently only available on the Cirrus (Zeiss platform). The last column shows the detection and quantification of the foveal avascular zone available on the Angiovue/Optovue and Cirrus/Zeiss. OCTA = optical coherence tomography angiography.
Fig. 5.
Fig. 5.
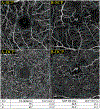
Challenges in interpreting the foveal avascular zone (FAZ) and the associated areas of capillary dropout in the perifoveal area. In this eye with DMI imaged by two commercial OCTA instruments (Top row: Cirrus, Zeiss; bottom row: Triton, Topcon), the true extent of the enlarged FAZ seen in the superficial capillary plexus (SCP) could not be reliably determined. The left-most column shows the original OCTA without delineation of the FAZ. The middle column is a conservative outline of the FAZ, but the perifoveal dropout is not reflected. The right-most column shows the FAZ outline, which considers the “moth-eaten” perifoveal areas where the capillary bed is deficient. This strategy results in a much larger FAZ readout. There is potential for significant variation in the FAZ area readout depending on the inclusion of the perifoveal nonperfusion area. This example illustrates that the FAZ area alone does not adequately describe the severity and the extent of DMI. Additional parameters to ascertain the actual ischaemia include perifoveal intercapillary area, total avascular area and extrafoveal avascular area. DMI = diabetic macular ischaemia; FAZ = foveal avascular zone; OCTA = optical coherence tomography angiography; SCP = superficial capillary plexus.
Fig. 6.
Fig. 6.
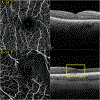
Potential artefacts and inaccurate DMI assessments in eyes with co-existing DMO (upper row) or DRIL (lower row). This figure illustrates the importance of interpreting OCTA with structural OCT (both cross-sectional and en face). A confluent area of perifoveal non-perfusion can be seen. Within this area, two locations (marked by a white asterisk and a white rectangle) are of specific interest. In the upper row, intraretinal cysts (*) can be identified in the structural OCT. The cyst appears as part of the confluent flow void in the superficial and deep layers on OCTA. It is challenging to determine whether this flow void represents the true capillary dropout. In the lower row, the area within the non-perfused area denoted by the rectangular white box on OCTA corresponds to an area of DRIL on cross-sectional OCT. There is corresponding retina thinning on the en-face structural retinal thickness map. It is important in both cases that co-existing structural changes are corrected during segmentation (with manual segmentation performed if necessary) to ensure accurate presentation of flow or non-flow areas on the en-face OCTA scans. The corresponding OCTA density maps are shown on the two left-most images in the bottom row. DMI = diabetic macular ischaemia; DMO = diabetic macular oedema; DRIL = disorganisation of the retinal inner layers; DVP = deep vascular plexus; OCT = optical coherence tomography; OCTA = optical coherence tomography angiography; SVP = superficial vascular plexus.
Fig. 7.
Fig. 7.
Schematic representation of the impact of DMI alone or in combination with neuronal injury, inflammation and impaired outflow on visual function. BRB = blood-retinal barrier; CC = choriocapillaris; DCP = deep capillary plexus; DMI = diabetic macular ischaemia; DMO = diabetic macular oedema; DRIL = disorganisation of retinal inner layers; DVP = deep vascular plexus; RGC = retinal ganglion cells; SVP = superficial vascular plexus; VEGF = vascular endothelial growth factor.
Fig. 8.
Fig. 8.
An enlarged foveal avascular zone is not always an indicator of poor visual acuity. For example, eye A had an enormous FAZ area of 1.00 mm2 with a poor VA of 40 letters. In contrast, eye B had a similar FAZ size but could read 85 letters on VA examination. Therefore, other vascular parameters, such as SCP VD, DCP VD, the FAZ perimeter and the FAZ-AI should also be considered when evaluating a patient’s functional visual outcome. AI = acircularity index; DCP = deep capillary plexus; FAZ = foveal avascular zone; SCP = superficial capillary plexus; VA = visual acuity; VD = vessel density.
Fig. 9.
Fig. 9.
Examples of eyes with generalised diabetic macular ischaemia (DMI). Generalised DMI presents with a profound reduction in both the SCP and DCP VD. Interestingly, even with severely decreased VD, the VA is not always declined. For instance, eye A and eye B both had a reduced vessel density in the superficial and deep capillary plexus. However, eye B identified much more letters than eye A did. DCP = deep capillary plexus; DMI = diabetic macular ischaemia; FAZ = foveal avascular zone; SCP = superficial capillary plexus; VA = visual acuity; VD = vessel density.
Fig. 10.
Fig. 10.
A case of predominant-DCP ischaemia. An eye with a more reduced deep vessel density may represent a more severe phenotype of diabetic macular ischaemia. In this example, the vessel density was 43% in the SCP and 37.5% in the DCP. The patient had moderate visual impairment and scored 73 letters using the ETDRS chart. DCP = deep capillary plexus; ETDRS = Early Treatment Diabetic Retinopathy Study; SCP = superficial capillary plexus.
Fig. 11.
Fig. 11.
Predominant SCP-ischaemia and its relevant visual performance. Both eye A and eye B had a substantially decreased VD in the SCP whilst the DCP VD was preserved. Notably, this phenotype of DMI also had varying degrees of visual impairment but was generally less severe. DCP = deep capillary plexus; DMI = diabetic macular ischaemia; FAZ = foveal avascular zone; SCP = superficial capillary plexus; VA = visual acuity; VD = vessel density.
Fig. 12.
Fig. 12.
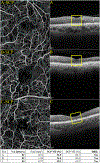
A reduced SCP VD on OCTA does not always correspond to the DRIL on OCT. For example, both eye A and eye B had a reduced superficial VD (39% and 25.4%, respectively). However, only eye B presented with DRIL (yellow rectangle). DRIL = disorganisation of retinal inner layers; OCT = optical coherence tomography; OCTA = optical coherence tomography angiography; SCP = superficial capillary plexus; VD = vessel density.
Fig. 13.
Fig. 13.
Patients with a reduced SCP VD and DRIL are not necessarily associated with poor visual acuity. The discrepancies reflect that there may be a higher threshold for jeopardising the visual performance. DCP = deep capillary plexus; DRIL = disorganisation of retinal inner layers; FAZ = foveal avascular zone; SCP = superficial capillary plexus; VA = visual acuity; VD = vessel density.
Fig. 14.
Fig. 14.
A schematic diagram of the relationship between semaphoring 3A (SEMA3A), neuropilin-1 (NRP1), and vascular endothelial growth factor A (VEGF-A). The border of the non-perfused area and perfused retina is surrounded by VEGF-A and SEMA3A molecules, both produced by the inner retina in response to hypoxia. While VEGF-A has its own receptors (VEGFR1 and VEGFR2), VEGF-A also binds to NRP1, which has both the VEGF and SEMA binding domains. These two domains have opposing effects on the non-perfused retina. VEGF-A stimulates retinal neovascularisation, and thus new vessels develop at the junction between the perfused and non-perfused areas (red arrows). SEMA3A prevents these new vessels from growing into the non-perfused areas, and hence they grow towards the vitreous. NRP = neuropilin; VEGF = vascular endothelial growth factor; VEGFR = vascular endothelial growth factor receptor; SEMA = semaphorin.

References

    1. Diabetic Retinopathy Clinical Research, N., Elman MJ., Aiello LP., Beck RW., Bressler NM., Bressler SB., Edwards AR., Ferris FL 3rd., Friedman SM., Glassman AR., Miller KM., Scott IU., Stockdale CR., Sun JK, 2010. Randomized trial evaluating ranibizumab plus prompt or deferred laser or triamcinolone plus prompt laser for diabetic macular edema. Ophthalmology 117, 1064–1077 e1035. - PMC - PubMed
    1. Abdelshafy M, Abdelshafy A, 2020. Correlations between optical coherence tomography angiography parameters and the visual acuity in patients with diabetic retinopathy. Clin. Ophthalmol. 14, 1107–1115. - PMC - PubMed
    1. Agemy SA, Scripsema NK, Shah CM, Chui T, Garcia PM, Lee JG, Gentile RC, Hsiao Y-S, Zhou Q, Ko T, 2015. Retinal vascular perfusion density mapping using optical coherence tomography angiography in normals and diabetic retinopathy patients. Retina 35, 2353–2363. - PubMed
    1. Aiello LP, Cahill MT, Wong JS, 2001. Systemic considerations in the management of diabetic retinopathy. Am. J. Ophthalmol. 132, 760–776. - PubMed
    1. Al-Sheikh M, Akil H, Pfau M, Sadda SR, 2016. Swept-source OCT angiography imaging of the foveal avascular zone and macular capillary network density in diabetic retinopathy. Investig. Ophthalmol. Vis. Sci. 57, 3907–3913. - PubMed

Publication types