. 2021 Dec 21;12(6):e0185721.
doi: 10.1128/mBio.01857-21. Epub 2021 Dec 14.

Successional Stages in Infant Gut Microbiota Maturation

Affiliations

Successional Stages in Infant Gut Microbiota Maturation

Leen Beller et al. mBio. .

Abstract

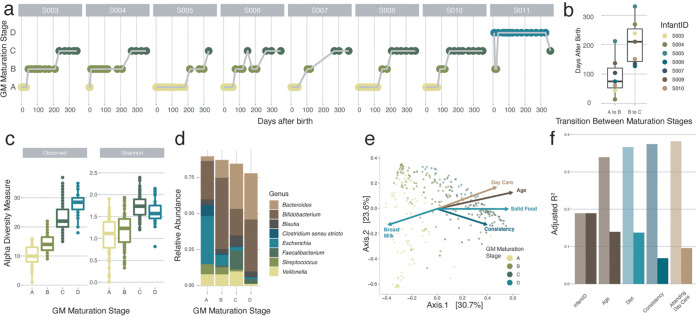
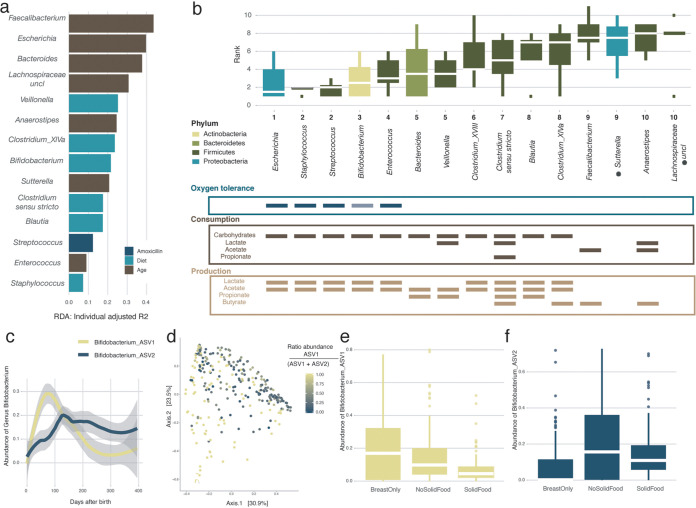
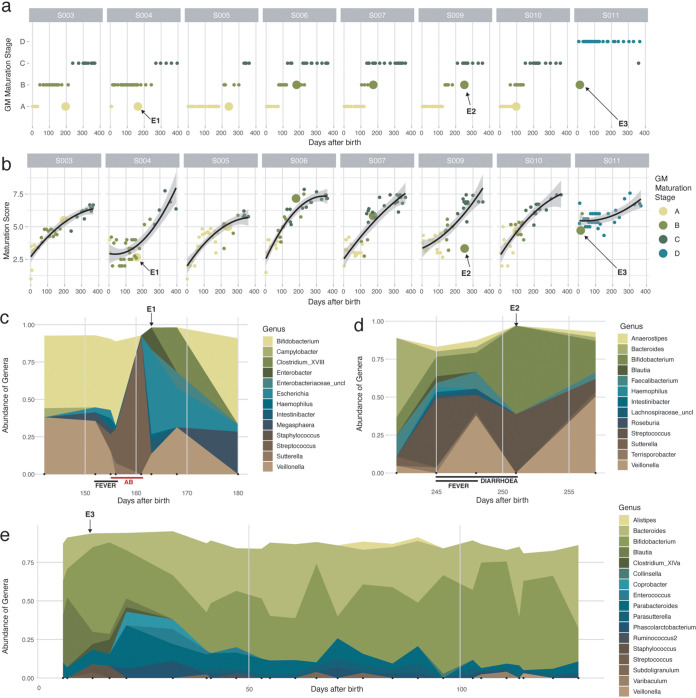
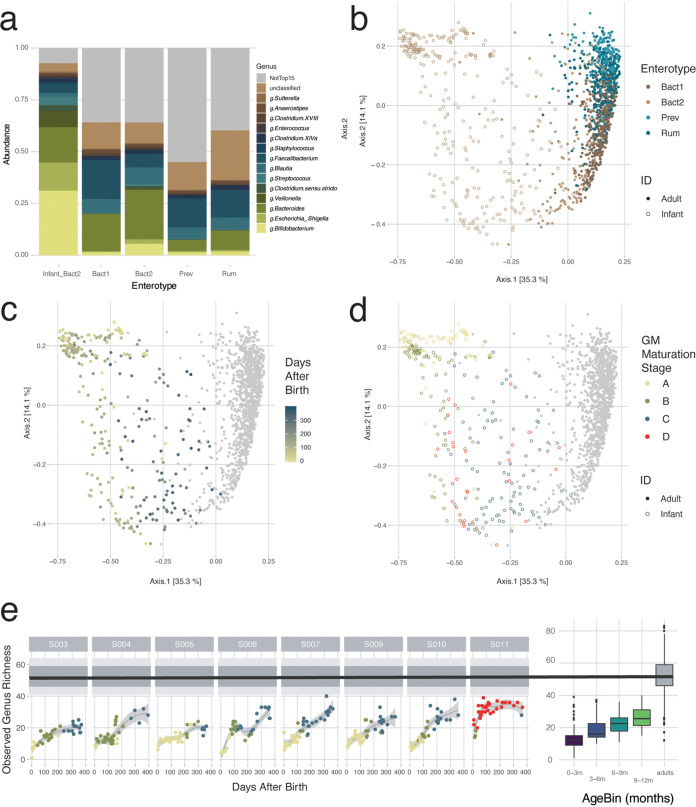
Disturbances in the primary colonization of the infant gut can result in lifelong consequences and have been associated with a range of host conditions. Although early-life factors have been shown to affect infant gut microbiota development, our current understanding of human gut colonization in early life remains limited. To gain more insights into the unique dynamics of this rapidly evolving ecosystem, we investigated the microbiota over the first year of life in eight densely sampled infants (n = 303 total samples). To evaluate the gut microbiota maturation transition toward an adult configuration, we compared the microbiome composition of the infants to that of the Flemish Gut Flora Project (FGFP) population (n = 1,106). We observed the infant gut microbiota to mature through three distinct, conserved stages of ecosystem development. Across these successional gut microbiota maturation stages, the genus predominance was observed to shift from Escherichia over Bifidobacterium to Bacteroides. Both disease and antibiotic treatment were observed to be associated occasionally with gut microbiota maturation stage regression, a transient setback in microbiota maturation dynamics. Although the studied microbiota trajectories evolved to more adult-like constellations, microbiome community typing against the background of the FGFP cohort clustered all infant samples within the (in adults) potentially dysbiotic Bacteroides 2 (Bact2) enterotype. We confirmed the similarities between infant gut microbial colonization and adult dysbiosis. Profound knowledge about the primary gut colonization process in infants might provide crucial insights into how the secondary colonization of a dysbiotic adult gut can be redirected. IMPORTANCE After birth, microbial colonization of the infant intestinal tract is important for health later in life. However, this initial process is highly dynamic and influenced by many factors. Studying this process in detail requires a dense longitudinal sampling effort. In the current study, the bacterial microbiota of >300 stool samples was analyzed from 8 healthy infants, suggesting that the infant gut microbial population matures along a path involving distinct microbial constellations and that the timing of these transitions is infant specific and can temporarily retrace upon external events. We also showed that the infant microbial populations show similarities to suboptimal bacterial populations in the guts of adults. These insights are crucial for a better understanding of the dynamics and characteristics of a "healthy gut microbial population" in both infants and adults and might allow the identification of intervention targets in cases of microbial disturbances or disease.

Keywords: enterotypes; infant; microbiota; primary succession.


Conflict of interest statement

The authors declare no conflict of interest.

We declare that we have no competing interests.

Figures

FIG 1
FIG 1
Detailed overview of the colonization process in the healthy infant gut at the genus level. (a) Overview of the gut microbiota (GM) maturation stage succession of the samples of all the infants over time, colored by the assigned gut microbiota maturation stages determined using the DMM approach (calculated on all samples [n = 303] and shown here for the samples at predefined time points where the infants were not sick [n = 142]). (b) Variation in the timing of the transition between the gut microbiota maturation stages in the different infants. The body of the box plots represents the first and third quartiles of the distribution and the median line. (c) Alpha diversity measures (observed ASV richness and Shannon diversity) of the samples within every gut microbiota maturation stage, increasing from stages A to C (comparisons of gut microbiota maturation stage A with stage B and stage B with stage C, n = [182:176], post hoc Dunn test [phD], r = [−0.35:−0.60], and FDR < 0.05). (d) Mean relative abundances of the most common genera at every gut microbiota maturation stage. (e) Principal-coordinate analysis (PCoA) (Bray-Curtis dissimilarity) representing genus-level microbiome variation in our infant cohort (n = 299). Dots represent one sample and are colored by their assigned gut microbiota maturation stage. The arrows represent the effect size and direction of the post hoc fit of variables significantly associated with microbiota compositional variation (univariate distance-based redundancy analysis [dbRDA]) (infant identification was excluded for clarity). (f) Covariates with nonredundant explanatory power on the genus-level ordination, determined by multivariate dbRDA at the genus level (Bray-Curtis dissimilarity; FDR < 0.05). The light bars represent the cumulative explanatory power (stepwise dbRDA R2), and the darker bars represent the individual univariate explanatory power of the variables (dbRDA R2). Covariates present in fewer than three infants were excluded.
FIG 2
FIG 2
Order of appearance of the most common genera in the infant gut. (a) Overview of the covariates with the highest explanatory power for the variation of the top 15 genera in our infant cohort, beyond interinfant variability (note that for Clostridium cluster XVIII, no significance was reached). A multivariate distance-based redundancy analysis (dbRDA) was carried out on the relative abundances of each genus, after constraining for infant identification (FDR < 0.05). The length of the horizontal bars represents the explanatory power of the most significant covariate (stepwise dbRDA R2). (b) Order of appearance (presence defined as an abundance of >0.5%) of the top 15 most abundant genera in the infant gut. The box plots are ordered based on their appearance along the timeline (age) of the infants. The box plots are colored according to the phylum to which the genus belongs. Shown below the box plots are the oxygen tolerance of the different genera (note that Bifidobacterium, while normally assumed to be a strict anaerobe, is found to be oxygen tolerant in the human gut [16]) and the consumption and production of different short-chain fatty acids (SCFAs) by the different genera based on the literature (15, 17, 18). The body of the box plots represents the first and third quartiles of the distribution and the median line. The asterisks indicate the genera for which no information was available. (c) Average relative abundances of the different Bifidobacterium amplicon sequence variants (ASVs) over time averaged over all infants (locally estimated scatterplot smoothing [LOESS]). (d) Genus-level principal-coordinate analysis (PCoA) (Bray-Curtis dissimilarity) (n = 299), colored for the ratio of the two most abundant Bifidobacterium ASVs. (e) Effect of food on the relative abundance of Bifidobacterium ASV1 showing a higher absence during weaning (breast milk only:no solid food versus solid food, n = [236:185], post hoc Dunn [phD] test, r > 0.25, and FDR < 0.05). (f) Effect of food on the relative abundance of Bifidobacterium ASV2 showing an increase in samples where the infants had a formula milk-based diet (with or without solid food) (breast milk only versus no solid food:solid food, n = [177:236], phD, r > 0.3, and FDR < 0.05) (see Table S1g in the supplemental material).
FIG 3
FIG 3
Effect of external factors on the infant gut microbiome. (a) Succession of the gut microbiota maturation stages over time, including all 303 time points from the BaBel data set. Time points representing a return to a previous gut microbiota maturation stage (after at least 2 samples from the next gut microbiota maturation stage) are represented with larger dots. (b) Changes in the maturation scores of the samples over time. The maturation score was calculated by averaging the ranks (based on their order of appearance) of the genera present in every sample. The black line represents the quadratic regression with the 95% confidence interval (all P values of the quadratic fits are <0.0002). Three events for which the succession goes back to a previous gut microbiota maturation stage (shown in Fig. 4a) and the maturation score drops (outside the confidence interval) are indicated with arrows. (c) Changes in bacterial abundance during the antibiotic (AB) event in infant S004 (“E1” at day 163) (abundances of >0.02 are shown). The red line indicates the duration of treatment (7 days) with antibiotics (amoxicillin and clavulanic acid). (d) Changes in abundance during Cryptosporidium infection in infant S009 (“E2” at day 251) (abundances of >0.02 are shown). (e) Changes in abundances in the first half-year in infant S011 (“E3” at days 13 to 21) (abundances of >0.05 are shown).
FIG 4
FIG 4
Projection of the infant samples to adult samples of the Flemish Gut Flora Project (FGFP) data set. (a) Bar plots showing the average relative abundances of the top 15 most common bacterial genera of the infant samples and the adult samples, per enterotype. (b to d) Projection of the infant samples to the adult FGFP data set, visualized by principal-coordinate analysis (PCoA) (Bray-Curtis dissimilarity), colored for enterotype (b), colored for time after birth (for the infant samples) (c), and colored per gut microbiota maturation stage (d). (e) Observed genus-level richness over time of the BaBel data set (LOESS), compared to the observed genus-level richness of the FGFP data set (the black line is the median, the dark gray area represents the 25 to 75% interquartile range [IQR], and the light gray area represents the 10 to 90% IQR). On the right side, the box plots represent the genus-level richness for the different infant age bins, compared to the adult FGFP data set. The body of the box plots represents the first and third quartiles of the distribution and the median line.

References

    1. Lewis JD, Chen EZ, Baldassano RN, Otley AR, Griffiths AM, Lee D, Bittinger K, Bailey A, Friedman ES, Hoffmann C, Albenberg L, Sinha R, Compher C, Gilroy E, Nessel L, Grant A, Chehoud C, Li H, Wu GD, Bushman FD. 2015. Inflammation, antibiotics, and diet as environmental stressors of the gut microbiome in pediatric Crohn’s disease. Cell Host Microbe 18:489–500. doi:10.1016/j.chom.2015.09.008. - DOI - PMC - PubMed
    1. Arrieta M-C, Arévalo A, Stiemsma L, Dimitriu P, Chico ME, Loor S, Vaca M, Boutin RCT, Morien E, Jin M, Turvey SE, Walter J, Parfrey LW, Cooper PJ, Finlay B. 2018. Associations between infant fungal and bacterial dysbiosis and childhood atopic wheeze in a nonindustrialized setting. J Allergy Clin Immunol 142:424–434.e10. doi:10.1016/j.jaci.2017.08.041. - DOI - PMC - PubMed
    1. Vatanen T, Franzosa EA, Schwager R, Tripathi S, Arthur TD, Vehik K, Lernmark Å, Hagopian WA, Rewers MJ, She J-X, Toppari J, Ziegler A-G, Akolkar B, Krischer JP, Stewart CJ, Ajami NJ, Petrosino JF, Gevers D, Lähdesmäki H, Vlamakis H, Huttenhower C, Xavier RJ. 2018. The human gut microbiome in early-onset type 1 diabetes from the TEDDY study. Nature 562:589–594. doi:10.1038/s41586-018-0620-2. - DOI - PMC - PubMed
    1. Stewart CJ, Ajami NJ, O’Brien JL, Hutchinson DS, Smith DP, Wong MC, Ross MC, Lloyd RE, Doddapaneni H, Metcalf GA, Muzny D, Gibbs RA, Vatanen T, Huttenhower C, Xavier RJ, Rewers M, Hagopian W, Toppari J, Ziegler A-G, She J-X, Akolkar B, Lernmark A, Hyoty H, Vehik K, Krischer JP, Petrosino JF. 2018. Temporal development of the gut microbiome in early childhood from the TEDDY study. Nature 562:583–588. doi:10.1038/s41586-018-0617-x. - DOI - PMC - PubMed
    1. Bäckhed F, Roswall J, Peng Y, Feng Q, Jia H, Kovatcheva-Datchary P, Li Y, Xia Y, Xie H, Zhong H, Khan MT, Zhang J, Li J, Xiao L, Al-Aama J, Zhang D, Lee YS, Kotowska D, Colding C, Tremaroli V, Yin Y, Bergman S, Xu X, Madsen L, Kristiansen K, Dahlgren J, Wang J. 2015. Dynamics and stabilization of the human gut microbiome during the first year of life. Cell Host Microbe 17:852. doi:10.1016/j.chom.2015.05.012. - DOI - PubMed

Publication types

LinkOut - more resources