. 2021 Dec 21;12(6):e0278421.
doi: 10.1128/mBio.02784-21. Epub 2021 Dec 14.

Lentiviral Infections Persist in Brain despite Effective Antiretroviral Therapy and Neuroimmune Activation

Affiliations

Lentiviral Infections Persist in Brain despite Effective Antiretroviral Therapy and Neuroimmune Activation

Nazanin Mohammadzadeh et al. mBio. .

Abstract

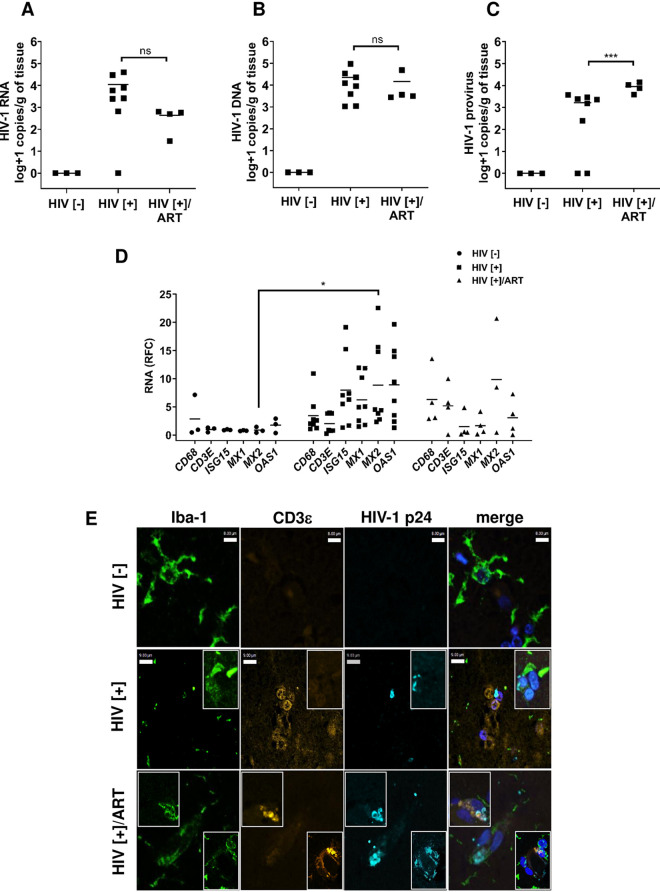
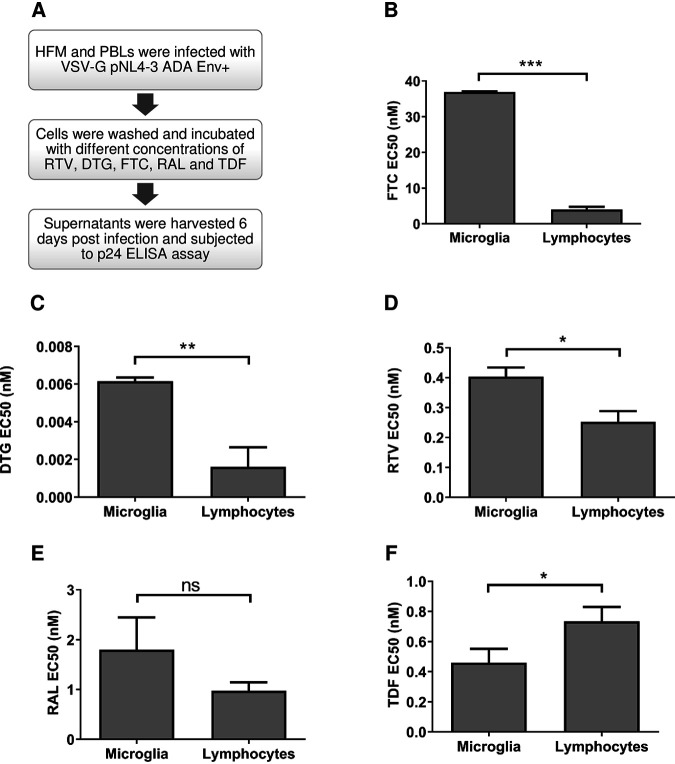
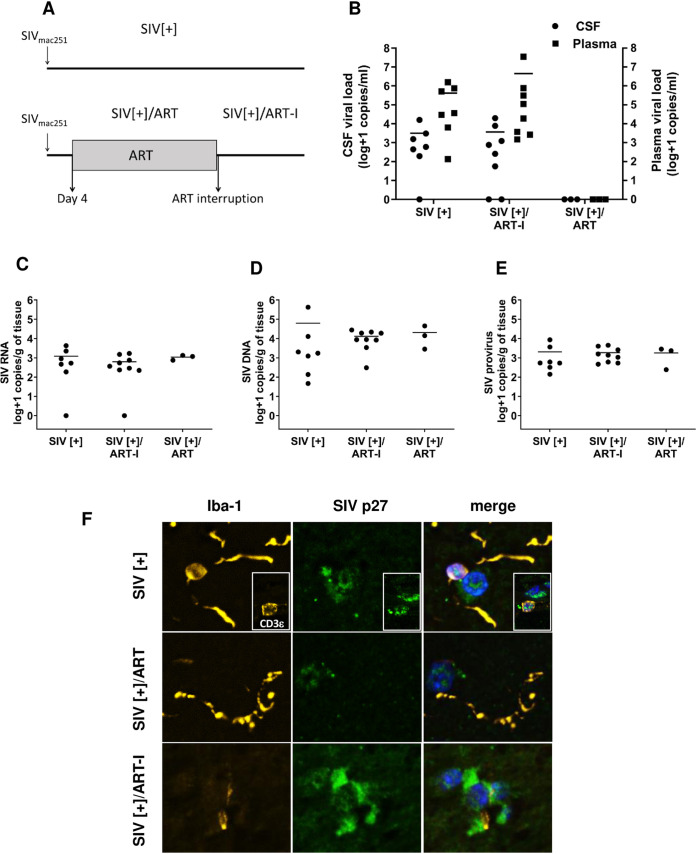
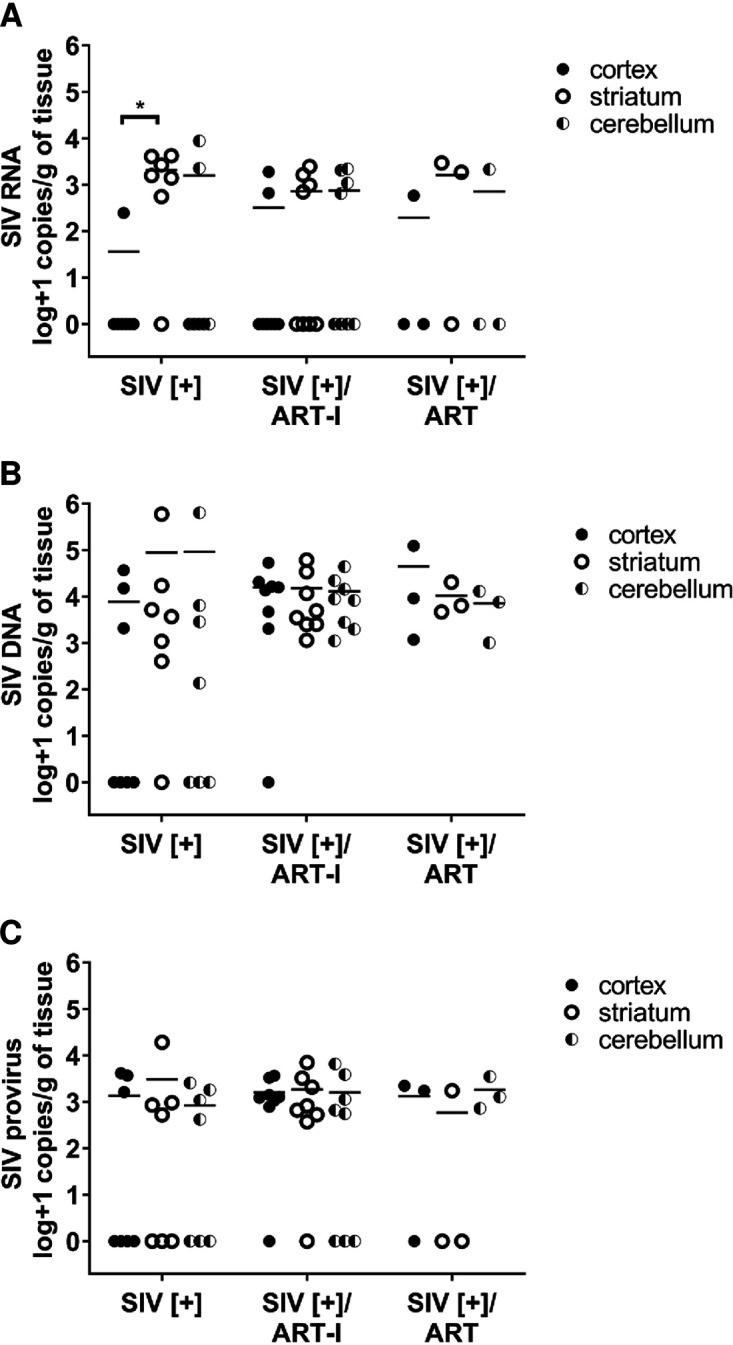
HIV infection persists in different tissue reservoirs among people with HIV (PWH) despite effective antiretroviral therapy (ART). In the brain, lentiviruses replicate principally in microglia and trafficking macrophages. The impact of ART on this viral reservoir is unknown. We investigated the activity of contemporary ART in various models of lentivirus brain infection. HIV-1 RNA and total and integrated DNA were detected in cerebral cortex from all PWH (n = 15), regardless of ART duration or concurrent plasma viral quantity and, interestingly, integrated proviral DNA levels in brain were significantly higher in the aviremic ART-treated group (P < 0.005). Most ART drugs tested (dolutegravir, ritonavir, raltegravir, and emtricitabine) displayed significantly lower 50% effective concentration (EC50) values in lymphocytes than in microglia, except tenofovir, which showed 1.5-fold greater activity in microglia (P < 0.05). In SIV-infected Chinese rhesus macaques, despite receiving suppressive (n = 7) or interrupted (n = 8) ART, brain tissues had similar SIV-encoded RNA and total and integrated DNA levels compared to brains from infected animals without ART (n = 3). SIV and HIV-1 capsid antigens were immunodetected in brain, principally in microglia/macrophages, regardless of ART duration and outcome. Antiviral immune responses were comparable in the brains of ART-treated and untreated HIV- and SIV-infected hosts. Both HIV-1 and SIV persist in brain tissues despite contemporary ART, with undetectable virus in blood. ART interruption exerted minimal effect on the SIV brain reservoir and did not alter the neuroimmune response profile. These studies underscore the importance of augmenting ART potency in different tissue compartments. IMPORTANCE Antiretroviral therapy (ART) suppresses HIV-1 in plasma and CSF to undetectable levels. However, the impact of contemporary ART on HIV-1 brain reservoirs remains uncertain. An active viral reservoir in the brain during ART could lead to rebound systemic infection after cessation of therapy, development of drug resistance mutations, and neurological disease. ART's impact, including its interruption, on brain proviral DNA remains unclear. The present studies show that in different experimental platforms, contemporary ART did not suppress viral burden in the brain, regardless of ART component regimen, the duration of therapy, and its interruption. Thus, new strategies for effective HIV-1 suppression in the brain are imperative to achieve sustained HIV suppression.

Keywords: ART; central nervous system infections; human immunodeficiency virus; simian immunodeficiency virus; viral reservoirs.


Conflict of interest statement

The authors declare no conflict of interest.

Figures

FIG 1
FIG 1
HIV-1 load and host neuroimmune quantitation in human brain tissues. Three experimental groups were examined to determine HIV quantities in brain from 15 persons—uninfected persons (HIV [−], n = 3) who died of other causes, HIV-infected persons without plasma viral suppression (HIV[+], n = 8), and HIV-infected persons with plasma viral suppression HIV [+]/ART, n = 4). (A to C) Based on ddPCR, measurements of (A) HIV-1 RNA, (B) HIV-1 DNA, and (C) HIV-1 provirus (integrated DNA) were assessed. While viral RNA and total DNA levels did not differ between the HIV[+] groups, integrated provirus levels were significantly increased in the HIV[+]/ART group. (D) Host neuroimmune transcript levels in brain were measured by RT-qPCR, including CD68, CD3E, and interferon-stimulated genes (ISG15, MX1, MX2, and OAS1) showing transcript induction in both HIV-infected groups relative to the HIV[–] control group. Only MX2 showed a significant difference in transcript levels between the HIV[–] and the HIV[+] groups. The horizontal bars in panels A, B, C, and D represent mean values. (E) Immunofluorescence labeling of brain sections from each group showed detection of HIV-1 p24 capsid (cyan) protein in microglia (Iba-1, green) and T-cells (CD3ε, yellow; see the inset) in all HIV[+] groups. Nuclei were labeled with DAPI (4′,6-diamidino-2-phenylindole; blue). (*, P < 0.05; **, P < 0.01; ***, P < 0.001).
FIG 2
FIG 2
Effect of ART drugs on infected human fetal microglia (HFM) and peripheral blood lymphocytes (PBLs). (A) HFM and PBLs were infected with VSV-G/HIV-1NL4-3-ADA-Env+ (MOI, 0.02 and 0.01, respectively) and exposed to different concentrations (–3, −2, −1, 0, 1, 2, and 3 log nM) of individual ART drugs—emtricitabine (FTC), ritonavir (RTV), dolutegravir (DTG), raltegravir (RAL), and tenofovir (TDF). (B to F) EC50 values for (B) FTC, (C) DTG, (D) RTV, (E) RAL, and (F) TDF were quantified in each infected cell type 6 days postinfection. (Unpaired t test; *, P < 0.05; **, P < 0.01; ***, P < 0.001).
FIG 3
FIG 3
Comparison of SIV quantities in plasma, CSF, and brain tissues from nonhuman primates. (A) Three experimental groups of Chinese rhesus macaques were investigated to determine SIV load in different compartments (plasma, CSF, and brain) after infection. All animals were infected with SIVmac251 (10 50% animal infectious dose [AID50]). SIV-infected animals (SIV[+], n = 7) did not receive ART after infection, and animals were euthanized 38 to 104 days postinfection. The SIV[+] group in which ART was interrupted (SIV[+]/ART-I, n = 8) received a combined regimen of RAL/DTG, FTC, RTV, and TFV, beginning 4 days after primary infection, for 56 days to ensure undetectable plasma viral load. After SIV suppression, therapy was stopped, and animals were euthanized when viral RNA was detectable in plasma; ART interruption duration varied from 10 to 28 days, with two animals requiring 159 and 161 days to rebound. The SIV-treated group without interruption (SIV[+]/ART, n = 3) had suppressed plasma viral load after receiving a combined regimen of RAL/DTG, FTC, RTV, and TFV, also beginning 4 days postinfection, for the duration of 27 to 55 days until they had undetectable plasma viral load and were euthanized at that time. (B) Plasma and CSF viral RNA levels from the three experimental groups were measured at the time of death. (C to E) Total RNA and DNA were prepared from postmortem brain tissues from all animals and subjected to ddPCR for the measurement of SIV (C) RNA, (D) total DNA, and (E) provirus (integrated DNA). The horizontal bars in panels B, C, D, and E represent mean values. (F) Immunofluorescence microscopy of brain sections from each experimental group displayed SIV p27 (capsid, green) immunoreactivity in microglia (Iba-1, yellow) and T cells (CD3ε, yellow; see the inset) in all three groups with DAPI nuclear staining (blue).
FIG 4
FIG 4
SIV burden in three different brain regions of Chinese rhesus macaques. (A) SIV RNA, (B) SIV DNA, and (C) SIV provirus (integrated DNA) in cortex, striatum, and cerebellum.
FIG 5
FIG 5
Host neuroimmune responses and correlation analyses in SIV-infected nonhuman primates. (A) Analyses of CD68, CD3E, and interferon-stimulated genes (ISG15, MX-1, MX-2, and OAS1) transcript levels showed mean expression for each gene in cortex, striatum, and cerebellum relative to the SIV[+] ART group without significant differences in individual transcript levels between groups. The horizontal bars represent mean values. (B) A correlation matrix of host neuroimmune response and brain viral load in three different regions (cortex, striatum, and cerebellum), as well as ART and plasma/CSF viral load variables. Correlation coefficients (r) appear in the left lower matrix, and a graphic display of these values appears on the top upper matrix. Blue-tinted ellipses represent positive correlations, while red-tinted ellipses represent negative correlations. The boldness of the color and shape of the ellipse represent the strength of the relationship between variables, with stronger correlations having bolder colors and narrower ellipses. All denoted correlations represent a statistical significance of P < 0.05.

References

    1. Cheevers WP, McGuire TC. 1988. The lentiviruses: maedi/visna, caprine arthritis-encephalitis, and equine infectious anemia. Adv Virus Res 34:189–215. doi:10.1016/s0065-3527(08)60518-7. - DOI - PubMed
    1. Dow SW, Poss ML, Hoover EA. 1990. Feline immunodeficiency virus: a neurotropic lentivirus. J Acquir Immune Defic Syndr (1988) 3:658–668. - PubMed
    1. McClure JJ, Lindsay WA, Taylor W, Ochoa R, Issel CJ, Coulter SJ. 1982. Ataxia in four horses with equine infectious anemia. J Am Vet Med Assoc 180:279–283. - PubMed
    1. Murray EA, Rausch DM, Lendvay J, Sharer LR, Eiden LE. 1992. Cognitive and motor impairments associated with SIV infection in rhesus monkeys. Science 255:1246–1249. doi:10.1126/science.1546323. - DOI - PubMed
    1. Power C. 2001. Retroviral diseases of the nervous system: pathogenic host response or viral gene-mediated neurovirulence? Trends Neurosci 24:162–169. doi:10.1016/s0166-2236(00)01737-9. - DOI - PubMed

Publication types

MeSH terms

Substances