. 2021 Dec;9(12):e003414.
doi: 10.1136/jitc-2021-003414.

Genomic and transcriptomic characterization of heterogeneous immune subgroups of microsatellite instability-high colorectal cancers

Affiliations

Genomic and transcriptomic characterization of heterogeneous immune subgroups of microsatellite instability-high colorectal cancers

Jung Ho Kim et al. J Immunother Cancer. 2021 Dec.

Abstract

Background: Colorectal cancers (CRCs) with microsatellite instability-high (MSI-H) are hypermutated tumors and are generally regarded as immunogenic. However, their heterogeneous immune responses and underlying molecular characteristics remain largely unexplained.

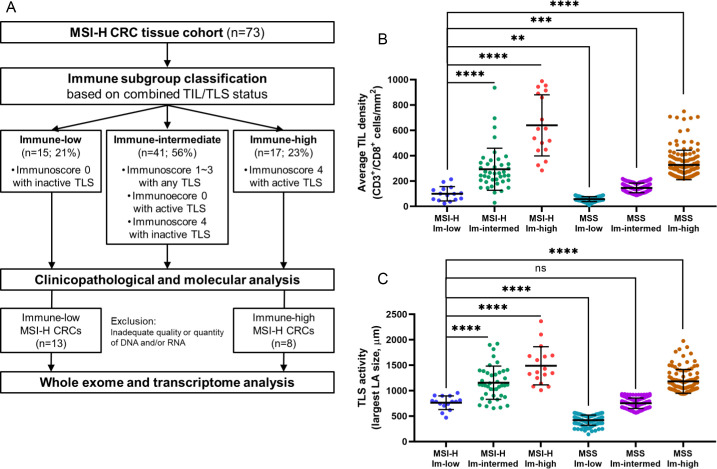
Methods: We conducted a retrospective analysis of 73 primary MSI-H CRC tissues to characterize heterogeneous immune subgroups. Based on combined tumor-infiltrating lymphocyte (TIL) immunoscore and tertiary lymphoid structure (TLS) activity, MSI-H CRCs were classified into immune-high, immune-intermediate, and immune-low subgroups. Of these, the immune-high and immune-low subgroups were further analyzed using whole-exome and transcriptome sequencing.

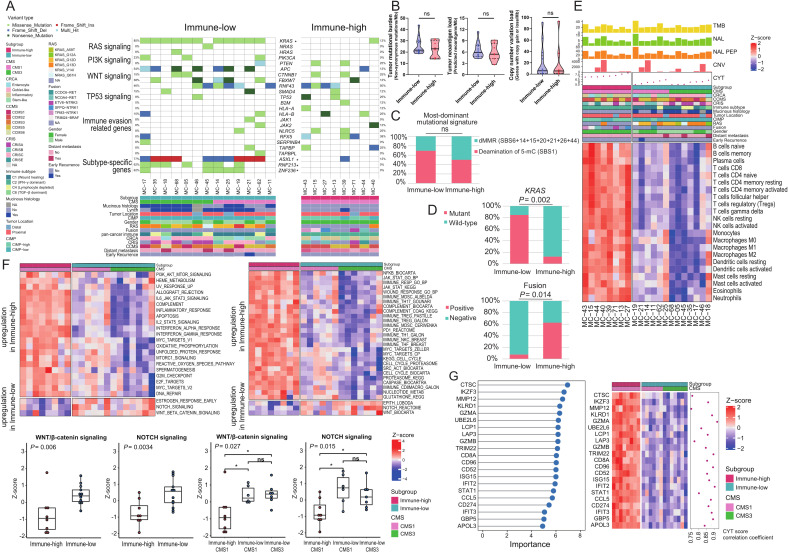
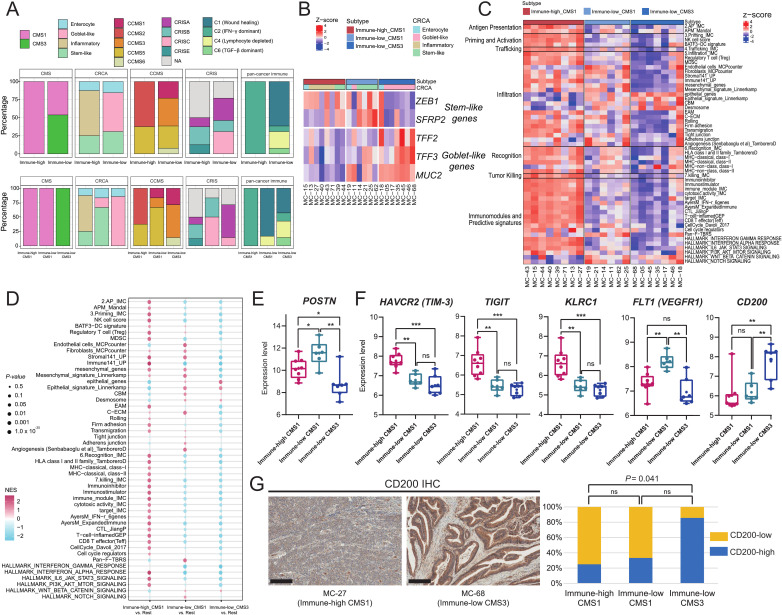
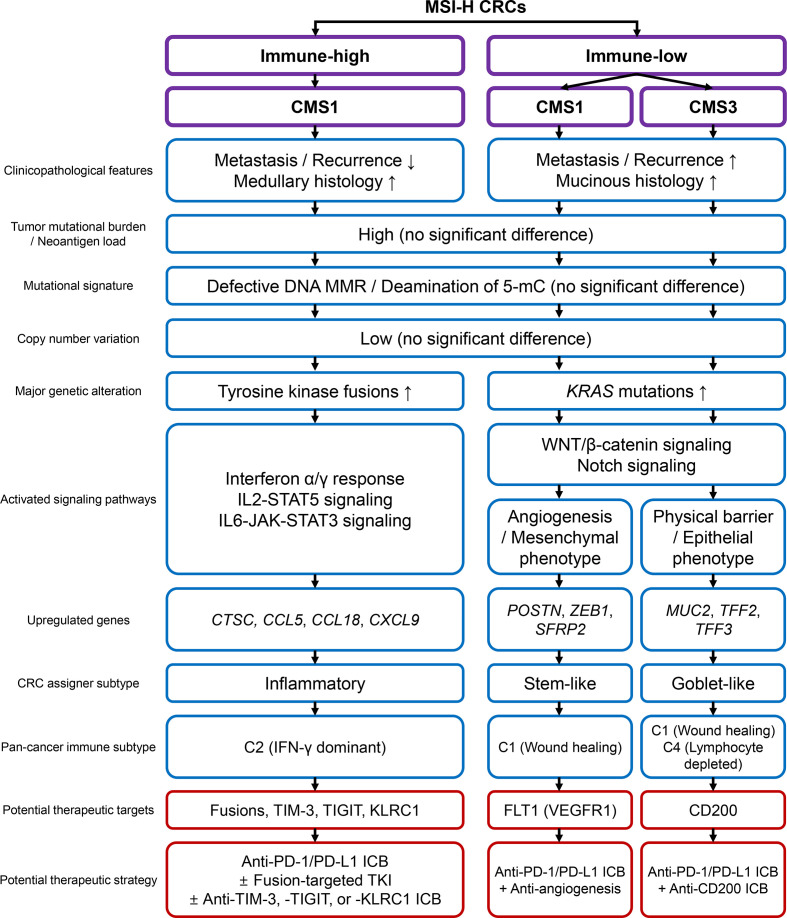
Results: We found considerable variations in immune parameters between MSI-H CRCs, and immune subgrouping of MSI-H CRCs was performed accordingly. The TIL densities and TLS activities of immune-low MSI-H CRCs were comparable to those of an immune-low or immune-intermediate subgroup of microsatellite-stable CRCs. There were remarkable differences between immune-high and immune-low MSI-H CRCs, including their pathological features (medullary vs mucinous), genomic alterations (tyrosine kinase fusions vs KRAS mutations), and activated signaling pathways (immune-related vs Wnt and Notch signaling), whereas no significant differences were found in tumor mutational burden (TMB) and neoantigen load. The immune-low MSI-H CRCs were subdivided by the consensus molecular subtype (CMS1 vs CMS3) with different gene expression signatures (mesenchymal/stem-like vs epithelial/goblet-like), suggesting distinct immune evasion mechanisms. Angiogenesis and CD200 were identified as potential therapeutic targets in immune-low CMS1 and CMS3 MSI-H CRCs, respectively.

Conclusions: MSI-H CRCs are immunologically heterogeneous, regardless of TMB. The unusual immune-low MSI-H CRCs are characterized by mucinous histology, KRAS mutations, and Wnt/Notch activation, and can be further divided into distinct gene expression subtypes, including CMS4-like CMS1 and CMS3. Our data provide novel insights into precise immunotherapeutic strategies for subtypes of MSI-H tumors.

Keywords: gastrointestinal neoplasms; gene expression profiling; immunohistochemistry; lymphocytes; tumor microenvironment; tumor-infiltrating.


Conflict of interest statement

Competing interests: None declared.

Figures

Figure 1
Figure 1
Heterogeneity and correlations of immune microenvironmental parameters in MSI-H CRCs. (A) First scheme of this study: from sample selection to quantitative tumor immune microenvironment analysis. (B) Wide ranges of quantified immune parameters in the 73 MSI-H CRCs. The density of CD3+, CD8+, FoxP3+, CD68+, or CD163+ cells is an average value throughout the invasive margin and center of tumor areas in an MSI-H CRC. PD-L1 expression score is the sum of two PD-L1 H-scores from immune cells and tumor cells in an MSI-H CRC. Bilateral whiskers, a central box, a cross line within the box, and a small dot within the box indicate a minimum to maximum range, an IQR, a median value, and a mean value, respectively. (C) Comparison of major antitumor immune parameters (CD3+ TIL, CD8+ TIL, and TLS) between MSI-H (n=73) and MSS (n=535 for TIL and n=411 for TLS) CRCs. Note the wider ranges of immune parameters in MSI-H CRCs than in MSS CRCs and the presence of MSI-H CRCs showing a lower value (red-lined boxes) than the median value (vertical red dot lines) in MSS CRCs. (D) Correlation heatmap between various immune parameters of the 73 MSI-H CRCs. (****, p<0.0001). CRCs, colorectal cancers; IHC, immunohistochemistry; MSI-H, microsatellite instability-high; MSS, microsatellite-stable; PD-L1, programmed death-ligand 1; TAM, tumor-associated macrophages; TIL, tumor-infiltrating lymphocyte; TLS, tertiary lymphoid structure; TMA, tissue microarray.
Figure 2
Figure 2
Immune subgroup classification of MSI-H CRCs. (A) Second scheme of this study: from the immune subgroup classification to next-generation sequencing analysis. (B) Comparison of the average TIL densities (average densities of CD3+ TILs and CD8+ TILs at the invasive margin and center of tumor areas) between the three immune subgroups of the 73 MSI-H CRCs and those of the 535 MSS CRCs. (C) Comparison of TLS activities (maximum diameters of peritumoral TLS) between the three immune subgroups of the 73 MSI-H CRCs and those of the 411 MSS CRCs. (****, p<0.0001; ***, p<0.001; **, 0.001≤p < 0.01; *, 0.01≤p < 0.05; ns, not significant). Immune-low, immune-low; immune-intermed, immune-intermediate; Im-high, immune-high. CRCs, colorectal cancers; MSI-H, microsatellite instability-high; MSS, microsatellite-stable; TIL, tumor-infiltrating lymphocyte; TLS, tertiary lymphoid structure.
Figure 3
Figure 3
Differential genomic and transcriptomic profiles between immune subgroups of MSI-H CRCs. (A) An oncoplot presenting genetic alterations in major driver genes and immune evasion-related genes (top) and clinical parameters (bottom). Each row in the oncoplot represents different genes, which are clustered into six categories. Each column represents an individual case. Genes with * represent significant differences in mutation enrichment between the immune subgroups (*, p<0.005; Fisher’s exact test). (B) Comparison of TMB, neoantigen load, and CNV load between the immune-low and immune-high subgroups of MSI-H CRCs. P values were calculated using the Mann-Whitney U test (ns, not significant). (C) Comparison of the most dominant mutational signatures between the immune-low and immune-high subgroups of MSI-H CRCs. P value was calculated using the Fisher’s exact test (ns, not significant). (D) Comparison of proportions of KRAS mutations and oncogenic gene fusions between the immune-low and immune-high subgroups of MSI-H CRCs. P values were calculated using the Fisher’s exact test. (E) A heatmap showing RNA expression-based tumor immune microenvironmental profiles of the immune subgroups of MSI-H CRCs. Immune infiltration was inferred using ssGSEA z-score with the LM22 gene set of CIBERSORT. Difference of composition of cell types between immune-high and immune-low tumors was identified using false discovery rate correction of Mann-Whitney U test P values. (F) Heatmaps showing differently activated signaling pathways between the immune-high and immune-low subgroups of MSI-H CRCs. Gene sets were adopted from ssGSEA gene sets cancer Hallmark (upper left) and CRC subtyping consortium (upper right). The two lower-left boxplots represent expression differences in the Wnt/β-catenin and Notch signaling pathways between the immune-high and immune-low subgroups. The two lower-right boxplots represent expression differences in the Wnt/β-catenin and Notch signaling pathways between the immune-high CMS1, immune-low CMS1, and immune-low CMS3 subgroups. P values were calculated using the Mann-Whitney U test (for two groups) or Kruskal-Wallis test (for three groups). (G) Top DEGs identified by using the RF-RFE model are used to classify the two immune subgroups of MSI-H CRCs. Left: top DEGs by the degree of importance. Right: heatmap and correlation coefficient of CYT score and DEGs. Correlation coefficient was calculated using the Spearman correlation analysis. CCMS, colon cancer molecular subtype; CMS, consensus molecular subtype; CNV, copy number variation; CRC, colorectal cancers; CRCA, colorectal cancer assigner; CRIS, colorectal cancer intrinsic subtype; CYT, cytolytic activity; DEG, differentially expressed genes; dMMR, mismatch repair deficiency; MSI-H, microsatellite instability-high; ssGSEA, single-sample gene-set enrichment analysis; TMB, tumor mutational burden.
Figure 4
Figure 4
Combined immune CMS subtyping of MSI-H CRCs and its immuno-oncological implications. (A) Molecular subclassification of the immune subgroups of MSI-H CRCs using various molecular subtyping systems. Each column cluster is the representative CRC molecular classification, including the CMS, CRCA, CCMS, CRIS, or pan-cancer immune subtype classification. The upper row represents the distribution pattern of each classification in the immune-high and immune-low subgroups. The lower row represents distribution pattern of each classification in the immune-high CMS1, immune-low CMS1, and immune-low CMS3 subtypes. (B) An expression heatmap of stem-like and goblet-like genes according to the immune CMS subtypes. Each column cluster represents the immune-high CMS1, immune-low CMS1, and immune-low CMS3 subtypes. Each row represents the gene expression pattern of stem-like and goblet-like genes. (C) A heatmap of immune cycle and immune response predictive signature scores using single-sample gene-set enrichment analysis, according to the immune CMS subtypes. Each column cluster represents the immune-high CMS1, immune-low CMS1, and immune-low CMS3 subtypes. Each row represents the expression pattern of a curated gene-set, clustered into six immune cycles and one predictive signature. (D) GSEA results of immune cycle and immune response predictive signatures according to the immune CMS subtypes. Each column cluster represents the immune-high CMS1, immune-low CMS1, and immune-low CMS3 subtypes. Each row represents the expression pattern of the curated gene-set. Each GSEA was performed between one subtype vs two other subtypes. (E) Comparison of POSTN expression between the three immune CMS subtypes. (**, 0.001≤p < 0.01; *, 0.01≤p < 0.05; Mann-Whitney U test) (F) Comparison of DEG expression between the three immune CMS subtypes. DEGs were selected from the immuno-oncological target list. (***, p<0.001; **, 0.001≤p < 0.01; *, 0.01≤p < 0.05; ns, not significant; Mann-Whitney U test). (G) Representative photomicrographs of CD200 IHC of immune-high CMS1 and immune-low CMS3 tumors (left; scale bar, 200 µm). Comparison of proportions of the CD200-high subgroup between the three immune subtypes (right). CD200-high or CD200-low subgroups were classified using a cut-off value of an average of CD200 IHC H-scores. CCMS, colon cancer molecular subtype; CMS, consensus molecular subtype; CRC, colorectal cancers; CRCA, colorectal cancer assigner; CRIS, colorectal cancer intrinsic subtype; DEG, differentially expressed genes; IFN, interferon; IHC, immunohistochemistry; MSI-H, microsatellite instability-high; GSEA, gene-set enrichment analysis; TGF, transforming growth factor.
Figure 5
Figure 5
Schematic summary of this study. CMS, consensus molecular subtype; CRC, colorectal cancers; ICB, immune checkpoint blockade; IFN, interferon; IL, interleukin; MMR, mismatch repair; MSI-H, microsatellite instability-high; PD-1, programmed cell death protein 1; PD-L1, programmed death-ligand 1; TKI, tyrosine kinase inhibitor; 5-mC, 5-methylcytosine.

References

    1. Ganesh K, Stadler ZK, Cercek A, et al. . Immunotherapy in colorectal cancer: rationale, challenges and potential. Nat Rev Gastroenterol Hepatol 2019;16:361–75. 10.1038/s41575-019-0126-x - DOI - PMC - PubMed
    1. Xiao Y, Freeman GJ. The microsatellite instable subset of colorectal cancer is a particularly good candidate for checkpoint blockade immunotherapy. Cancer Discov 2015;5:16–18. 10.1158/2159-8290.CD-14-1397 - DOI - PMC - PubMed
    1. Llosa NJ, Cruise M, Tam A, et al. . The vigorous immune microenvironment of microsatellite instable colon cancer is balanced by multiple counter-inhibitory checkpoints. Cancer Discov 2015;5:43–51. 10.1158/2159-8290.CD-14-0863 - DOI - PMC - PubMed
    1. Le DT, Uram JN, Wang H, et al. . PD-1 blockade in tumors with mismatch-repair deficiency. N Engl J Med 2015;372:2509–20. 10.1056/NEJMoa1500596 - DOI - PMC - PubMed
    1. Marcus L, Lemery SJ, Keegan P, et al. . FDA approval summary: pembrolizumab for the treatment of microsatellite Instability-High solid tumors. Clin Cancer Res 2019;25:3753–8. 10.1158/1078-0432.CCR-18-4070 - DOI - PubMed

Publication types

Substances