. 2022 Feb 15;82(4):615-631.
doi: 10.1158/0008-5472.CAN-21-1845.

Functional Analysis Identifies Damaging CHEK2 Missense Variants Associated with Increased Cancer Risk

Affiliations

Functional Analysis Identifies Damaging CHEK2 Missense Variants Associated with Increased Cancer Risk

Rick A C M Boonen et al. Cancer Res. .

Abstract

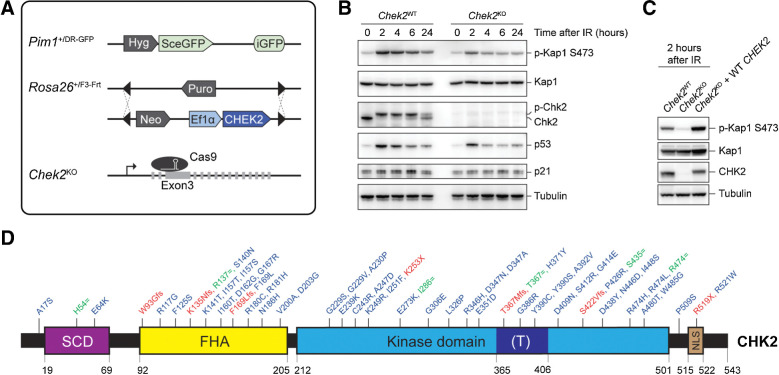
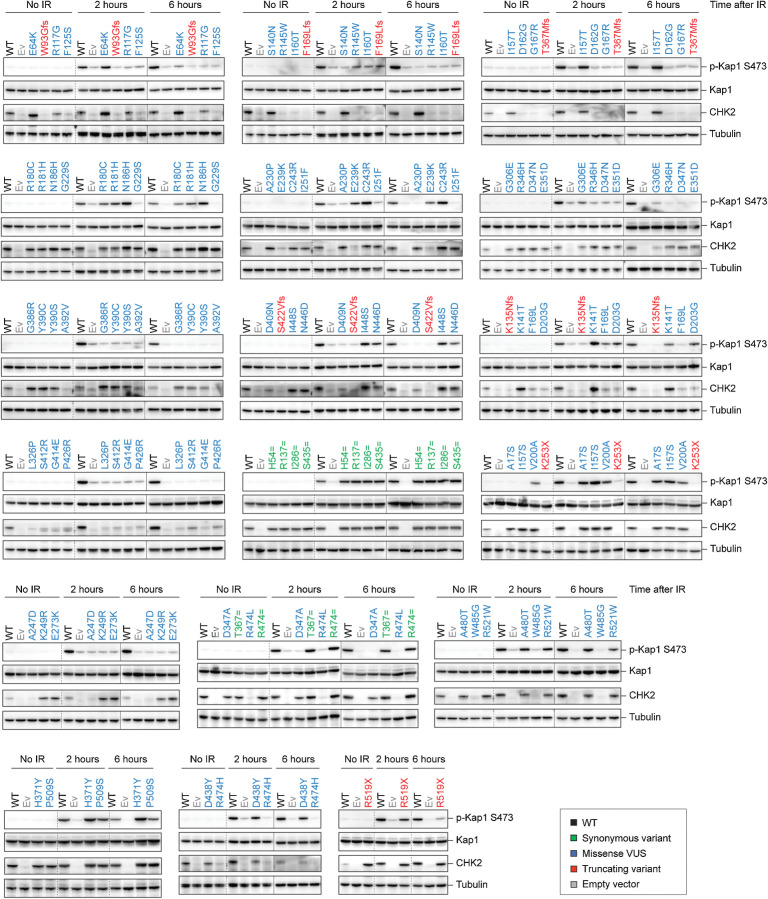
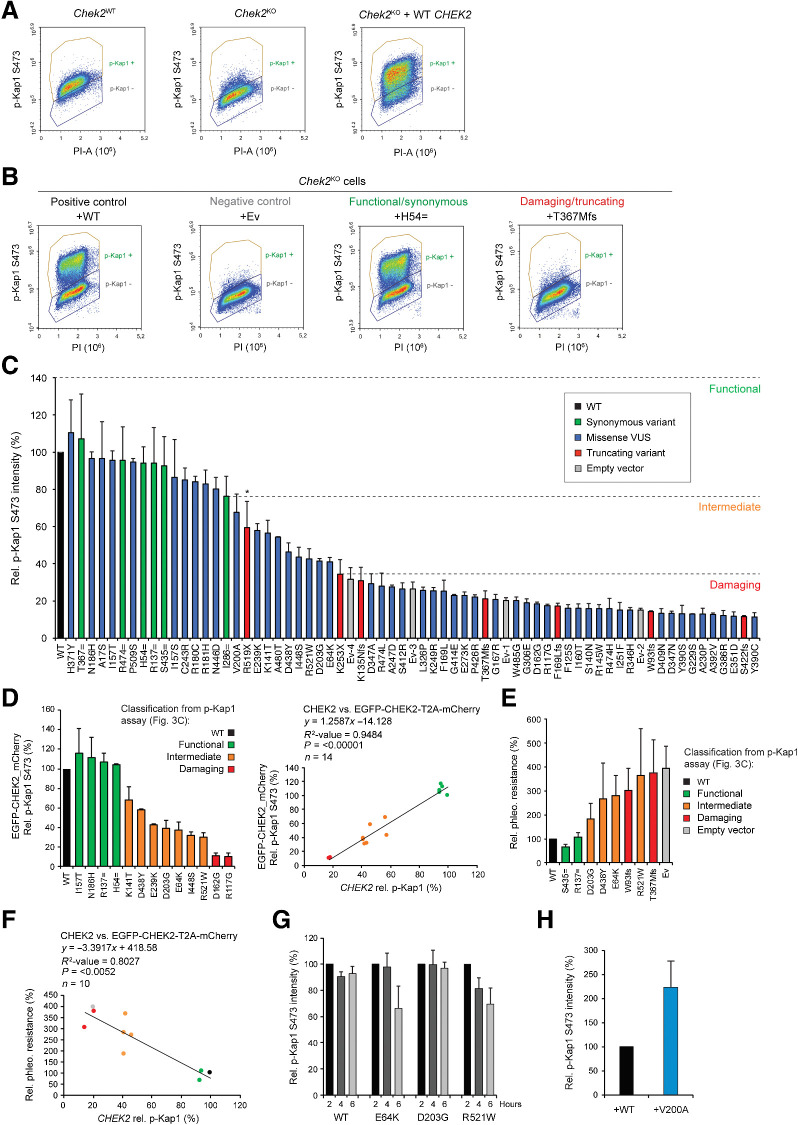
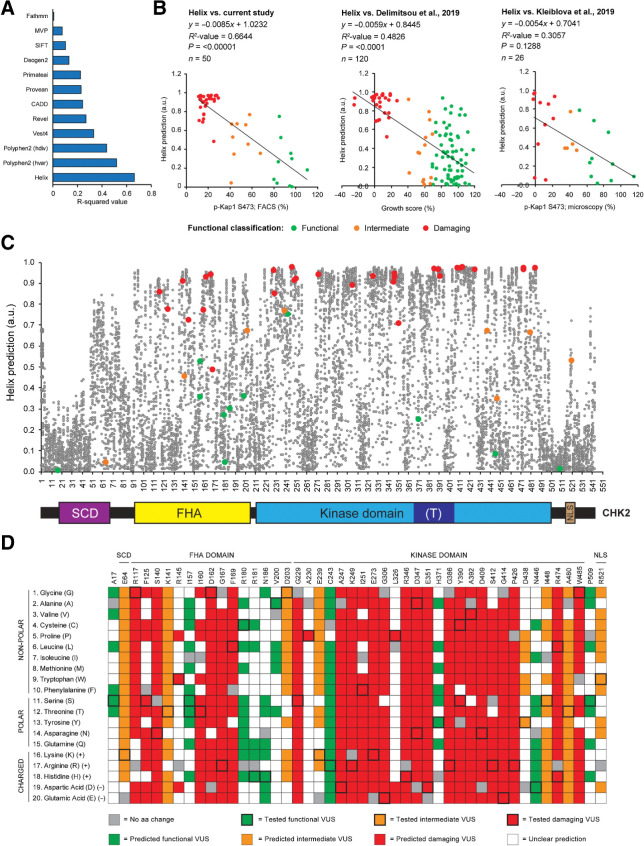
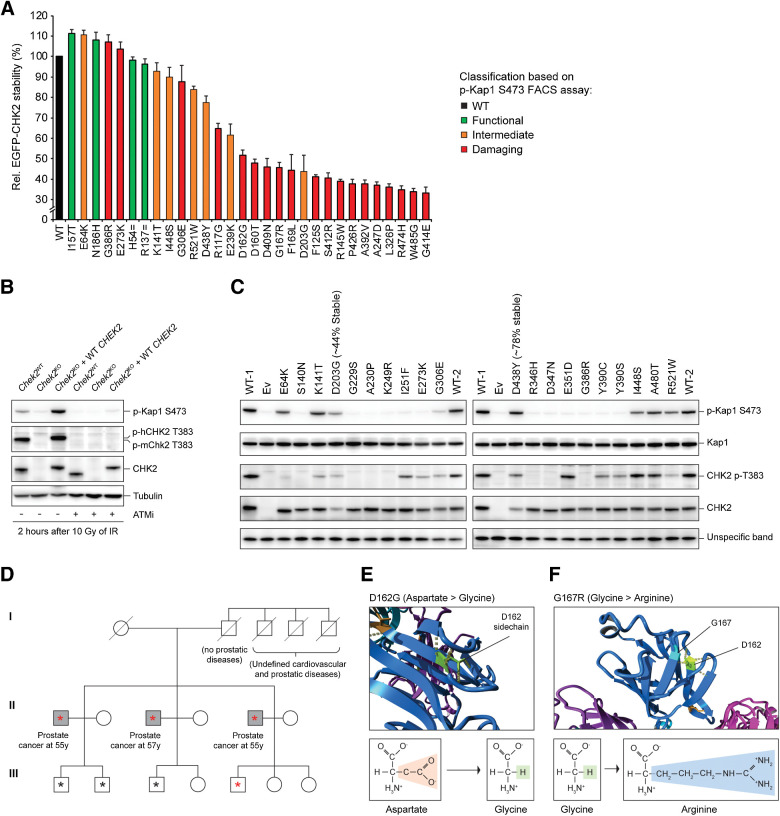
Heterozygous carriers of germline loss-of-function variants in the tumor suppressor gene checkpoint kinase 2 (CHEK2) are at an increased risk for developing breast and other cancers. While truncating variants in CHEK2 are known to be pathogenic, the interpretation of missense variants of uncertain significance (VUS) is challenging. Consequently, many VUS remain unclassified both functionally and clinically. Here we describe a mouse embryonic stem (mES) cell-based system to quantitatively determine the functional impact of 50 missense VUS in human CHEK2. By assessing the activity of human CHK2 to phosphorylate one of its main targets, Kap1, in Chek2 knockout mES cells, 31 missense VUS in CHEK2 were found to impair protein function to a similar extent as truncating variants, while 9 CHEK2 missense VUS resulted in intermediate functional defects. Mechanistically, most VUS impaired CHK2 kinase function by causing protein instability or by impairing activation through (auto)phosphorylation. Quantitative results showed that the degree of CHK2 kinase dysfunction correlates with an increased risk for breast cancer. Both damaging CHEK2 variants as a group [OR 2.23; 95% confidence interval (CI), 1.62-3.07; P < 0.0001] and intermediate variants (OR 1.63; 95% CI, 1.21-2.20; P = 0.0014) were associated with an increased breast cancer risk, while functional variants did not show this association (OR 1.13; 95% CI, 0.87-1.46; P = 0.378). Finally, a damaging VUS in CHEK2, c.486A>G/p.D162G, was also identified, which cosegregated with familial prostate cancer. Altogether, these functional assays efficiently and reliably identified VUS in CHEK2 that associate with cancer.

Significance: Quantitative assessment of the functional consequences of CHEK2 variants of uncertain significance identifies damaging variants associated with increased cancer risk, which may aid in the clinical management of patients and carriers.


Figures

Figure 1. Generation of a cDNA-based complementation system for the functional analysis of human CHEK2 variants. A, Schematic representation of the mES cell– and cDNA-based complementation system for functional analysis. The DR-GFP reporter and RMCE have been stably integrated at the Pim1 and Rosa26 loci, respectively. Endogenous mouse Chek2 was targeted with CRISPR/Cas9 using a gRNA against exon 3. B, Western blot analysis of the indicated proteins from unirradiated and IR-exposed (10 Gy) Chek2WT and Chek2KO mES cells. Tubulin was used as a loading control. C, Western blot analysis of the indicated proteins from IR-exposed (10 Gy) Chek2WT, Chek2KO, and Chek2KO mES cells complemented with human CHEK2 cDNA. Tubulin was used as a loading control. D, Schematic representation of the CHK2 protein, with variant positions indicated and categorized as either synonymous (green), truncating (red), and missense VUS (blue). The amino acid numbers are shown to demarcate CHK2's evolutionarily conserved functional domains. (T) refers to the T-loop or activation segment.
Figure 1.
Generation of a cDNA-based complementation system for the functional analysis of human CHEK2 variants. A, Schematic representation of the mES cell– and cDNA-based complementation system for functional analysis. The DR-GFP reporter and RMCE have been stably integrated at the Pim1 and Rosa26 loci, respectively. Endogenous mouse Chek2 was targeted with CRISPR/Cas9 using a gRNA against exon 3. B, Western blot analysis of the indicated proteins from unirradiated and IR-exposed (10 Gy) Chek2WT and Chek2KO mES cells. Tubulin was used as a loading control. C, Western blot analysis of the indicated proteins from IR-exposed (10 Gy) Chek2WT, Chek2KO, and Chek2KO mES cells complemented with human CHEK2 cDNA. Tubulin was used as a loading control. D, Schematic representation of the CHK2 protein, with variant positions indicated and categorized as either synonymous (green), truncating (red), and missense VUS (blue). The amino acid numbers are shown to demarcate CHK2's evolutionarily conserved functional domains. (T) refers to the T-loop or activation segment.
Figure 2. Human CHEK2 variants and their effect on CHK2 expression and kinase activity toward Kap1 p.S473. Western blot analysis of the indicated proteins from Chek2KO mES cells expressing wild-type (WT; black) human untagged CHK2, empty vector (Ev; gray), or the indicated untagged CHK2 variants in untreated conditions (no IR) or at 2 or 6 hours after IR exposure (10 Gy). WT and Ev served as controls on each blot and variants are categorized by color as either synonymous (green), truncating (red), and missense VUS (blue). Tubulin was used as a loading control. Dashed lines represent a marking of different set of samples on the same blot, whereas continuous lines are used to mark different sets of samples from distinct and separately exposed blots.
Figure 2.
Human CHEK2 variants and their effect on CHK2 expression and kinase activity toward Kap1 p.S473. Western blot analysis of the indicated proteins from Chek2KO mES cells expressing wild-type (WT; black) human untagged CHK2, empty vector (Ev; gray), or the indicated untagged CHK2 variants in untreated conditions (no IR) or at 2 or 6 hours after IR exposure (10 Gy). WT and Ev served as controls on each blot and variants are categorized by color as either synonymous (green), truncating (red), and missense VUS (blue). Tubulin was used as a loading control. Dashed lines represent a marking of different set of samples on the same blot, whereas continuous lines are used to mark different sets of samples from distinct and separately exposed blots.
Figure 3. Human CHEK2 variants and their effect on CHK2's kinase activity toward Kap1 p.S473. A, Quantitative FACS-based analysis of Kap1 p.S473 phosphorylation in Chek2WT, Chek2KO, and Chek2KO mES cells complemented with human untagged CHEK2 cDNA at 2 hours after IR exposure (10 Gy). B, Quantitative FACS-based analysis of Kap1 p.S473 phosphorylation in Chek2KO mES cells complemented with the indicated untagged constructs at 2 hours after IR exposure (10 Gy). C, Quantification of FACS measurements of Kap1 p.S473 phosphorylation in Chek2KO mES cells expressing wild-type (WT; black) human untagged CHK2, empty vector (Ev; gray), or the indicated untagged CHK2 variants (green, red, and blue) at 2 hours after IR exposure (10 Gy). Data represent mean percentages ± SEM of the average phospho-Kap1 p.S473 intensity observed in the “p-Kap1 +” gate as shown in B from two independent experiments. Data are relative to WT, which was set to 100%. Ev1–4 refer to four independent Ev controls that were included. Dashed lines indicate functional thresholds based on the synonymous or truncating variant with the lowest or highest Kap1 p.S473 phosphorylation level, respectively. The asterisk marks p.R519X, which acted as a hypomorphic variant and was therefore not used for thresholding. D, Quantification of FACS measurements (left) of Kap1 p.S473 phosphorylation in Chek2KO mES cells complemented with EGFP-CHEK2-T2A-mCherry, with or without a CHEK2 variant, at 2 hours after IR exposure (10 Gy). Data represent mean percentages ± SEM of the average phospho-Kap1 p.S473 intensity observed after gating for mCherry-positive cells from two independent experiments. Data are relative to WT, which was set to 100%. Scatter plot (right) shows the correlation between phospho-Kap1 p.S473 intensities measured in Chek2KO mES cells expressing untagged CHEK2 or EGFP-tagged CHEK2 (from stably integrated EGFP-CHEK2-T2A-mCherry). Conditions are colored as indicated on the basis of functional classification using untagged CHEK2 cDNA as shown in C. E, Phleomycin sensitivity assay using Chek2KO mES cells complemented with the indicated untagged CHK2 constructs or empty vector. Cells were exposed to 2.5 μmol/L of phleomycin for 2 days. Cell viability was measured after one additional day of incubation in drug-free medium using FACS (using only forward and sideways scatter). Data represent the mean percentage ± SEM of viability relative to untreated cells from three independent experiments. F, Scatter plot showing the correlation between phospho-Kap1 p.S473 intensities and the relative resistance to 2.5 μmol/L phleomycin as measured in E in Chek2KO mES cells expressing untagged CHK2 variants. G, Quantification of FACS measurements of Kap1 p.S473 phosphorylation in Chek2KO mES cells expressing wild-type untagged CHEK2 or three selected variants at the indicated times after 10 Gy of IR. For each condition, data are plotted relative to the 2 hours time point, which was set to 100%. H, Quantification of FACS measurements of Kap1 p.S473 phosphorylation in Chek2KO mES cells expressing WT (black) untagged CHK2, or untagged CHK2 carrying the p.V200A variant (blue) at 2 hours after IR exposure (10 Gy). Data from two independent experiments are represented as in C.
Figure 3.
Human CHEK2 variants and their effect on CHK2's kinase activity toward Kap1 p.S473. A, Quantitative FACS-based analysis of Kap1 p.S473 phosphorylation in Chek2WT, Chek2KO, and Chek2KO mES cells complemented with human untagged CHEK2 cDNA at 2 hours after IR exposure (10 Gy). B, Quantitative FACS-based analysis of Kap1 p.S473 phosphorylation in Chek2KO mES cells complemented with the indicated untagged constructs at 2 hours after IR exposure (10 Gy). C, Quantification of FACS measurements of Kap1 p.S473 phosphorylation in Chek2KO mES cells expressing wild-type (WT; black) human untagged CHK2, empty vector (Ev; gray), or the indicated untagged CHK2 variants (green, red, and blue) at 2 hours after IR exposure (10 Gy). Data represent mean percentages ± SEM of the average phospho-Kap1 p.S473 intensity observed in the “p-Kap1 +” gate as shown in B from two independent experiments. Data are relative to WT, which was set to 100%. Ev1–4 refer to four independent Ev controls that were included. Dashed lines indicate functional thresholds based on the synonymous or truncating variant with the lowest or highest Kap1 p.S473 phosphorylation level, respectively. The asterisk marks p.R519X, which acted as a hypomorphic variant and was therefore not used for thresholding. D, Quantification of FACS measurements (left) of Kap1 p.S473 phosphorylation in Chek2KO mES cells complemented with EGFP-CHEK2-T2A-mCherry, with or without a CHEK2 variant, at 2 hours after IR exposure (10 Gy). Data represent mean percentages ± SEM of the average phospho-Kap1 p.S473 intensity observed after gating for mCherry-positive cells from two independent experiments. Data are relative to WT, which was set to 100%. Scatter plot (right) shows the correlation between phospho-Kap1 p.S473 intensities measured in Chek2KO mES cells expressing untagged CHEK2 or EGFP-tagged CHEK2 (from stably integrated EGFP-CHEK2-T2A-mCherry). Conditions are colored as indicated on the basis of functional classification using untagged CHEK2 cDNA as shown in C. E, Phleomycin sensitivity assay using Chek2KO mES cells complemented with the indicated untagged CHK2 constructs or empty vector. Cells were exposed to 2.5 μmol/L of phleomycin for 2 days. Cell viability was measured after one additional day of incubation in drug-free medium using FACS (using only forward and sideways scatter). Data represent the mean percentage ± SEM of viability relative to untreated cells from three independent experiments. F, Scatter plot showing the correlation between phospho-Kap1 p.S473 intensities and the relative resistance to 2.5 μmol/L phleomycin as measured in E in Chek2KO mES cells expressing untagged CHK2 variants. G, Quantification of FACS measurements of Kap1 p.S473 phosphorylation in Chek2KO mES cells expressing wild-type untagged CHEK2 or three selected variants at the indicated times after 10 Gy of IR. For each condition, data are plotted relative to the 2 hours time point, which was set to 100%. H, Quantification of FACS measurements of Kap1 p.S473 phosphorylation in Chek2KO mES cells expressing WT (black) untagged CHK2, or untagged CHK2 carrying the p.V200A variant (blue) at 2 hours after IR exposure (10 Gy). Data from two independent experiments are represented as in C.
Figure 4. Correlation between computational predictions and functionality of CHEK2 variants. A, Bar plot showing the R2-correlation values between the FACS-based analysis of Kap1 p.S473 phosphorylation as shown in Fig. 3C and computational predictions from 12 different prediction algorithms. B, Scatter plot showing the correlation between Helix-based in silico predictions and results from functional assays presented in our study (Fig. 3C), or those from Delimitsou and colleagues 2019 (34) and Kleiblova and colleagues 2019 (35). Data points are colored on the basis of functional classification (green, functional; orange, intermediate; red, damaging). Helix provides predictions for pathogenicity ranging from 0–1, with values close to 1 representing pathogenic predictions. C, En masse prediction plot from Helix for all possible missense changes in human CHEK2. Schematic representation of the CHK2 protein and its functional domains demarcated by the amino acid numbers at the x-axis of the plot. D, Heatmap showing predictions from Helix combined with functional data for CHK2 amino acid changes that were analyzed in Fig. 3C (outlined in bold). Functional variants are indicated in green (with bold outline); amino acid changes with a similar (+0.05) or lower prediction from Helix are also indicated in green. Intermediate variants are indicated in orange (with bold outline); amino acid changes with a similar (−0.05) or higher prediction from Helix are also indicated in orange. Damaging variants are indicated in red (with bold outline); amino acid changes with a similar (−0.05) or higher prediction from Helix are also indicated in red. For each amino acid position, amino acid changes with a similar color code are expected to result in similar functional effects. Squares in gray and white represent changes into the original amino acid or variant changes for which predictions are unclear, respectively.
Figure 4.
Correlation between computational predictions and functionality of CHEK2 variants. A, Bar plot showing the R2-correlation values between the FACS-based analysis of Kap1 p.S473 phosphorylation as shown in Fig. 3C and computational predictions from 12 different prediction algorithms. B, Scatter plot showing the correlation between Helix-based in silico predictions and results from functional assays presented in our study (Fig. 3C), or those from Delimitsou and colleagues 2019 (34) and Kleiblova and colleagues 2019 (35). Data points are colored on the basis of functional classification (green, functional; orange, intermediate; red, damaging). Helix provides predictions for pathogenicity ranging from 0–1, with values close to 1 representing pathogenic predictions. C, En masse prediction plot from Helix for all possible missense changes in human CHEK2. Schematic representation of the CHK2 protein and its functional domains demarcated by the amino acid numbers at the x-axis of the plot. D, Heatmap showing predictions from Helix combined with functional data for CHK2 amino acid changes that were analyzed in Fig. 3C (outlined in bold). Functional variants are indicated in green (with bold outline); amino acid changes with a similar (+0.05) or lower prediction from Helix are also indicated in green. Intermediate variants are indicated in orange (with bold outline); amino acid changes with a similar (−0.05) or higher prediction from Helix are also indicated in orange. Damaging variants are indicated in red (with bold outline); amino acid changes with a similar (−0.05) or higher prediction from Helix are also indicated in red. For each amino acid position, amino acid changes with a similar color code are expected to result in similar functional effects. Squares in gray and white represent changes into the original amino acid or variant changes for which predictions are unclear, respectively.
Figure 5. Analysis of pathogenic mechanisms of CHEK2 VUS and the association of two VUS with prostate cancer. A, Quantification of FACS measurements of the average EGFP intensity in Chek2KO mES cells complemented with EGFP-CHEK2-T2A-mCherry, with or without the indicated CHEK2 variants. EGFP intensities were measured in mCherry-positive gated cells. Data represent mean percentages ± SEM for three independent measurements and are relative to WT that was set at 100%. B, Western blot analysis of the indicated proteins from IR-exposed (10 Gy) Chek2WT, Chek2KO, and Chek2KO mES cells complemented with human CHEK2 cDNA that were left untreated or treated with ATM inhibitor (ATMi). Tubulin was used as a loading control. C, Western blot analysis of the indicated proteins from IR-exposed (10 Gy) Chek2KO mES cells complemented with human CHEK2 cDNA without or with a CHEK2 variant that displayed intermediate or damaging effects in Fig. 3C. An unspecific band produced by the anti-CHK2 antibody was used as a loading control. D, Pedigree of the family with the CHEK2 c.485A>G/p.D162G variant. Three male siblings carrying CHEK2 c.485A>G/p.D162G developed prostate cancer in their 50s (gray squares). Circles, females; squares, males. The asterisks indicate family members whose blood cell DNA was subjected to exome sequencing. The red asterisks indicate members carrying the CHEK2 c.485A>G/p.D162G variant. E and F, Partial structures (top) of the CHK2 FHA domain showing the effect of two CHK2 variants exhibiting protein instability as shown in A. Formulas and changes for the indicated amino acids are shown (bottom).
Figure 5.
Analysis of pathogenic mechanisms of CHEK2 VUS and the association of two VUS with prostate cancer. A, Quantification of FACS measurements of the average EGFP intensity in Chek2KO mES cells complemented with EGFP-CHEK2-T2A-mCherry, with or without the indicated CHEK2 variants. EGFP intensities were measured in mCherry-positive gated cells. Data represent mean percentages ± SEM for three independent measurements and are relative to WT that was set at 100%. B, Western blot analysis of the indicated proteins from IR-exposed (10 Gy) Chek2WT, Chek2KO, and Chek2KO mES cells complemented with human CHEK2 cDNA that were left untreated or treated with ATM inhibitor (ATMi). Tubulin was used as a loading control. C, Western blot analysis of the indicated proteins from IR-exposed (10 Gy) Chek2KO mES cells complemented with human CHEK2 cDNA without or with a CHEK2 variant that displayed intermediate or damaging effects in Fig. 3C. An unspecific band produced by the anti-CHK2 antibody was used as a loading control. D, Pedigree of the family with the CHEK2 c.485A>G/p.D162G variant. Three male siblings carrying CHEK2 c.485A>G/p.D162G developed prostate cancer in their 50s (gray squares). Circles, females; squares, males. The asterisks indicate family members whose blood cell DNA was subjected to exome sequencing. The red asterisks indicate members carrying the CHEK2 c.485A>G/p.D162G variant. E and F, Partial structures (top) of the CHK2 FHA domain showing the effect of two CHK2 variants exhibiting protein instability as shown in A. Formulas and changes for the indicated amino acids are shown (bottom).

References

    1. Ahn J, Urist M, Prives C. The Chk2 protein kinase. DNA Repair 2004;3:1039–47. - PubMed
    1. Bartek J, Lukas J. Chk1 and Chk2 kinases in checkpoint control and cancer. Cancer Cell 2003;3:421–9. - PubMed
    1. Hirao A, Cheung A, Duncan G, Girard PM, Elia AJ, Wakeham A, et al. Chk2 is a tumor suppressor that regulates apoptosis in both an ataxia telangiectasia mutated (ATM)-dependent and an ATM-independent manner. Mol Cell Biol 2002;22:6521–32. - PMC - PubMed
    1. Meijers-Heijboer H, van den Ouweland A, Klijn J, Wasielewski M, de Snoo A, Oldenburg R, et al. Low-penetrance susceptibility to breast cancer due to CHEK2(*)1100delC in noncarriers of BRCA1 or BRCA2 mutations. Nat Genet 2002;31:55–9. - PubMed
    1. Vahteristo P, Bartkova J, Eerola H, Syrjakoski K, Ojala S, Kilpivaara O, et al. A CHEK2 genetic variant contributing to a substantial fraction of familial breast cancer. Am J Hum Genet 2002;71:432–8. - PMC - PubMed

Publication types

Substances

Supplementary concepts