. 2022 Feb 1;82(3):458-471.
doi: 10.1158/0008-5472.CAN-21-1297. Epub 2021 Dec 13.

Targeting Chemotherapy to Decondensed H3K27me3-Marked Chromatin of AML Cells Enhances Leukemia Suppression

Affiliations

Targeting Chemotherapy to Decondensed H3K27me3-Marked Chromatin of AML Cells Enhances Leukemia Suppression

Patrizia Porazzi et al. Cancer Res. .

Abstract

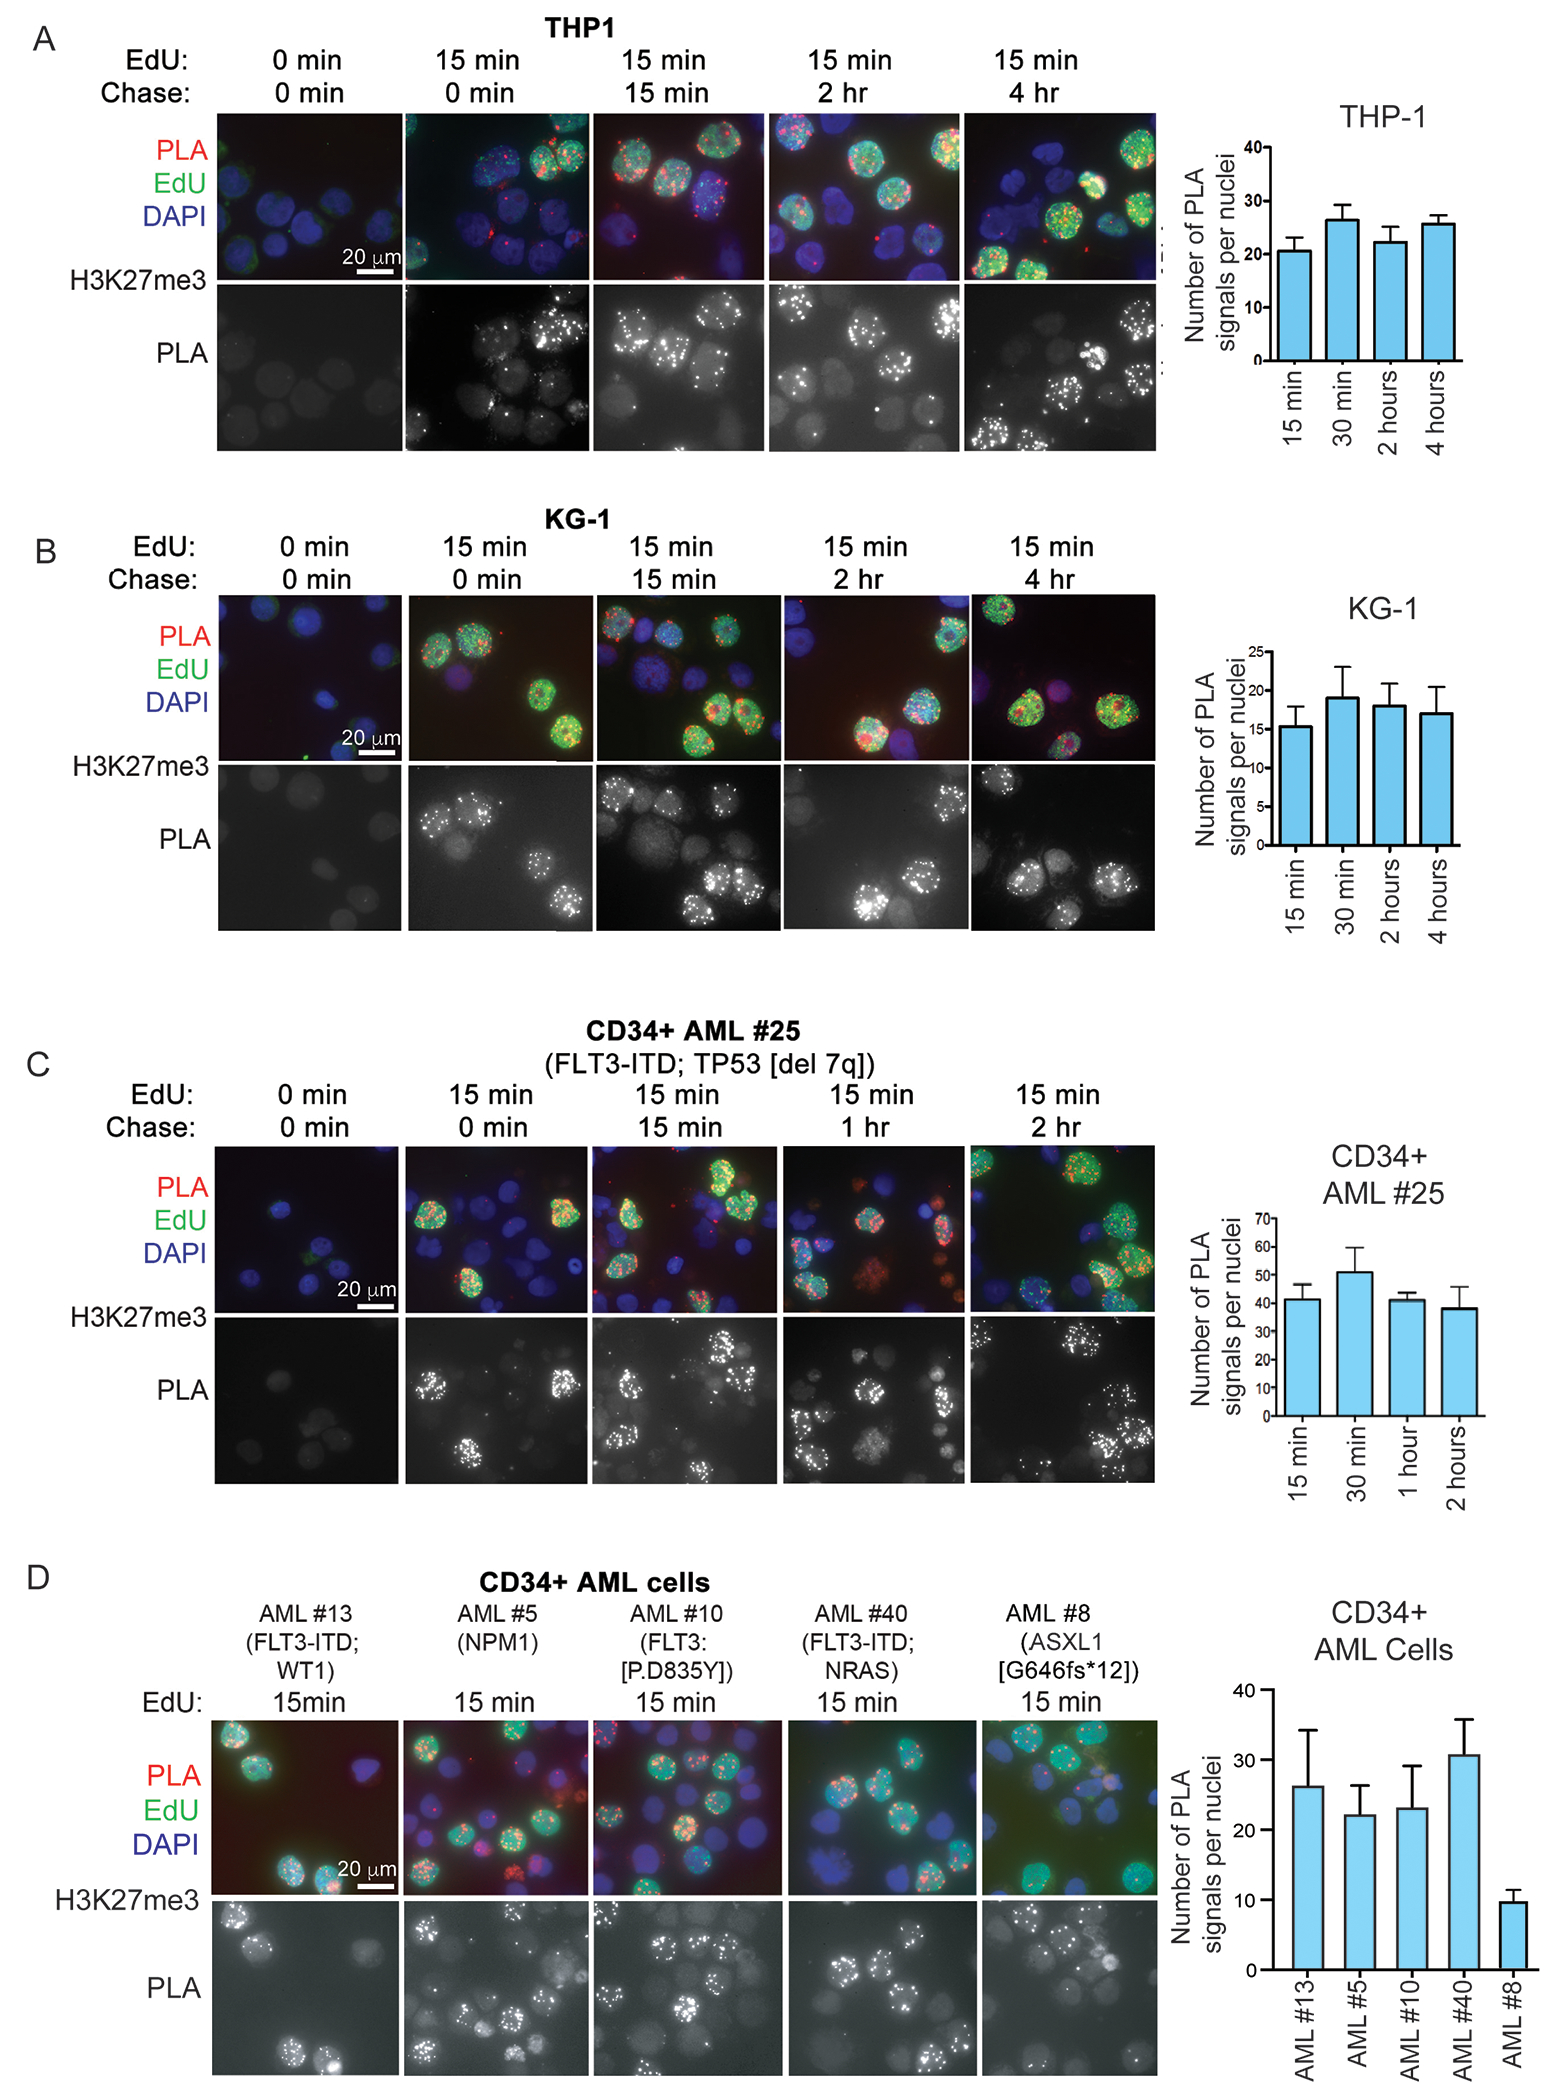
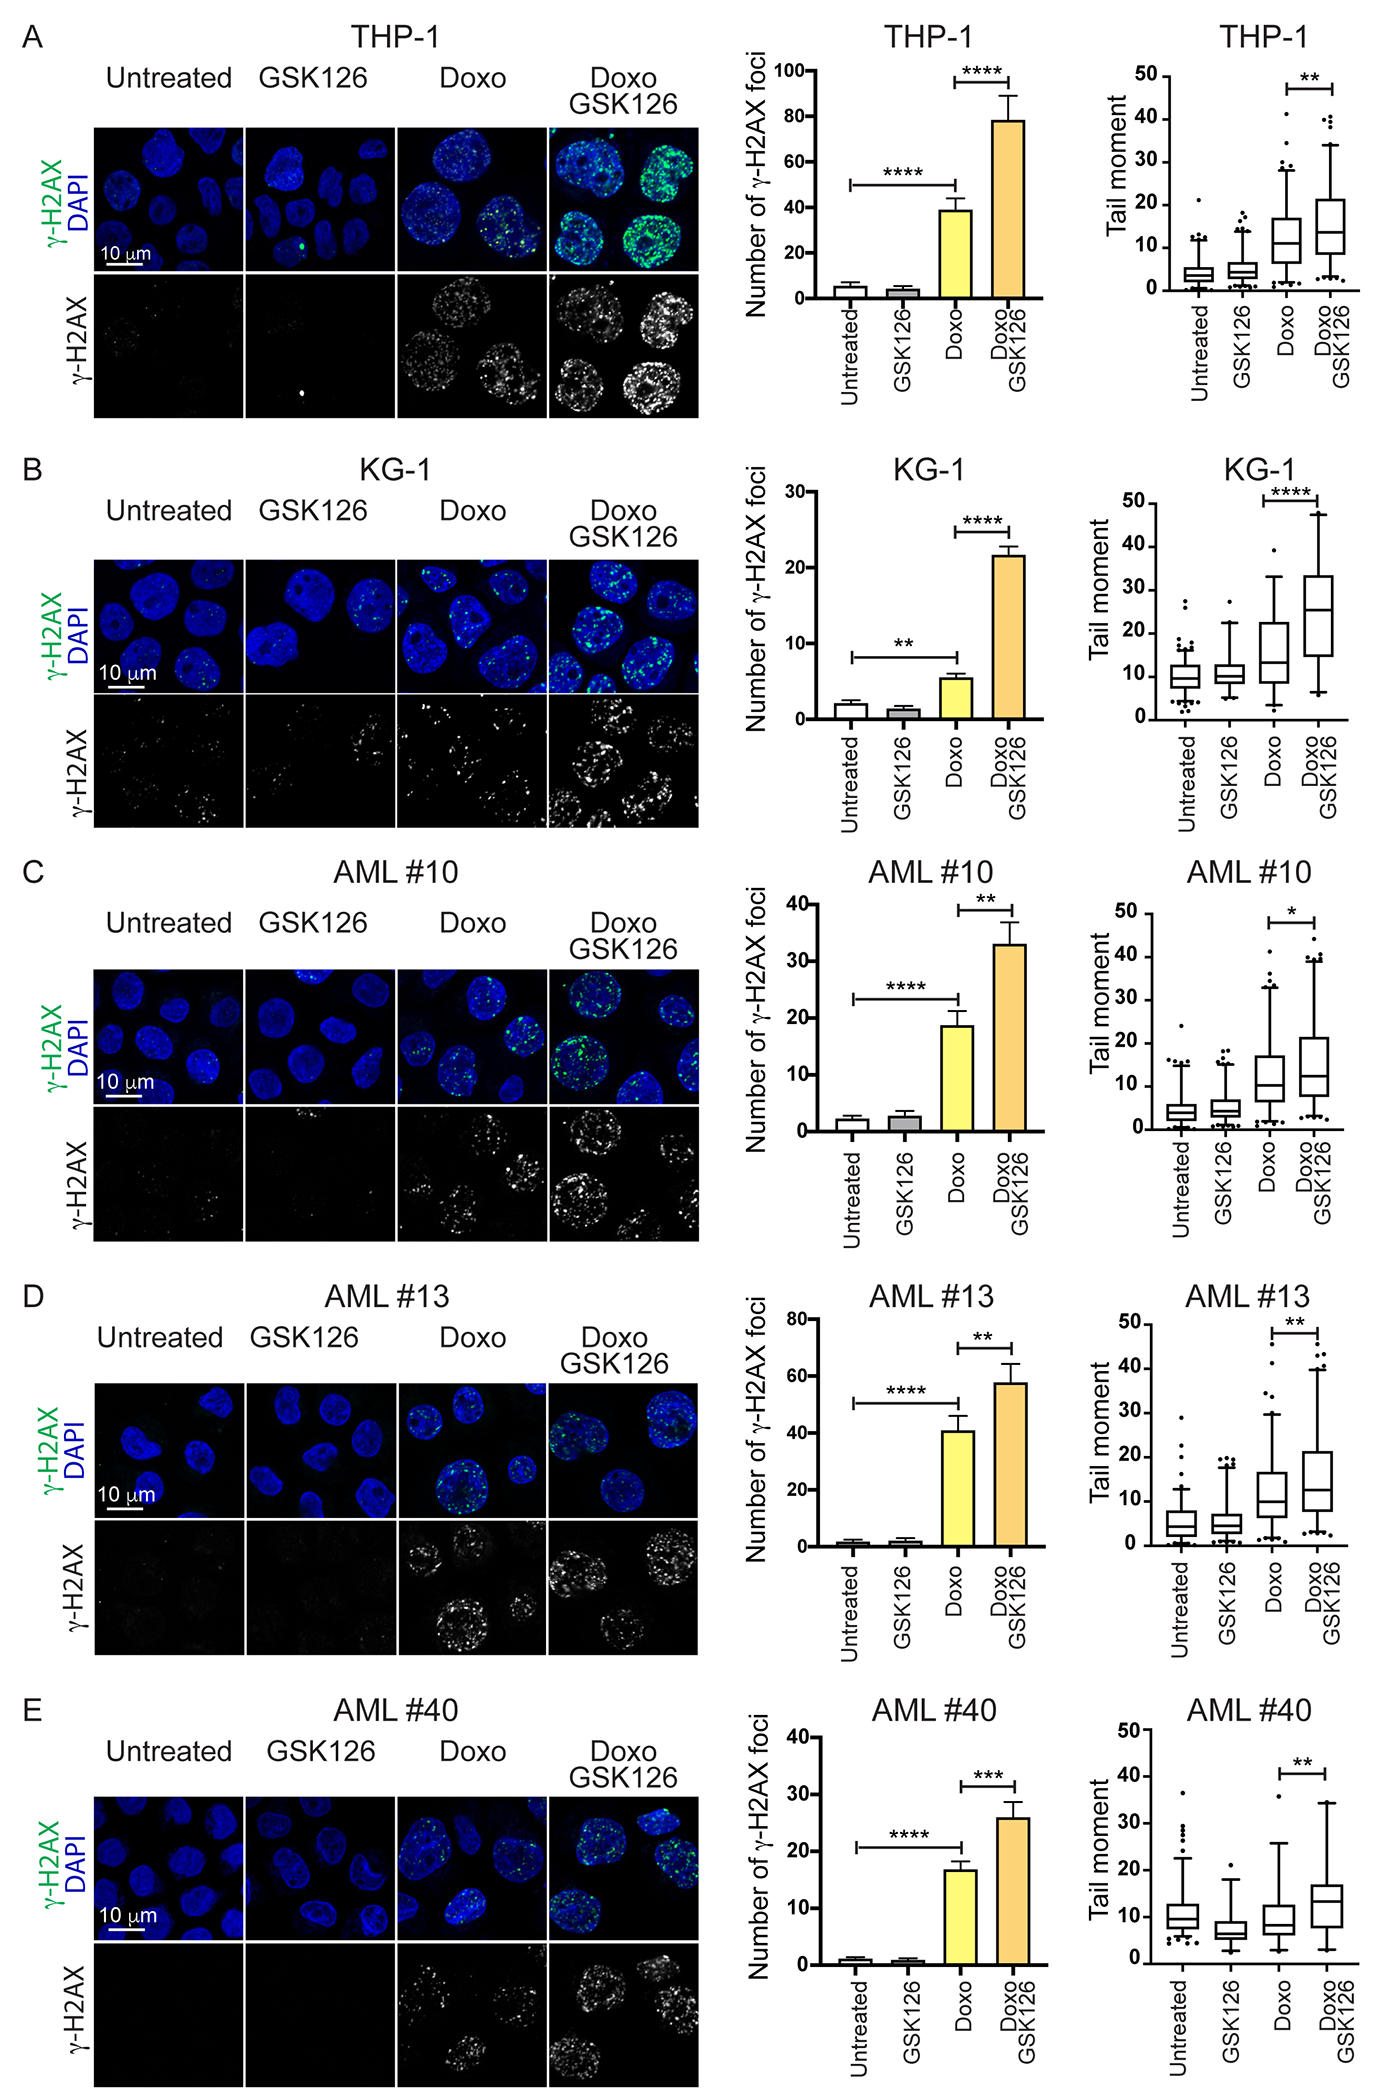
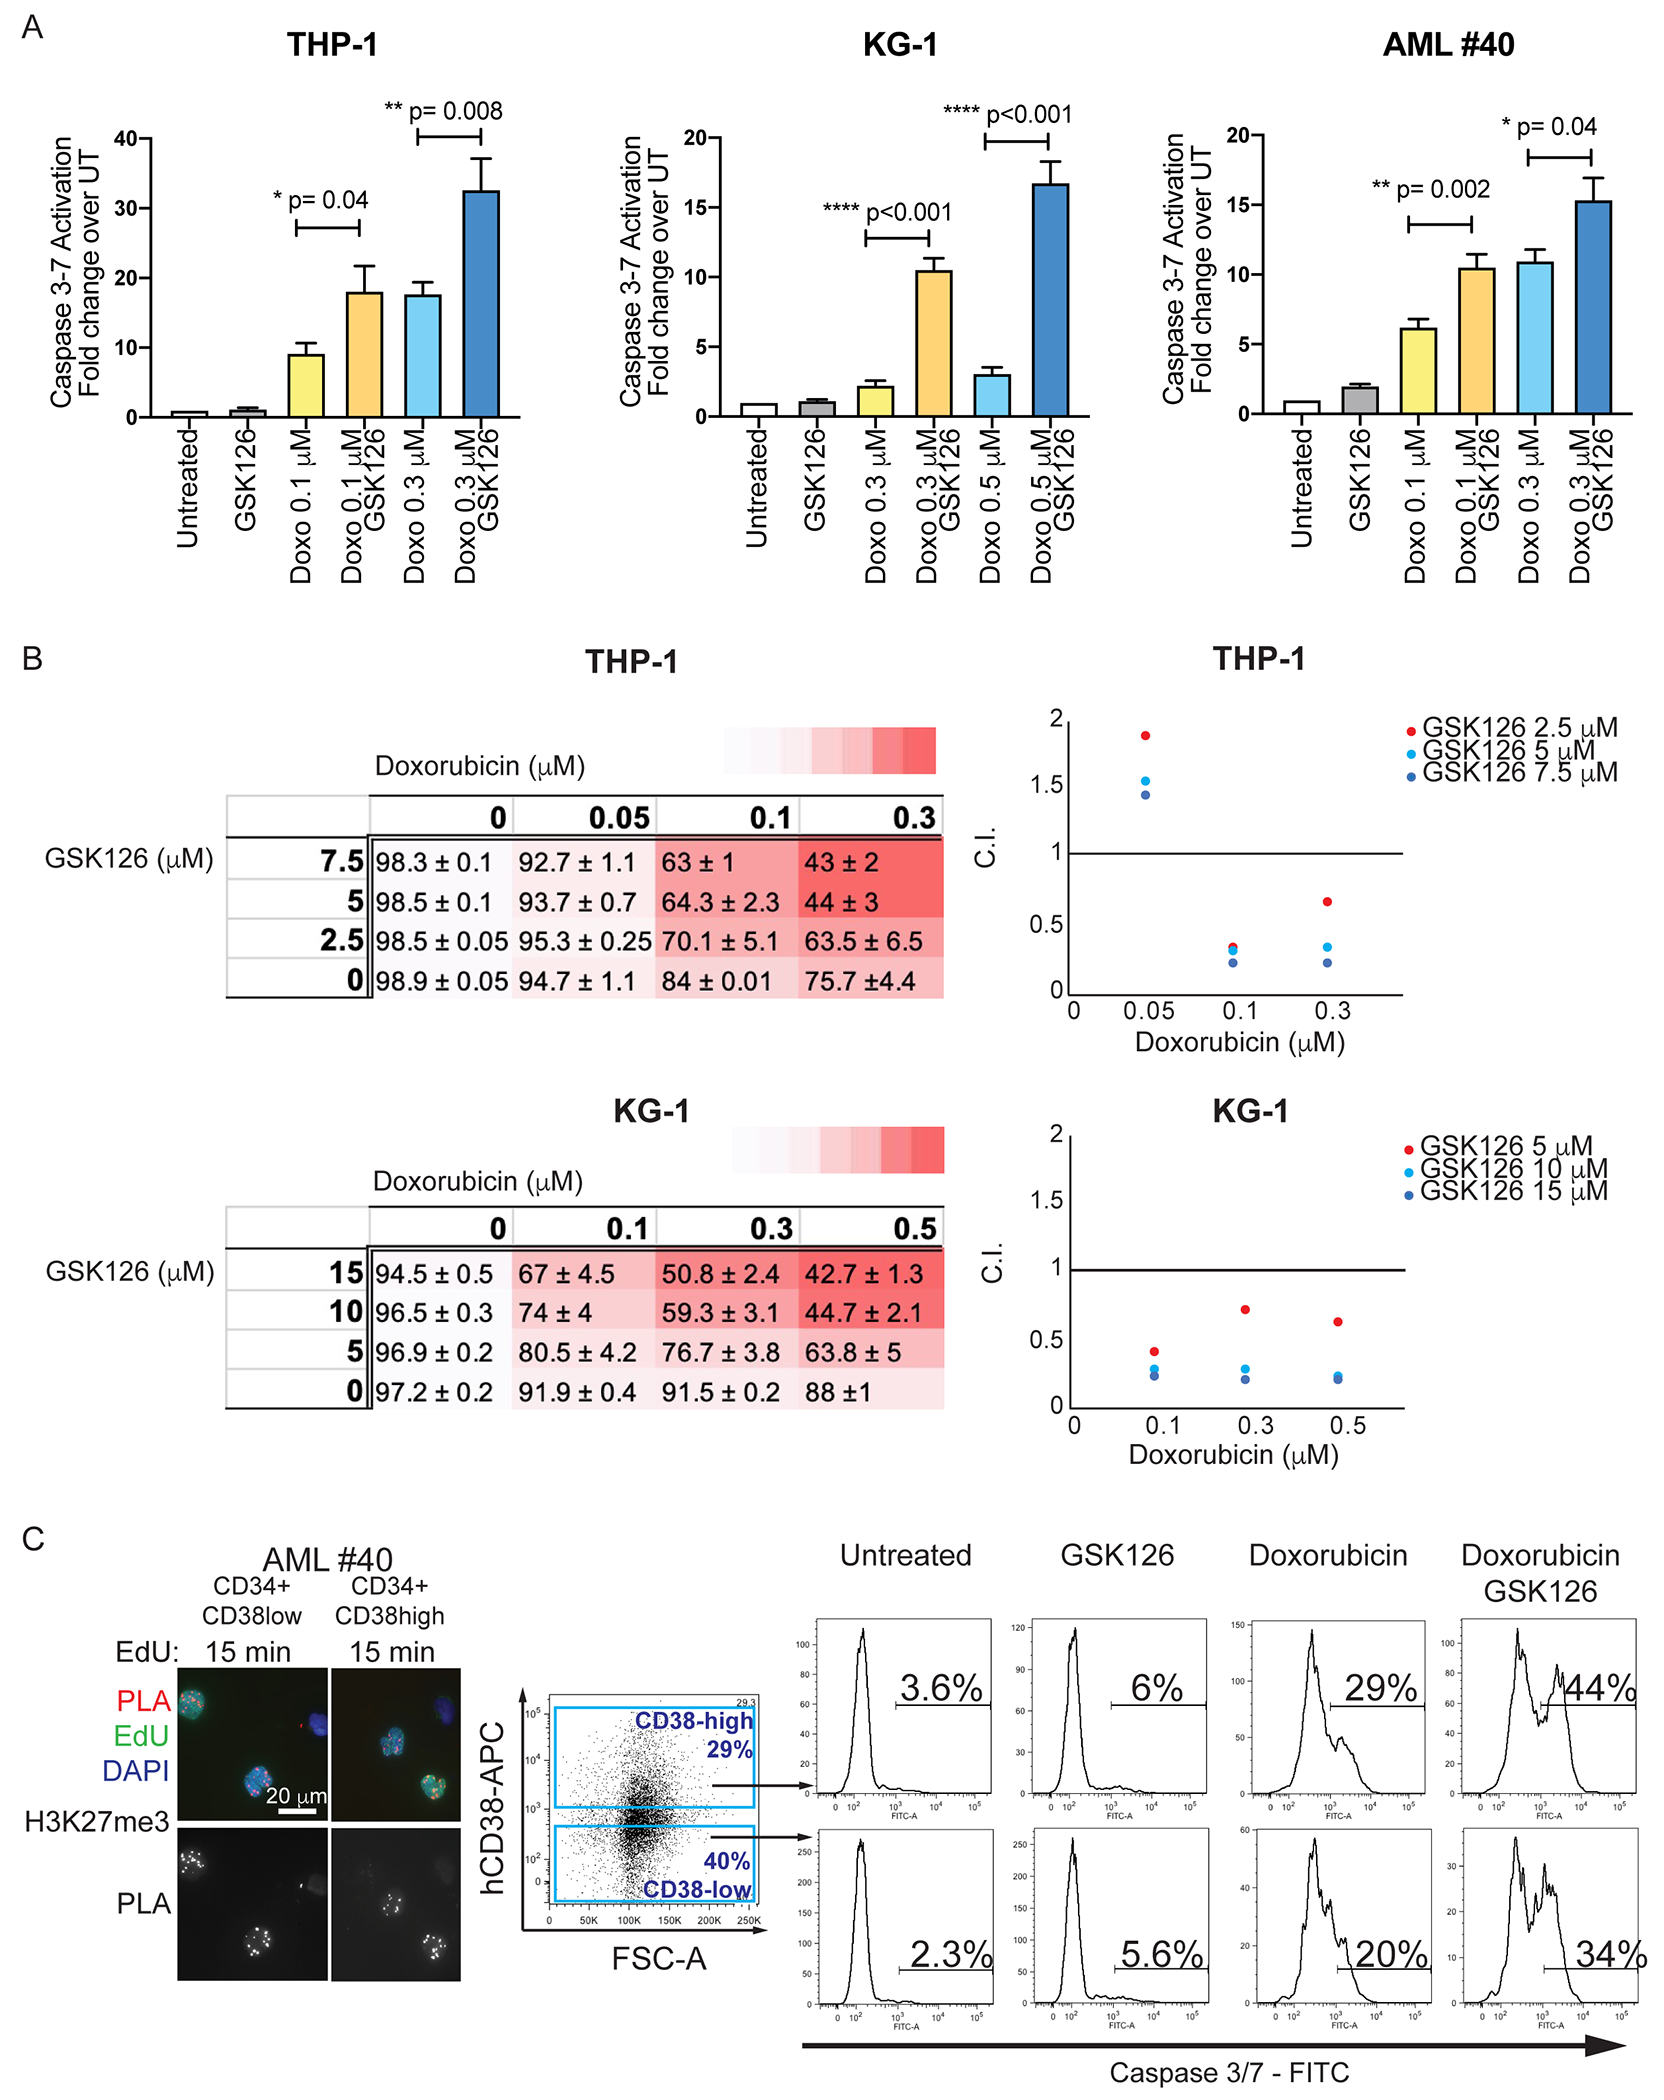
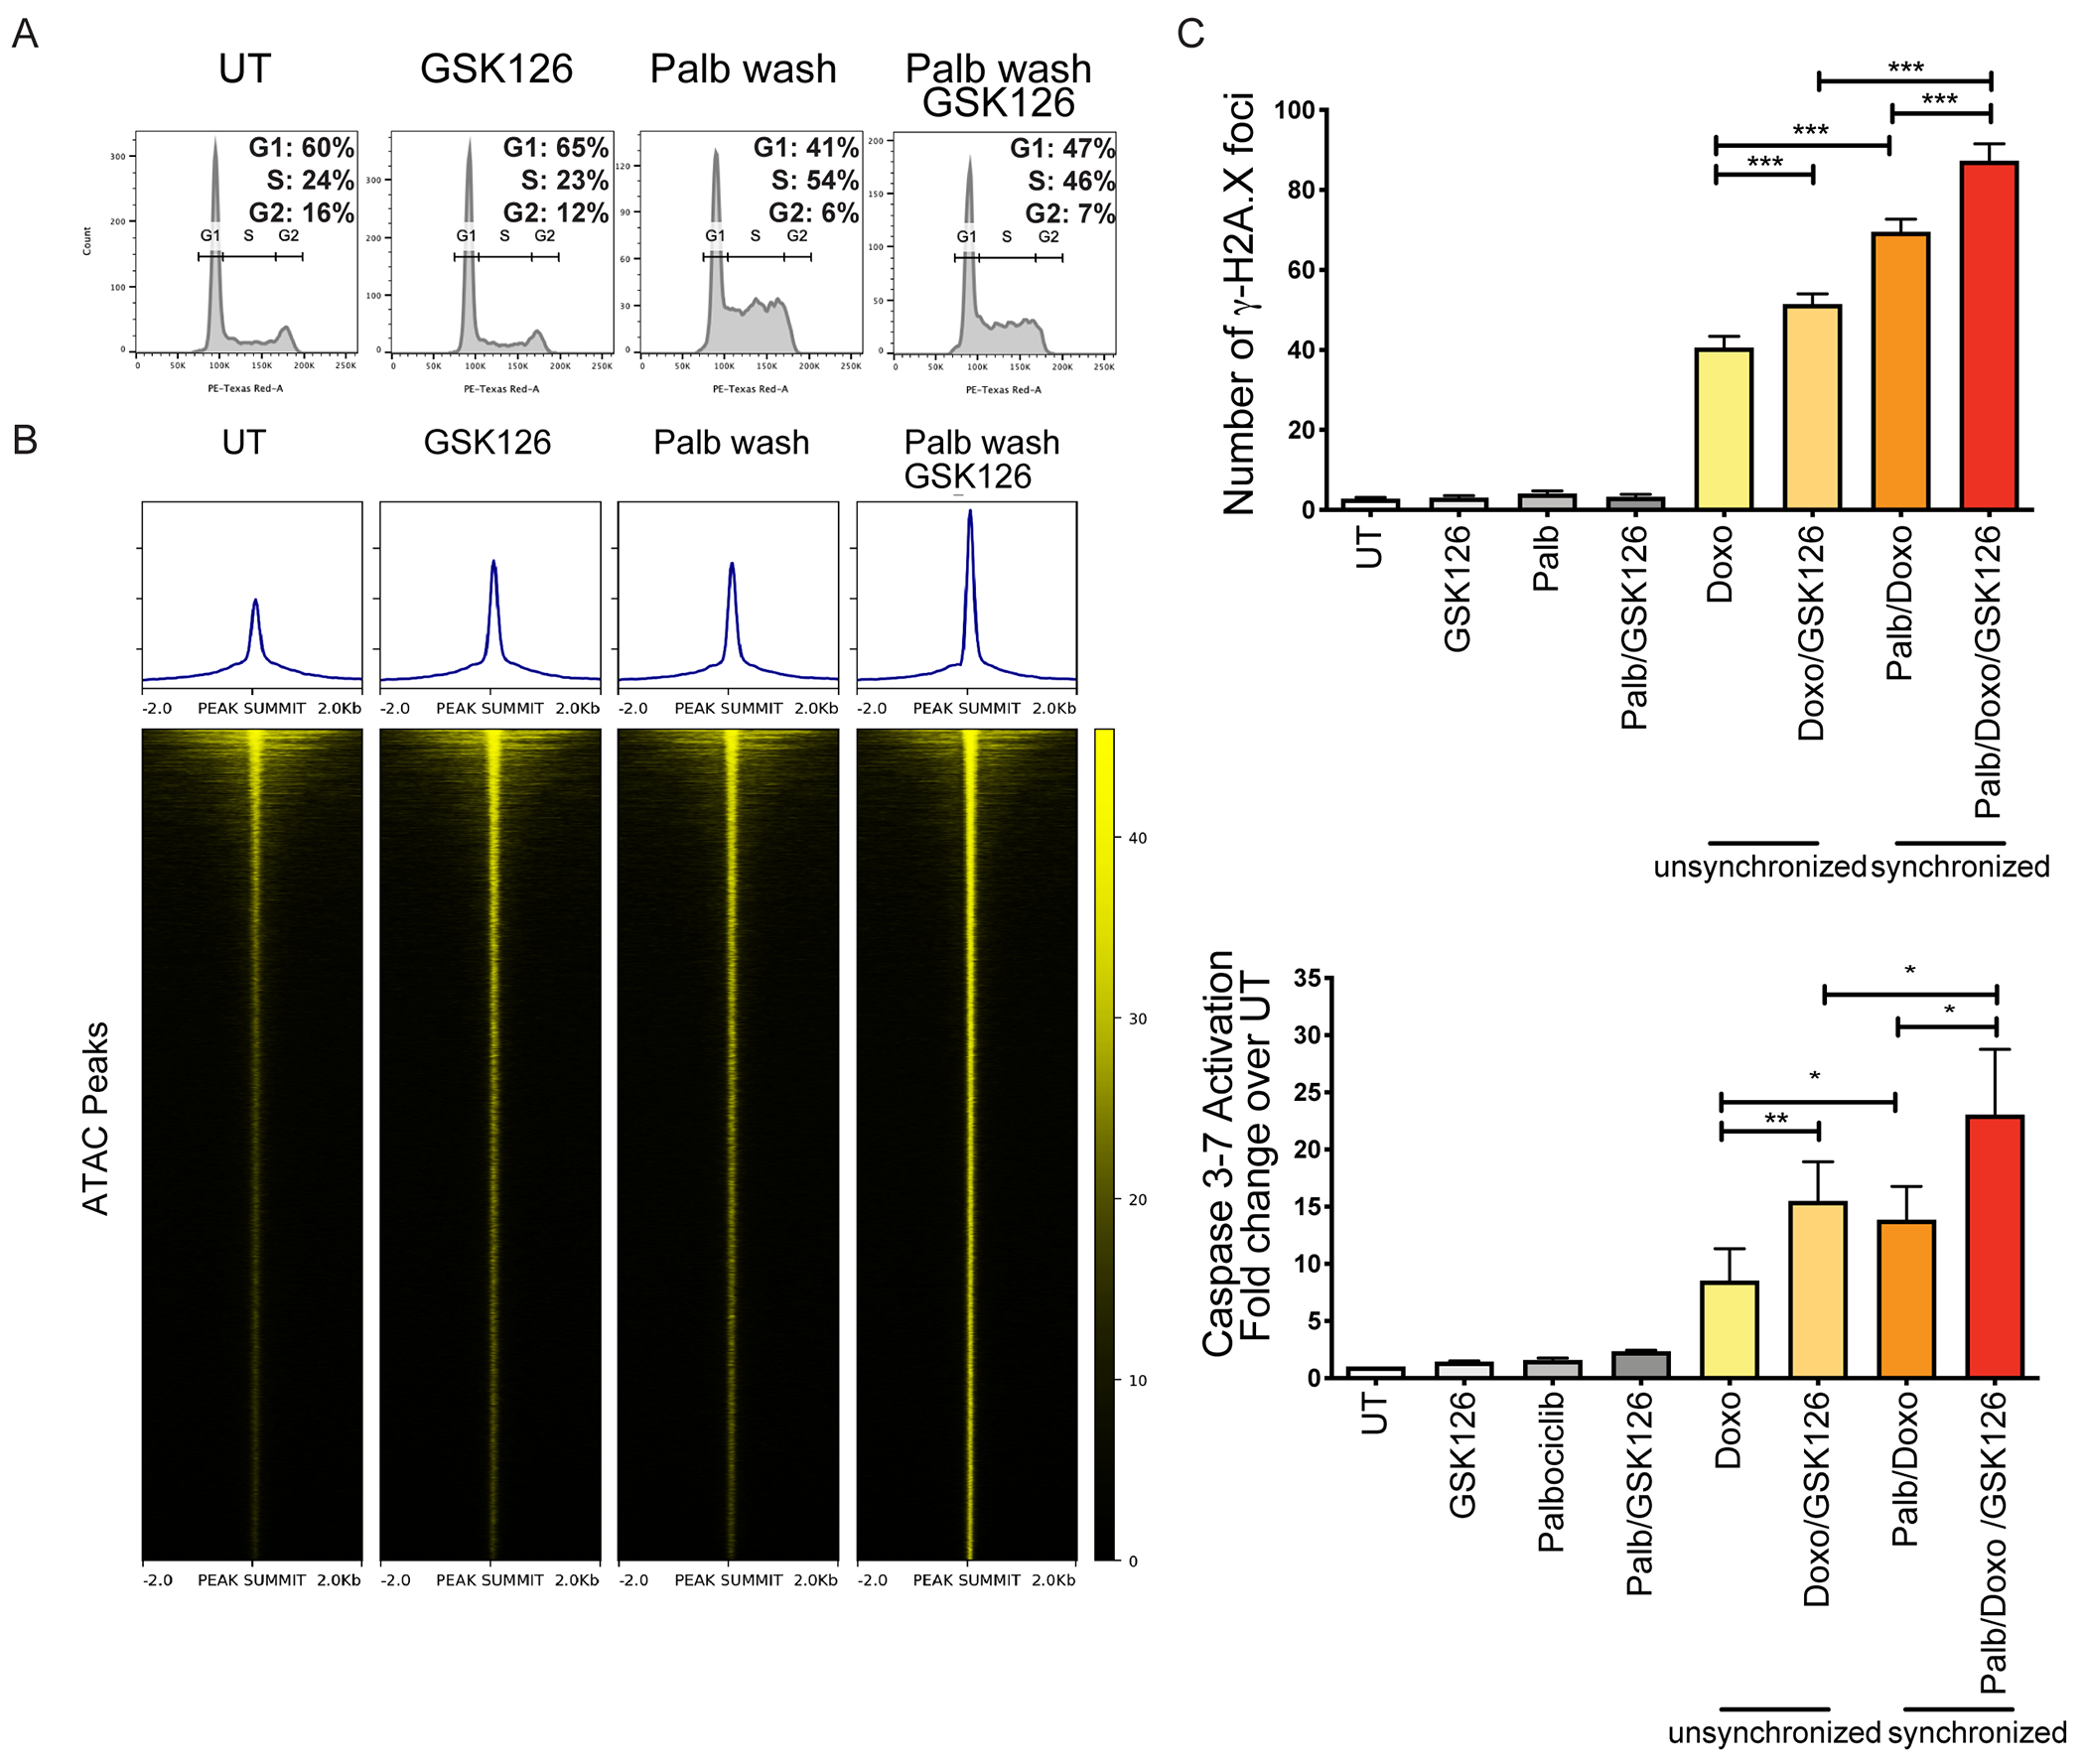
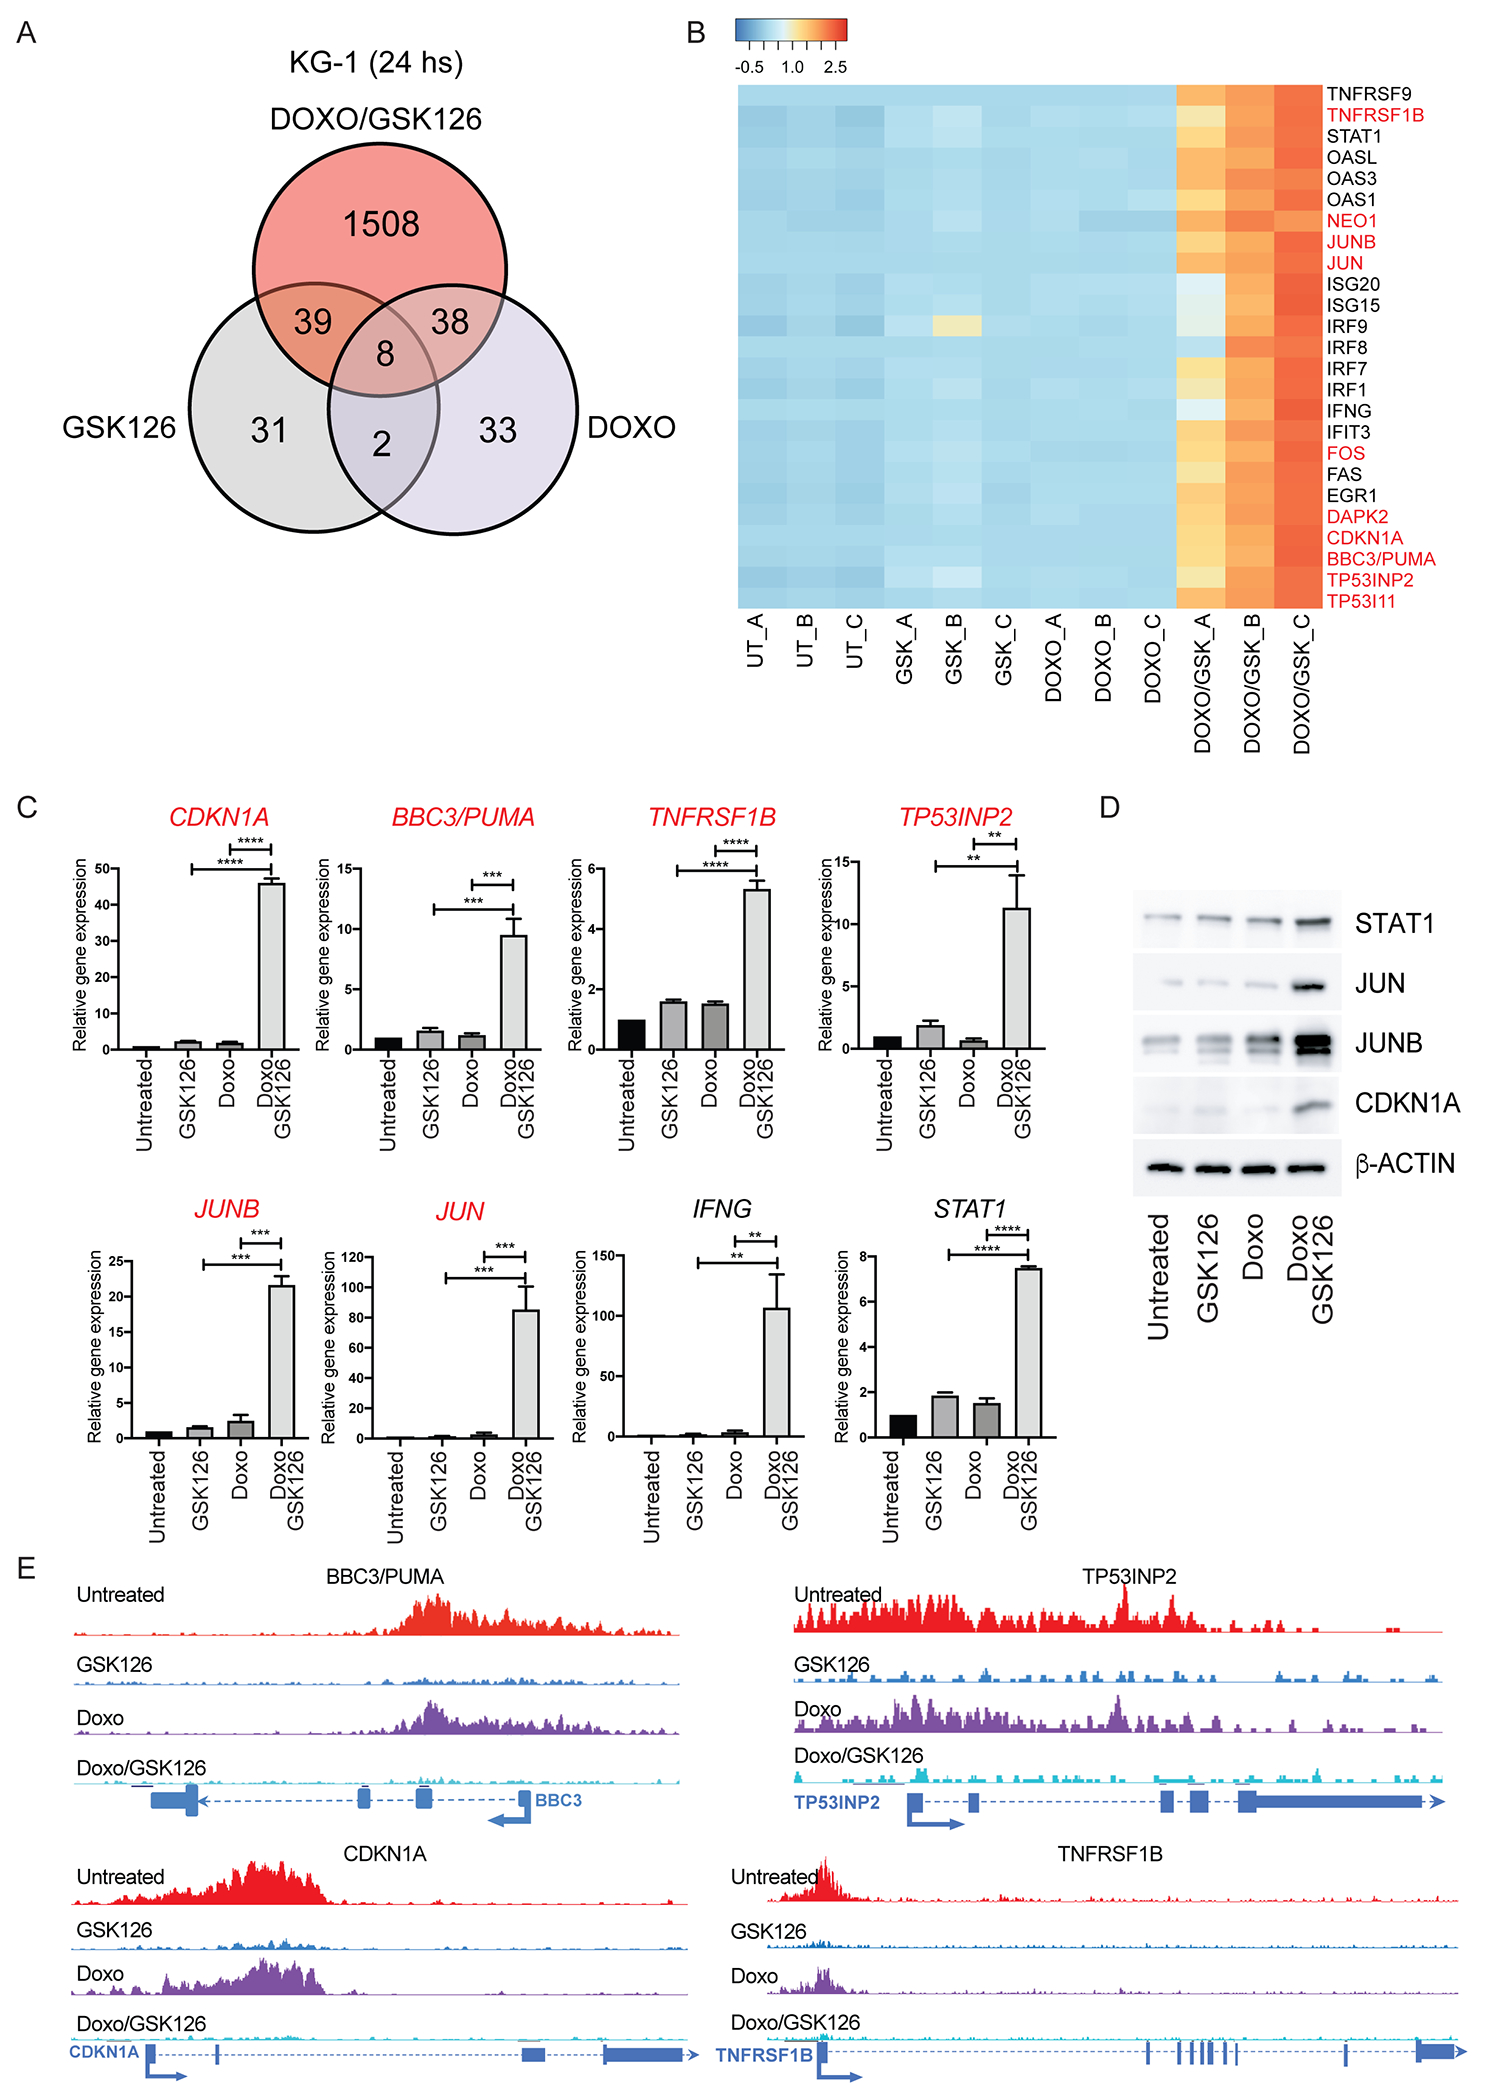
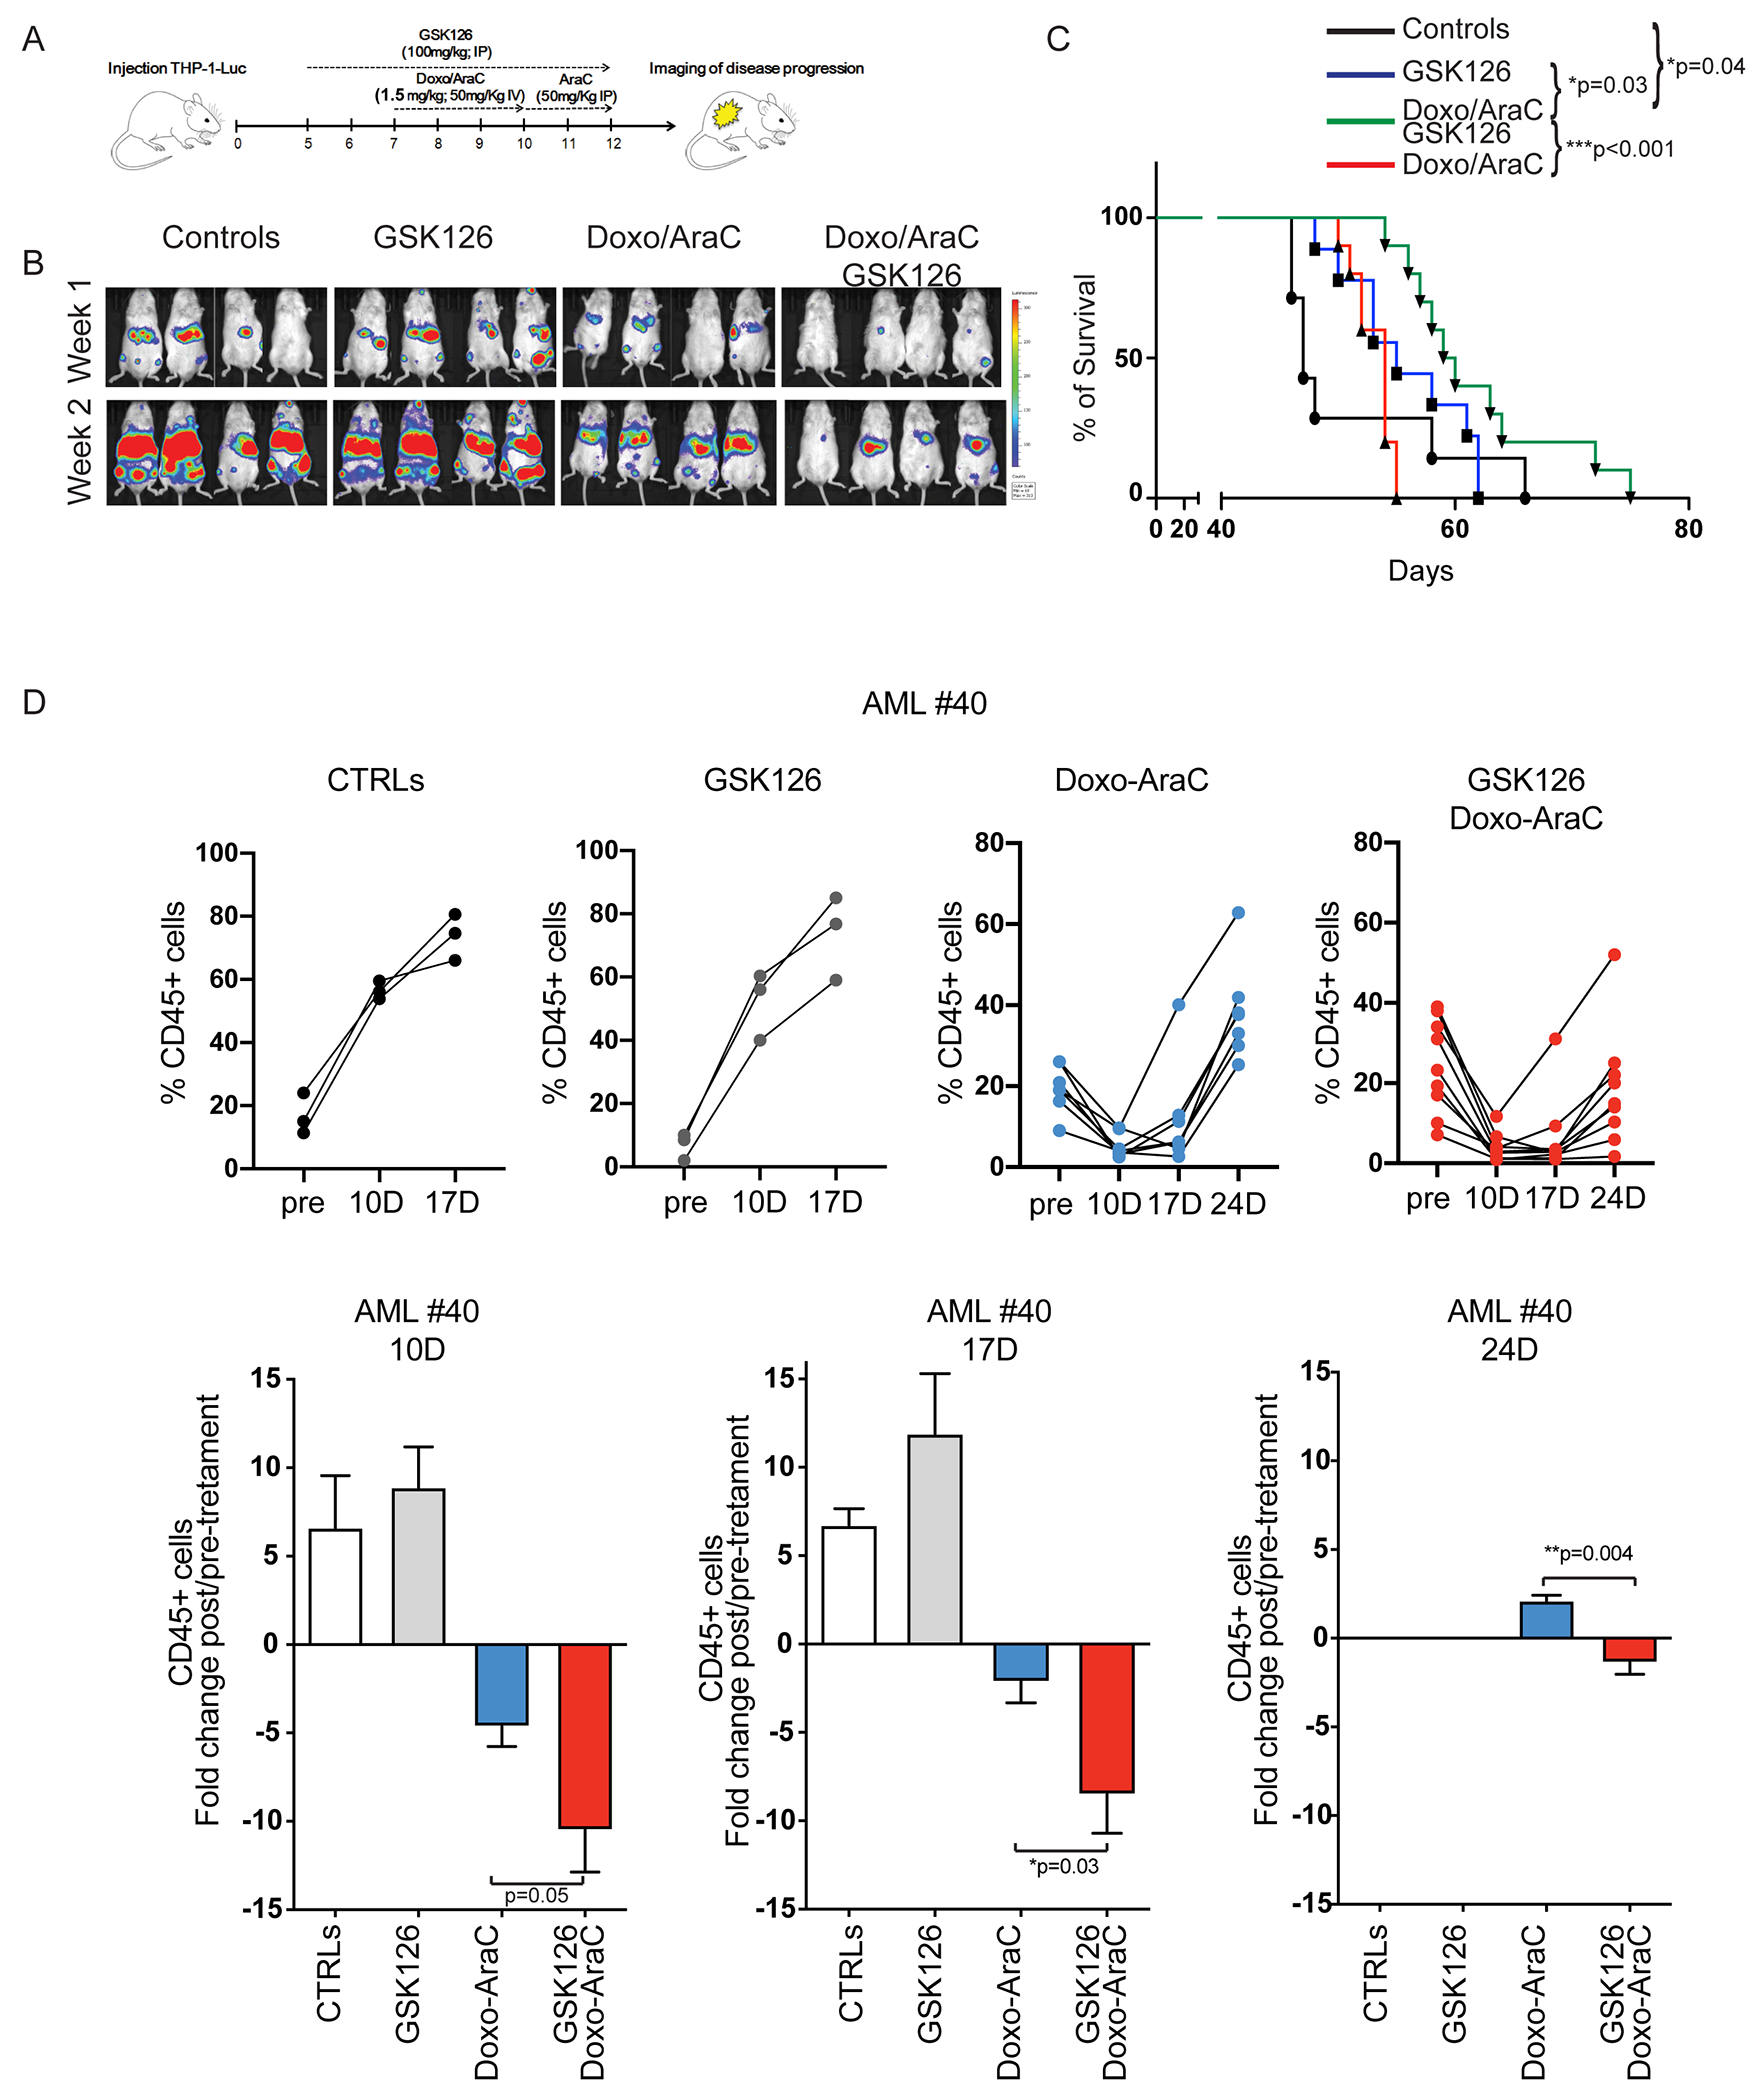
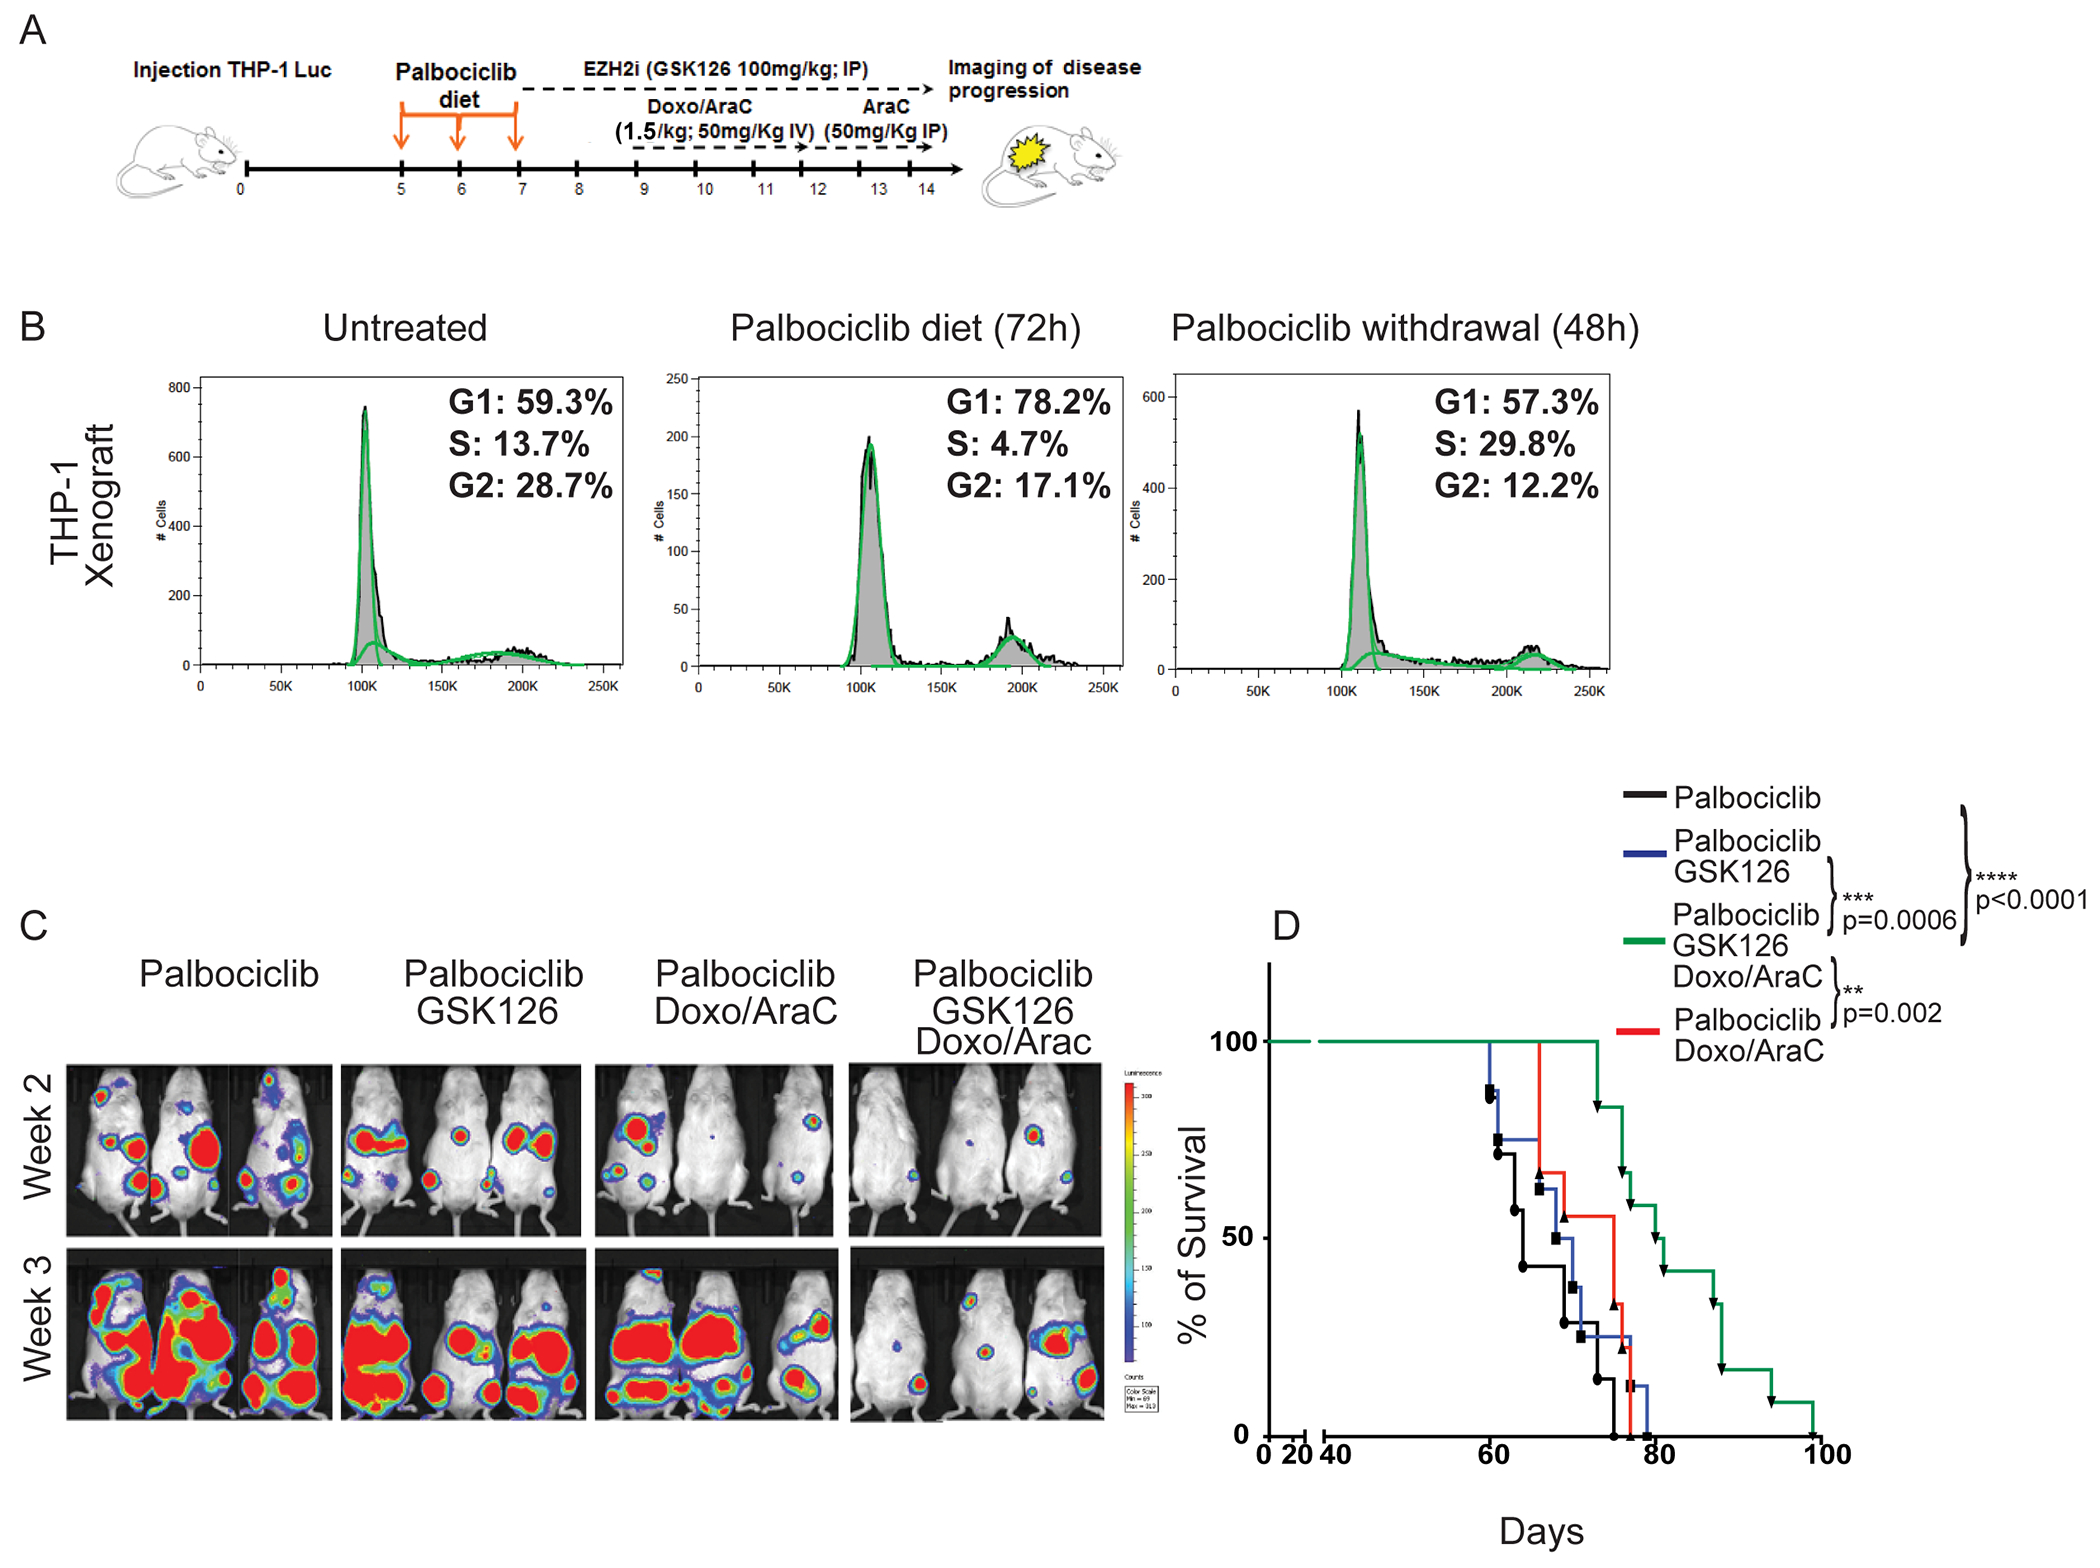
Despite treatment with intensive chemotherapy, acute myelogenous leukemia (AML) remains an aggressive malignancy with a dismal outcome in most patients. We found that AML cells exhibit an unusually rapid accumulation of the repressive histone mark H3K27me3 on nascent DNA. In cell lines, primary cells and xenograft mouse models, inhibition of the H3K27 histone methyltransferase EZH2 to decondense the H3K27me3-marked chromatin of AML cells enhanced chromatin accessibility and chemotherapy-induced DNA damage, apoptosis, and leukemia suppression. These effects were further promoted when chromatin decondensation of AML cells was induced upon S-phase entry after release from a transient G1 arrest mediated by CDK4/6 inhibition. In the p53-null KG-1 and THP-1 AML cell lines, EZH2 inhibitor and doxorubicin cotreatment induced transcriptional reprogramming that was, in part, dependent on derepression of H3K27me3-marked gene promoters and led to increased expression of cell death-promoting and growth-inhibitory genes.In conclusion, decondensing H3K27me3-marked chromatin by EZH2 inhibition represents a promising approach to improve the efficacy of DNA-damaging cytotoxic agents in patients with AML. This strategy might allow for a lowering of chemotherapy doses, with a consequent reduction of treatment-related side effects in elderly patients with AML or those with significant comorbidities. SIGNIFICANCE: Pharmacological inhibition of EZH2 renders DNA of AML cells more accessible to cytotoxic agents, facilitating leukemia suppression with reduced doses of chemotherapy.See related commentary by Adema and Colla, p. 359.


Figures

Figure 1.
Figure 1.. Accumulation of H3K27me3 on nascent DNA of AML cells.
DNA of AML cell lines (A, B), and primary AML samples (C, D) was labeled with EdU for 15 min and chased for the indicated times (A, B, C) or processed without chase (D). After biotin conjugation, CAA was performed between nascent DNA (biotin) and H3K27me3. PLA (red), Edu (biotin; green), DAPI (blue). Lower panels show PLA signals only. Quantification of CAA experiments is shown to the right.
Figure 2.
Figure 2.. EZH2 inhibition enhances cytotoxic drug-induced DNA damage in Doxo-treated AML cells.
(A-E) Evaluation of DNA damage (immunofluorescence microscopy analysis of γ-H2AX foci and comet assay) in cytotoxic agent-treated AML cell lines THP-1 and KG-1 (A, B) or primary AML cells (samples #10, #13, and #40; C-E). Cells were treated with GSK126 (5 μM) alone, Doxo (0.1 μM) alone, or pre-treated with GSK126 and then treated with the GSK126/Doxo combination for 24 hr. Quantification of γ-H2AX foci plus SEM is shown in the middle. One-way Anova: *p<0.05, **p<0.01; ***p<0.001 ****p<0.0001. Comet assay in drug-treated AML cells is shown to the right; 80–120 cells were analyzed in each sample. One-way Anova; *p<0.05; **p<0.01; ***p<0.0001.
Figure 3.
Figure 3.. EZH2 inhibition enhances apoptosis of cytotoxic agent-treated AML cells.
(A) THP-1, KG-1, and CD34+ AML primary cells (sample #40) were treated with Doxo alone (0.1 μM, 0.3 or 0.5 μM), or in combination with GSK126 (5 μM), for 48 hr. Apoptosis (Caspase 3/7 activity) was analyzed by flow cytometry. Graph bars represent fold change +/− SEM in the % of Caspase 3/7 activation over the untreated control. Unpaired t-test: p<0.05; **p<0.01; ***p<0.001; (B) Combination Indexes (C.I.) of GSK126/Doxorubicin-induced apoptosis in THP-1 and KG-1 cells. THP-1 or KG-1 cells were treated with three different concentrations of GSK126 and/or Doxorubicin. Left: Dose-response matrices showing % of viable cells (+/−SEM) after treatment with increasing doses of Doxorubicin, GSK126 and combinations of drug pair Doxo/GSK126. Colors in the dose-response matrices indicate different levels of responses (from white to red, decreasing viable cells) of THP-1 and KG-1 cells. Right: Viability data elaborated using CompuSyn software to calculate C.I. plotted on the Y-axis of a 2D graph. The X axes show increasing concentrations of Doxorubicin, while the different colors indicate increasing concentrations of GSK126 (see labels). (C.I.= 0.90-1.10 indicates additive effects; C.I.=0.1-0.9 indicates synergistic effects). (C) H3K27me3 accumulation on nascent DNA (left) and Caspase 3/7 activation in AML sample #40 CD34+CD38high or CD34+CD38low cells treated with GSK126 (5 μM), Doxorubicin (0.1 μM), or the two drugs in combination.
Figure 4.
Figure 4.. GSK126 treatment of S phase-enriched AML cells further increases Doxo-induced DNA damage and apoptosis.
(A) DNA content analysis of THP-1 cells (untreated, treated with Palbociclib (24 h; 500 nM)/washed, and cultured for an additional 10 hours in medium without Palbociclib or without Palbociclib+GSK126. (B) Heatmaps of normalized chromatin accessibility reads from ATAC-seq experiments in untreated and GSK126-treated unsynchronized THP-1 cells and in cells released from Palbociclib-induced cell cycle arrest and left untreated or treated with GSK126; heatmaps are ordered by total ATAC signals and each row represents the same DNA segment in all conditions. (C) THP-1 cells were treated with Palbociclib (500 nM; 24 h) to induce G1 arrest. After washing, THP-1 cells re-entering S phase were treated with GSK126 (5 μM; 12 h), before adding Doxo (0.1 μM) or GSK126/Doxo. DNA damage and apoptosis were examined after 24 h and 48 h, respectively. Left, quantification of γ-H2AX foci +/− SEM. Anova ***p<0.001; Right, apoptosis (Caspase 3/7 activity) by flow cytometry. Mean +/− SEM. Anova, *p<0.05: **p<0.01.
Figure 5.
Figure 5.. Gene subset regulated by GSK126/Doxo treatment in the KG-1 cell line.
(A) Venn diagram of genes differentially expressed in GSK126/Doxo-treated vs. Doxo- or GSK126-treated KG-1 cells; (B) Heat-map of genes selectively regulated by GSK126/Doxo compared to untreated or single GSK126 or Doxo treatments; (C) qPCR analysis of selected genes differentially regulated by GSK126/Doxo treatment. Data represent mean + SD of three independent experiments. Statistical analysis: one way ANOVA with Bonferroni’s correction; **p<0.01, ***p<0.001, ****p<0.0001; (D) Western blot analysis of selected genes overexpressed in GSK126/Doxo-treated cells; (E) Examples of four genes from H3K27me3 ChIP-seq in KG-1 cells showing loss of H3K27me3 marking after GSK126 or GSK126/Doxo treatment. Genes labeled in red in the heat-map and in the q-PCR experiments (B, C, D) exhibit loss of H3K27me3 marking after GSK126 or GSK126/Doxo treatment.
Figure 6.
Figure 6.. Leukemia burden and survival of chemotherapy and/or GSK126-treated immunodeficient mice injected with AML cells.
(A) Drug treatment and imaging protocol of NRG mice injected with THP-1 Luciferase+ cells (1 x10⁶/mouse). 5 days post-injection, mice were left untreated (controls), treated with GSK126 alone for 7 days (GSK126 group), or pre-treated (2 days) with GSK126 and co-treated with GSK126 and chemotherapy for 5 additional days (Doxo/AraC/GSK126 group); the Doxo/AraC only group was treated for 5 days, starting 7 days post THP-1 cell injection. (B) Mouse serial bioluminescence images acquired 1 and 2 weeks after the end of treatment; drug treatments are indicated at top. (C) Kaplan-Meier survival curves for all four cohorts (control and three drug treatment regimens) of NRG mice injected with THP-1 cells. Long-rank test: *p<0.05, **p<0.01. (D) Leukemia burden of untreated and drug-treated NRG-SGM3 mice injected with primary AML cells. Mice were injected with AML sample #40 (1.5x 10⁶ cells/mouse). When peripheral blood human CD45-positive cells were >10%, mice were divided in 4 groups and treated with vehicle, GSK126, Doxo/Ara-C, or the GSK126/Doxo/Ara-C combination; leukemia burden was assessed by measuring the percentage of peripheral blood leukemic cells by anti-human CD45-FITC flow cytometry at one-week interval starting 10 days after therapy cessation. Upper row, leukemia load shown as percentage of CD45+ cells in individual mice; lower row, fold changes of the percentage of leukemic cells in pre-treated vs treated mice in each cohort. Unpaired t-test *p<0.05, **p<0.01.
Figure 7.
Figure 7.. Leukemia burden and survival of NRG mice injected with THP-1-Luc cells, pre-treated with Palbociclib and then treated with chemotherapy and/or GSK126.
(A) NRG mice were injected with THP-1-Luciferase+ cells (1 x10⁶/mouse). 5 days post-injection, mice were treated for 3 days with Palbociclib (150 mg/Kg in the diet). Mice were left untreated (Palb), treated with GSK126 alone for 7 days (Palb/GSK126 group), or pre-treated (2 days) with GSK126 and then co-treated with GSK126 and chemotherapy for 5 additional days (Palb/GSK126/Doxo/AraC group); the Palb/Doxo/AraC group was treated for 5 days, starting 10 days post-cell injection. (B) DNA content analysis of THP-1 cells purified from the bone marrow of NRG mice (untreated, fed with Palbociclib-supplemented chow for 72 hours, fed with Palbociclib-supplemented chow for 72 hours and then for 48 hours with Palbociclib-free chow) injected 4 weeks earlier with THP-1 cells (1 x 10⁶ cells/mouse); (C) Bioluminescence images acquired 2 and 3 weeks after the end of treatment. (D) Kaplan-Meyer survival curves of mouse cohorts (control and drug-treated). Long-rank test: **p<0.01, ***p<0.001, ****p<0.0001

Comment in

References

    1. Thomas D, and Majeti R. Biology and relevance of human acute myeloid leukemia stem cells. Blood 2017; 129:1577–1585, 2017. - PMC - PubMed
    1. The Cancer Genome Atlas Network. Genomic and epigenomic landscapes of adult de novo acute myeloid leukemia. N Engl J Med 2013; 368:2059–2074. - PMC - PubMed
    1. Dohner H, Weisdorf DJ, and Bloomfield C. Acute myeloid leukemia. N Engl J Med 2015; 373:1136–1152. - PubMed
    1. Papaemmanuil E, Gerstung M, Bullinger L, Potter NE, Henser M, Thol F, Bolli N, Gundem G, Van Loo P, Martincorena I, Ganly P, Mudie L, McLaren S, O’Meara S, Reine K, Jones DR, Teague JW, Butler AP, Greaves MF, Ganser A, Dohner K, Schlenk RF, Dohner H, and Campbell PJ. Genome classification and prognosis in acute myeloid leukemia. N Engl J Med 2016; 374:2209–2221. - PMC - PubMed
    1. Li S, Mason EC, and Melnick A. Genetic and epigenetic heterogeneity in acute myeloid leukemia. Current Opin Genet Dev 2016; 36:100–106. - PMC - PubMed

Publication types

LinkOut - more resources