

Phase Separation Mediates NUP98 Fusion Oncoprotein Leukemic Transformation
- PMID: 34903620
- PMCID: PMC8983581
- DOI: 10.1158/2159-8290.CD-21-0674
Phase Separation Mediates NUP98 Fusion Oncoprotein Leukemic Transformation
Abstract
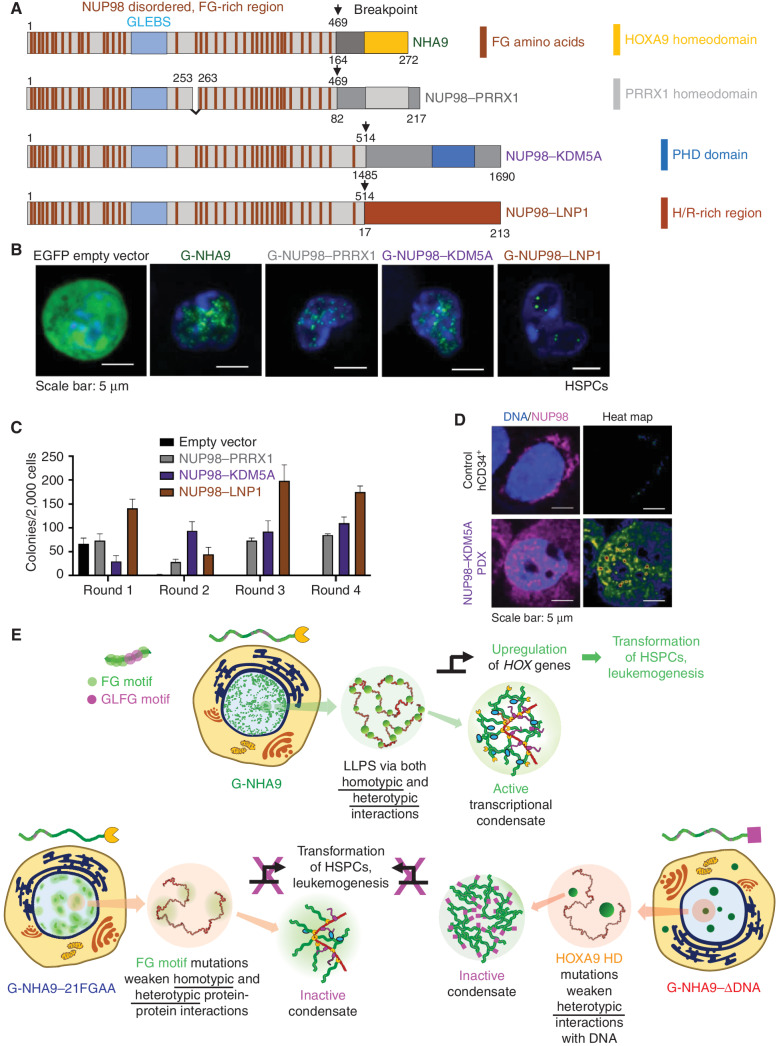
NUP98 fusion oncoproteins (FO) are drivers in pediatric leukemias and many transform hematopoietic cells. Most NUP98 FOs harbor an intrinsically disordered region from NUP98 that is prone to liquid-liquid phase separation (LLPS) in vitro. A predominant class of NUP98 FOs, including NUP98-HOXA9 (NHA9), retains a DNA-binding homeodomain, whereas others harbor other types of DNA- or chromatin-binding domains. NUP98 FOs have long been known to form puncta, but long-standing questions are how nuclear puncta form and how they drive leukemogenesis. Here we studied NHA9 condensates and show that homotypic interactions and different types of heterotypic interactions are required to form nuclear puncta, which are associated with aberrant transcriptional activity and transformation of hematopoietic stem and progenitor cells. We also show that three additional leukemia-associated NUP98 FOs (NUP98-PRRX1, NUP98-KDM5A, and NUP98-LNP1) form nuclear puncta and transform hematopoietic cells. These findings indicate that LLPS is critical for leukemogenesis by NUP98 FOs.
Significance: We show that homotypic and heterotypic mechanisms of LLPS control NUP98-HOXA9 puncta formation, modulating transcriptional activity and transforming hematopoietic cells. Importantly, these mechanisms are generalizable to other NUP98 FOs that share similar domain structures. These findings address long-standing questions on how nuclear puncta form and their link to leukemogenesis. This article is highlighted in the In This Issue feature, p. 873.
©2021 The Authors; Published by the American Association for Cancer Research.
Figures
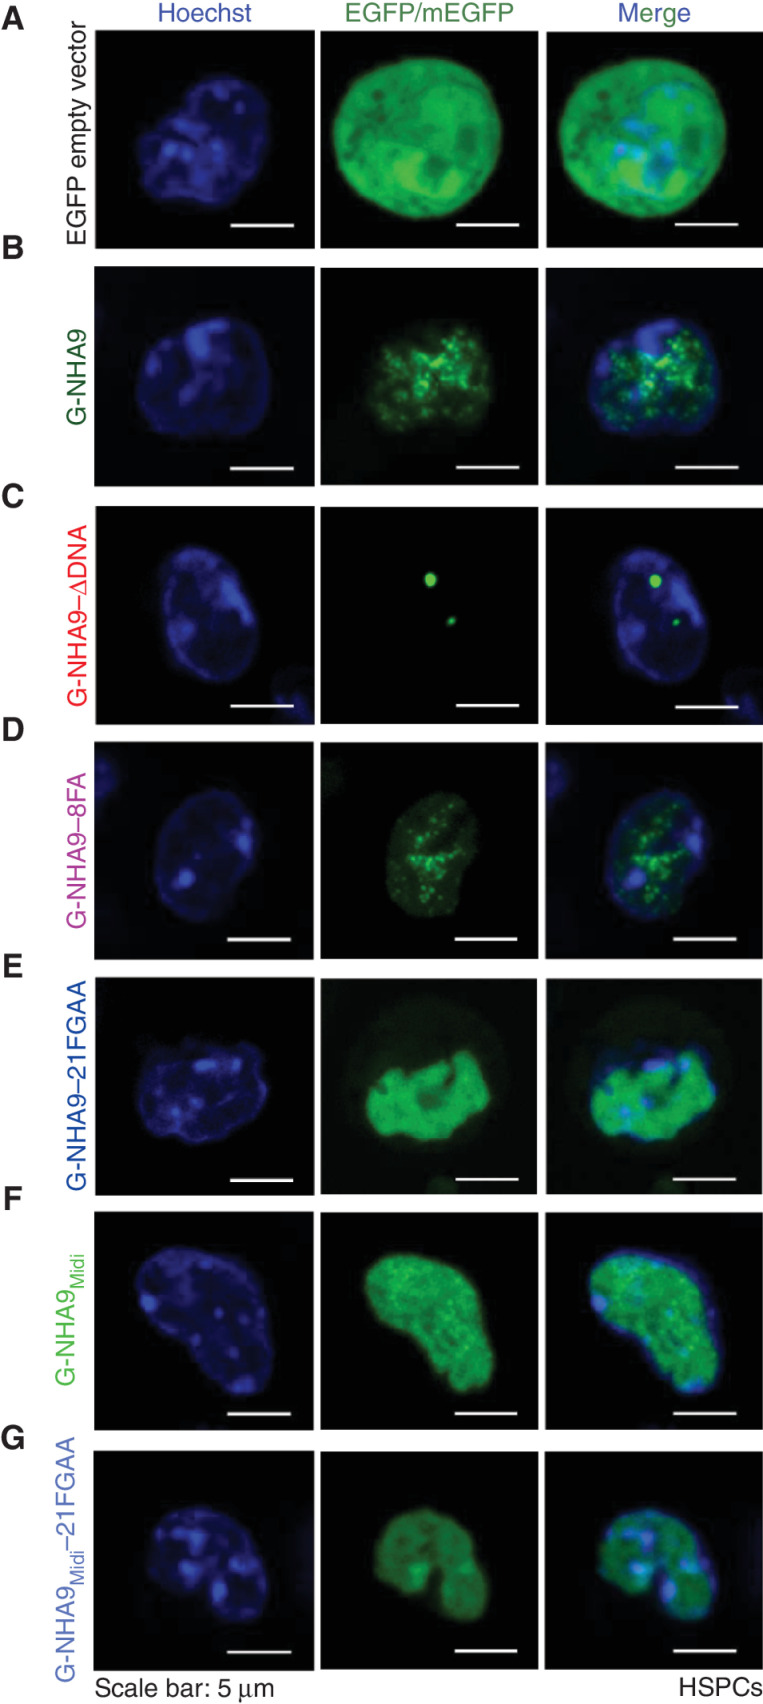
![Figure 1. LLPS by the N-terminal FG motif–rich IDR governs the puncta-forming behavior of G-NHA9 in cells and in vitro. A, Scheme depicting the hypothesized role of both homotypic and heterotypic interactions in the formation of aberrant transcriptional condensates by NHA9 via LLPS. B, Representative confocal microscopy images of live HEK293T cells expressing EGFP empty vector (top, green) or G-NHA9 (bottom, green). DNA is stained with Hoechst dye (blue). C, The number of puncta per 103 μm3 nuclear volume (puncta #, /103 μm3) versus the total nuclear concentration of the G-NHA9 construct [G-NHA9]. The dotted lines represent linear fitting for visualization purposes, and the gray area indicates 95% confidence interval. Number of cells (n) = 935, including the cells with zero punctum. D, Confocal micrographs of fluorescence recovery (inside yellow box) of a single G-NHA9 punctum in HEK293T cells at different times after photobleaching (FRAP, left). FRAP recovery curve for a photobleached punctum (green, right) and an unbleached punctum (black, right). Individual puncta were manually tracked at different times, and recovery was plotted as the mean ± SD (n = 20). E, The average puncta volume (Vp, μm3) versus the total nuclear concentration of the G-NHA9 construct [G-NHA9]. The dotted lines represent linear fitting for visualization purposes, and the gray area indicates 95% confidence interval. Number of cells (n) = 378, excluding the cells with zero punctum. F, Confocal fluorescence micrographs of Alexa 488–labeled NHA9 condensates prepared in vitro with increasing protein concentration. The micrographs are presented as maximum intensity projections of 13 confocal planes offset by 0.5 μm per plane. Saturation concentration (Csat) is less than 10 nmol/L. G, Confocal micrographs of fluorescence recovery of 20 μmol/L NHA9 (mixed with 200 nmol/L Alexa 488–labeled NHA9) within condensates at multiple time points acquired within 2 minutes of initiation of phase separation (left). FRAP recovery curves for NHA9 condensates within 2 (green), 4 (brown), and 8 (cyan) minutes of formation (right). Data are plotted as mean ± SD (n = 15). T1/2 represents the half-life of the fluorescence recovery, and Mf represents the mobile fraction.](https://cdn.ncbi.nlm.nih.gov/pmc/blobs/f002/9387588/6ef9fd6f25f0/1152fig1.jpg)
![Figure 2. DNA binding by the HOXA9 homeodomain of NHA9 influences puncta morphology and behavior. A, Representative confocal microscopy image of live HEK293T cells expressing G-NHA9–ΔDNA (green). DNA is stained with Hoechst dye (blue). An overlay of the G-NHA9–expressing cell from Fig. 1B is included for comparison (right). B and C, Plots of puncta # (/103 μm3; B) and Vp (μm3; C) versus [G-NHA9 construct] for G-NHA9 (green) and G-NHA9–ΔDNA (red) from data represented in A. Data are plotted on a semi-log (y-axis: log10) scale. D, Still images of multiple time points taken from a time-lapse confocal fluorescence microscopy video (Supplementary Video S2) of a fusion event in an HEK293T cell expressing G-NHA9–ΔDNA. E, Confocal micrographs of FRAP of a G-NHA9–ΔDNA punctum in HEK293T cells at different time points after photobleaching (left). Fluorescence recovery curves are shown for bleached (red, right) and unbleached puncta (black, right). The recovery curve for G-NHA9 is also provided for comparison (green). Individual puncta were manually tracked at different times, and the G-NHA9–ΔDNA fluorescence intensity versus recovery time was plotted as the mean ± SD (n = 20). The pairwise P value for the recovery curves between G-NHA9 and G-NHA9–ΔDNA is 2.2 × 10⁻¹⁶ using the t test. F–H, Plots of the concentration of the NHA9 construct in the nuclear light phase ([LP], μmol/L; F) and within puncta (termed the dense phase; [DP], μmol/L; G), and the Kp (Kp =) (H) versus [G-NHA9 construct] for G-NHA9 (green) and G-NHA9–ΔDNA (red). Data are plotted on a semi-log (y-axis: log10) scale. I, 1D-density distribution of PCC per cell for G-NHA9 and G-NHA9–ΔDNA to analyze the linear relationship of the signal between mEGFP and Hoechst. Refer to Supplementary Table S2 for mean values ± standard error. The pairwise P values between G-NHA9 and G-NHA9–ΔDNA are shown in each plot (B, C, F–I; see Methods; n = 935 and 780 in B, F, and I including the cells with zero punctum, and n = 378 and 254 in C, G, and H excluding the cells with zero punctum, respectively, for G-NHA9 and G-NHA9–ΔDNA).](https://cdn.ncbi.nlm.nih.gov/pmc/blobs/f002/9387588/19e3451bfd2f/1152fig2.jpg)
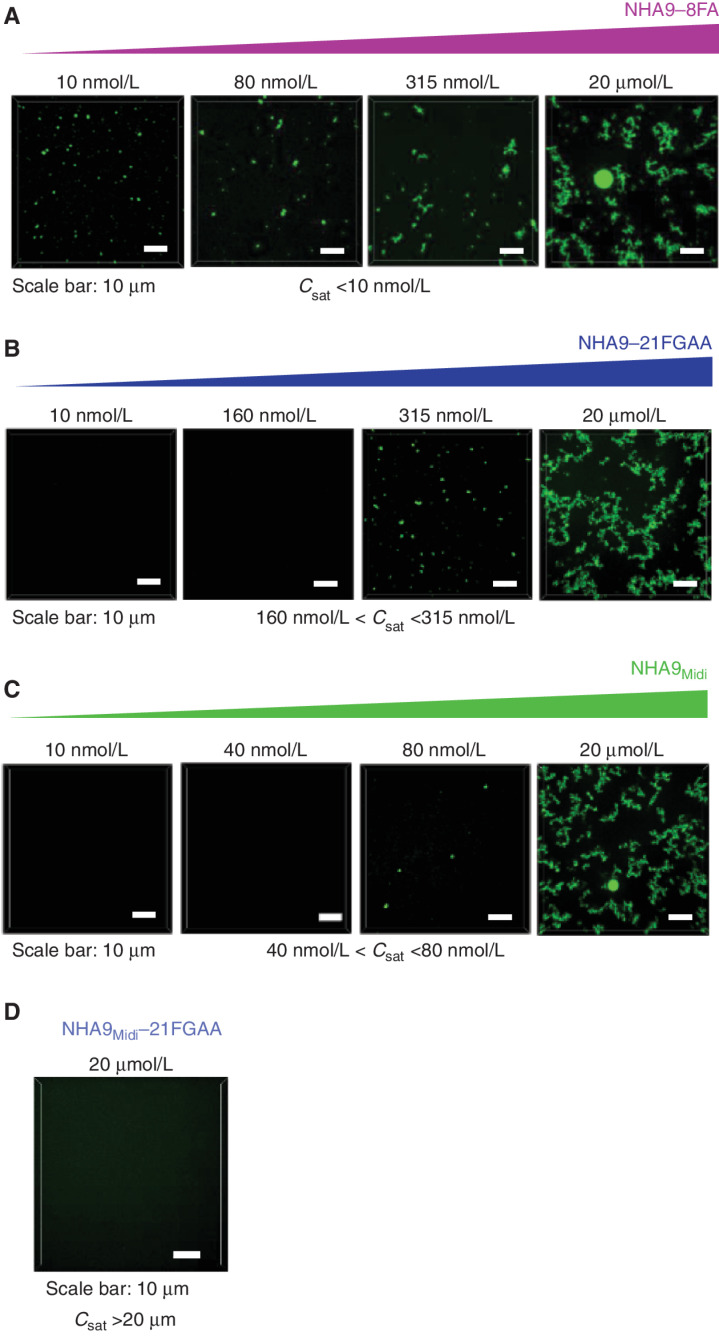
![Figure 3. Mutation of multiple F and FG residues in the FG-rich IDR of NHA9 alters puncta formation in cells. A, Schematic of NHA9 and mutant constructs used in this study. FG motif valence is shown on the left. B, Representative image of live HEK293T cells expressing G-NHA9–8FA (top, green) and G-NHA9–21FGAA (bottom, green). DNA is stained with Hoechst dye (blue). C–F, Plots of puncta # (/103 μm3; C), Vp (μm3; D), Kp (Kp =) (E), and ΔGTr (kcal/mol; F) versus [G-NHA9 construct] for G-NHA9 (green), G-NHA9–8FA (purple), and G-NHA9–21FGAA (blue) from data represented in B. Data are plotted on a semi-log (y-axis: log10) scale in C–E. Refer to Supplementary Table S2 for mean values ± standard error. The pairwise P value between G-NHA9 versus G-NHA9–8FA and G-NHA9 versus G-NHA9–21FGAA is shown in each plot (C–F; n = 935, 683, and 865 in C including the cells with zero punctum and n = 378, 273, and 159 in D–F excluding the cells with zero punctum, respectively, for G-NHA9, G-NHA9–8FA, and G-NHA9–21FGAA).](https://cdn.ncbi.nlm.nih.gov/pmc/blobs/f002/9387588/eefc835cf1f0/1152fig3.jpg)
Comment in
- Cancer Discov. 12:873.
- Cancer Discov. 12:873.
References
-
- Struski S, Lagarde S, Bories P, Puiseux C, Prade N, Cuccuini Wet al. NUP98 is rearranged in 3.8% of pediatric AML forming a clinical and molecular homogenous group with a poor prognosis. Leukemia 2017;31:565–72. - PubMed
-
- Bisio V, Zampini M, Tregnago C, Manara E, Salsi V, Di Meglio Aet al. NUP98-fusion transcripts characterize different biological entities within acute myeloid leukemia: a report from the AIEOP-AML group. Leukemia 2017;31:974–7. - PubMed
Publication types
MeSH terms
Substances
Grants and funding
LinkOut - more resources
Full Text Sources
Medical
Molecular Biology Databases
