. 2021 Dec 21;118(51):e2101580118.
doi: 10.1073/pnas.2101580118.

The hypothalamic link between arousal and sleep homeostasis in mice

Affiliations

The hypothalamic link between arousal and sleep homeostasis in mice

Tomoko Yamagata et al. Proc Natl Acad Sci U S A. .

Abstract

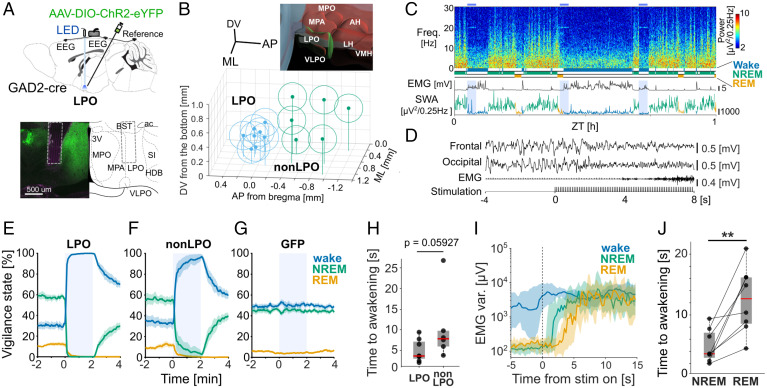
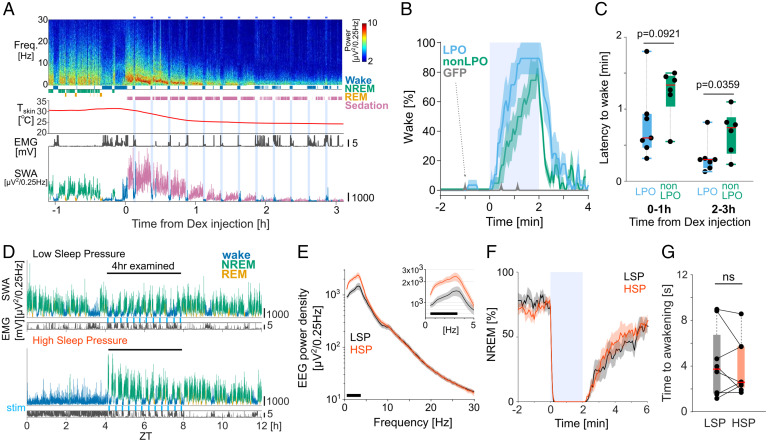
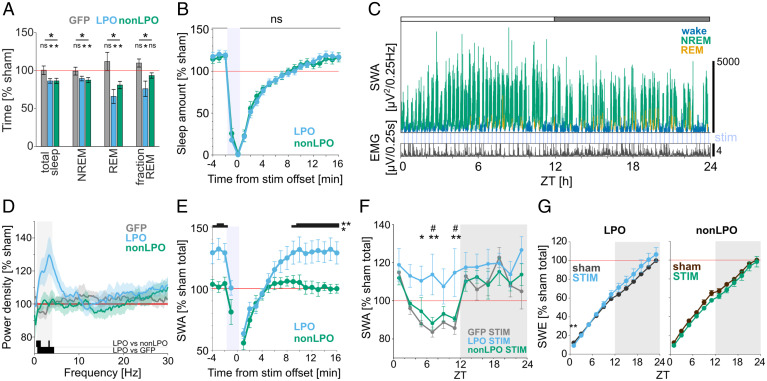
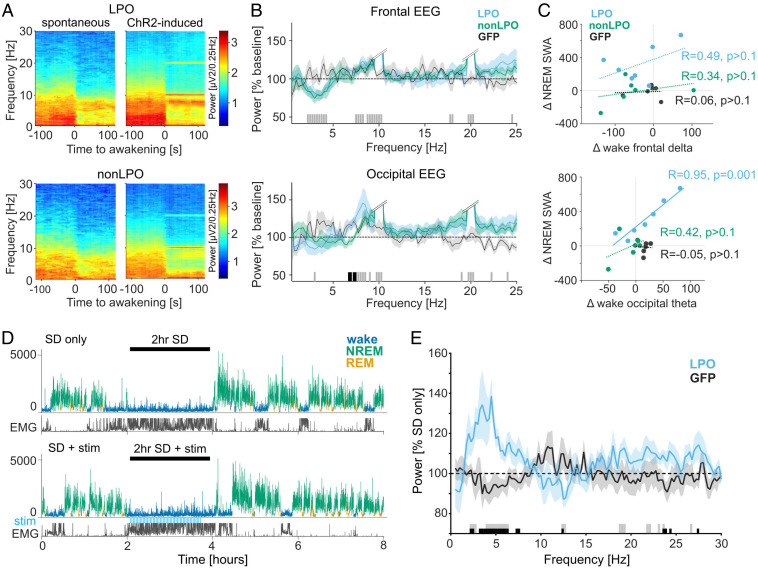
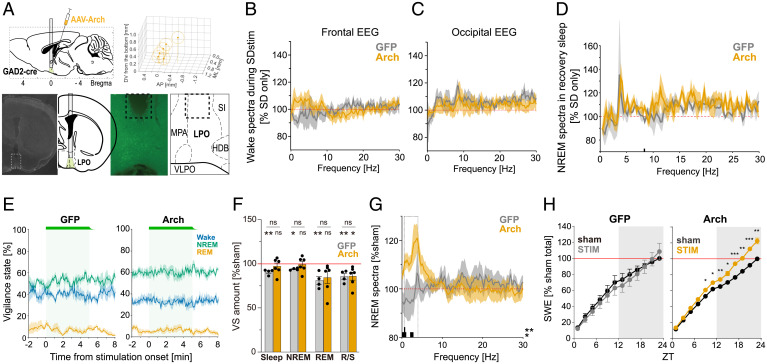
Sleep and wakefulness are not simple, homogenous all-or-none states but represent a spectrum of substates, distinguished by behavior, levels of arousal, and brain activity at the local and global levels. Until now, the role of the hypothalamic circuitry in sleep-wake control was studied primarily with respect to its contribution to rapid state transitions. In contrast, whether the hypothalamus modulates within-state dynamics (state "quality") and the functional significance thereof remains unexplored. Here, we show that photoactivation of inhibitory neurons in the lateral preoptic area (LPO) of the hypothalamus of adult male and female laboratory mice does not merely trigger awakening from sleep, but the resulting awake state is also characterized by an activated electroencephalogram (EEG) pattern, suggesting increased levels of arousal. This was associated with a faster build-up of sleep pressure, as reflected in higher EEG slow-wave activity (SWA) during subsequent sleep. In contrast, photoinhibition of inhibitory LPO neurons did not result in changes in vigilance states but was associated with persistently increased EEG SWA during spontaneous sleep. These findings suggest a role of the LPO in regulating arousal levels, which we propose as a key variable shaping the daily architecture of sleep-wake states.

Keywords: arousal; hypothalamus; mice; sleep; sleep homeostasis.


Conflict of interest statement

The authors declare no competing interest.

Figures

Fig. 1.
Fig. 1.
Optical activation of GAD2 neurons in the LPO and surrounding hypothalamic regions induces rapid awakening. (A) (Top) Schematic diagram of the implant. (Bottom) Representative brain section from an animal in the LPO group and corresponding illustration from the mouse brain atlas (55). Dotted lines depict the optic fiber tip location. (B) Schematic of the optic fiber tip locations in all animals with ChR2 expression. The center of fiber tip is shown as a dot, and the stimulation coverage areas estimated based on a fiber diameter (400 µm) are shown as circles for individual animals. Blue, LPO group; green, non-LPO group. Top right inset shows the three-dimensional atlas of the hypothalamic area in the region of interest (ROI), constructed by the Allen Brain Explorer (beta). LPO is shown in green, and other hypothalamic nuclei in the ROI are shown in red. (C) Representative EEG spectrogram and the corresponding hypnogram, EMG, and EEG SWA. Blue shade, photostimulation. Freq, frequency. Color scale: spectral power in common logarithm values. Hypnogram and SWA are color coded according to vigilance state (blue, wake; green, NREM; yellow, REM). (D) EEG and EMG traces during a typical photostimulation trial in one individual animal. From top to bottom: frontal EEG, occipital EEG, EMG, and the timing of photostimulation. (EG) Probability of wake, NREM sleep, and REM sleep before, during, and after a 2-min stimulation shown separately for the groups that received stimulation in the LPO area and outside of the LPO area (non-LPO) and GFP controls. Blue shade, photostimulation. Mean values ± SEM. (H) Latency to awakening. Data points represent individual mice. Box represents 25/75 percentiles, and median values are in red. The P value is calculated by nonparametric two-sided Wilcoxon signed-rank test. (I) Representative EMG variance profile (median ± 25/75 percentiles) averaged relative to the stimulation onset in one mouse. (J) Latency to awakening for stimulations delivered during spontaneous NREM sleep and REM sleep in the LPO. Data points represent individual mice, box represents 25/75 percentiles across mice, and red bar represents median. **P = 0.007, two-sided Wilcoxon signed rank test. LPO, n = 8; non-LPO, n = 6; GFP controls, n = 8. 3V, third ventricle; ac, anterior commissure; AH, anterior hypothalamic area; AP, anteroposterior; BST, bed nucleus of stria terminalis; DV, dorsoventral; HDB, nucleus of the horizontal limb of the diagonal band; LH, lateral hypothalamic area; ML, mediolateral; MPA: medial preoptic area; SI, substantia innominata; VLPO, ventrolateral preoptic nucleus; VMH, ventromedial hypothalamic nucleus; ZT, Zeitgeber time.
Fig. 2.
Fig. 2.
Single-cell recordings in acute brain slices of GAD2LPO mice. (A) Representative electrophysiological characteristics of an LTS neuron in the preoptic area. (B) (Top left) Example of a membrane potential (Vm) response to ChR2 activation in a putative ChR2-positive cell (magnification of the trace shown in panel C). Note that depolarization starts immediately upon the onset of illumination. (Top right) Histogram of delays between optical stimulation and Vm response showing a bimodal distribution; responses with delay <1 ms were classified as ChR2+, with delays >1 ms classified as synaptic responses. (Bottom) Classification of cells according to ChR2 response properties. (C) Example trace of a putative ChR2-positive cell responding to 10 Hz stimulation. (D) Spike fidelity of putative ChR2-positive neurons represented as the proportion of light pulses followed by a spike. (E) Relationship between stimulation frequency and mean spike rate during stimulation in putative ChR2-positive neurons. (F) Representative electrophysiological characteristics of a non-LTS neuron in the preoptic area. (G) Representative traces and average evoked potentials (Top right) of a ChR2-negative neuron, exhibiting depolarizing light responses at −70 mV (bottom trace and bottom average evoked potential) and hyperpolarizing responses at a slightly depolarized Vm (upper trace and middle in average evoked responses). The top average evoked potential shows the light response at a depolarized membrane potential in the presence of bicuculline. Note the unmasking of excitatory responses. (H) Change in average evoked responses (at depolarized Vm) in response to blocking of ionotropic GABA receptors with bicuculline. *P = 0.02, t = 3.34, paired t test. (I) Change in average evoked responses (at resting Vm) in response to blockage of ionotropic glutamate receptors with CNQX. *P = 0.04, t = −2.78, paired t test. (J) Changes in spontaneous spike rates (induced by injection of depolarizing currents) during 2 min of optical stimulation at 1, 2, 5, and 10 Hz. ** represents significant increase in spike rate in ChR2 group [F(1,53) = 9.46, P = 0.003] but no significant effect of stimulation frequency [F(3,53) = 0.74, P = 0.53) or interaction [F(3,53) = 1.13, P = 0.35; two-way ANOVA]. BIC, bicuculline.
Fig. 3.
Fig. 3.
Effects of photoactivation of GAD2LPO neurons during sedation and HSP. (A) Representative frontal EEG spectrogram, hypnogram, peripheral body temperature, EMG, and SWA (EEG power between 0.5 and 4 Hz) color coded according to the state of vigilance, from one representative mouse, before and after Dex injection. Color scale: spectral power in common logarithm values. SWA is color coded according to vigilance state (blue, wake; green, NREM; yellow, REM; purple, sedation). (B) Percentage of time spent awake before, during, and after photostimulation (shaded area) during the first 1-h interval after Dex injection, averaged for LPO (n = 7), non-LPO (n = 6), and GFP (n = 8) animals. Mean values ± SEM. Note how in GFP animals (gray, arrow), the occurrence of wake-like states before or during stimulation was exceptionally rare. (C) Latency to awakening from sedation after the onset of stimulation calculated separately for the initial sedation (average of four stimulation sessions during the first hour after Dex injection) and during late sedation under hypothermia (average of four stimulations delivered between hours 2 to 3 after Dex injection) in LPO and non-LPO animals. Note that the latency to awakening from sedation in GFP is not shown because stimulation did not result in awakenings. Red bar, median; box: ±25/75 percentiles. P value, Welch’s t test. (D) Representative 12-h profile of EEG SWA and EMG variance shown separately for “low” (Top) and “high” (Bottom) sleep pressure conditions. SWA is color coded according to vigilance state (blue, wake; green, NREM; yellow, REM). stim, photostimulation. (E) Mean EEG power spectra during the first 4 h of recovery sleep after SD and the corresponding baseline interval when sleep pressure was low (LSP). Mean values ± SEM. (Inset) Magnified spectra below 5 Hz. The black bar at the bottom of the figure denotes frequency bins in which the difference between LSP and HSP was significant in post hoc uncorrected Fisher’s least significant difference (LSD) tests following a one-way ANOVA (P < 0.05). (F) Percentage of NREM sleep occurrence before, during, and after a 2-min photostimulation (shaded area) during HSP and LSP conditions. Mean values ± SEM. (G) Mean latency to awakening for stimulations delivered during HSP and LSP conditions. Data points represent individual mice, and red bar represents median across mice. ns, no significance in two-sided Wilcoxon signed-rank test. Box, ±25/75 percentiles. No. of animals used in EG: LPO, n = 8.
Fig. 4.
Fig. 4.
Photoactivation induces a rebound of SWA during NREM sleep in GAD2LPO but not in GAD2nonLPO animals. (A) The effect of photostimulation on the total amount of vigilance states during the light period, shown as the percentage change relative to sham stimulation day. Stars above the lines indicate significant differences in RM-ANOVA, and stars and ns above plots indicate significance in t tests against 100%. *P < 0.05; ns, nonsignificant. Mean values ± SEM. (B) Amount of sleep during the 20-min window aligned to stimulation offset shown as percentage relative to the average sleep amount during sham stimulation day. All trials occurring during the light period are averaged for LPO and non-LPO animals. No significant difference was observed in sleep amount between the two groups using a two-way ANOVA (P > 0.1) and a post hoc uncorrected Fisher’s LSD test. Mean values ± SEM. (C) Representative 24-h profile of EEG SWA and EMG in one individual animal that received stimulation to the LPO. SWA is plotted in 4-s resolution and is color coded according to vigilance state (green, NREM; blue, wake; yellow, REM). Note the progressive increase in SWA across the 12-h light period (indicated as a white bar on the top). (D) Relative EEG power density in NREM sleep shown for the 10-Hz 24-h stimulation condition during the light period compared to sham condition. Mean values ± SEM. Black bars at the bottom of the figure denote frequency bins in which the difference between experimental groups was significant (P < 0.05, unpaired t tests). Shaded area denotes the SWA frequency range (0.5 to 4 Hz). (E) Time course of EEG SWA over a 20-min window aligned to stimulation offset (time 0) during the light period. SWA is shown as a percentage of sham stimulation day SWA during the light period. *P < 0.05, **P < 0.01, post hoc uncorrected Fisher’s LSD test following RM-ANOVA. Mean values ± SEM. (F) Time course of EEG SWA during NREM sleep across 24 h on the day with photostimulation. SWA is plotted in 2-h intervals and represented as percentage of average NREM SWA during sham stimulation day (mean values ± SEM; *or #P < 0.05, **P < 0.01, Tukey’s multiple comparisons test after RM-ANOVA). *LPO versus GFP; #LPO versus non-LPO. (G) Cumulative EEG SWE across 24 h. Stars above plots indicate significance in multiple paired t tests. **P < 0.01. Comparison on the slope of SWE in the light period between LPO and non-LPO is shown in SI Appendix, Fig. S5D. Mean values ± SEM. No. of animals in A: LPO, n = 8; non-LPO, n = 6; GFP, n = 8. No. of animals in DF: LPO, n = 8; non-LPO, n = 6; GFP, n = 7.
Fig. 5.
Fig. 5.
Effects of LPO and non-LPO photoactivation on wakefulness and subsequent sleep. (A) Average wake-EEG spectrograms recorded from the occipital derivation of representative mice during spontaneous awakenings on a baseline day and during awakenings induced by photoactivation (Top: LPO, Bottom: non-LPO). Time 0 corresponds to the onset of waking. Color scale: spectral power in common logarithm values. (B) Average EEG spectral power density during photoactivation-induced awakenings expressed as a percentage of power during spontaneous awakenings during baseline. Bars at the bottom indicate significant differences (P < 0.05) in post hoc rank-sum tests following general linear mixed model; black, significant differences between LPO and non-LPO groups; gray, no significant differences between LPO and non-LPO groups but LPO and non-LPO groups combined are significantly different from 100%. Double slash: the cutoff for stimulation-induced artifacts at around 10 Hz and 20 Hz, from the frequency with steep increase in power, until the frequency with steep decrease. (C) Correlation between stimulation-associated differences in wake SWA and NREM SWA (Top) and in wake theta-frequency (6 to 9 Hz) power and NREM SWA (Bottom). R: Pearson’s correlation coefficients, with corresponding P values. Note that only the correlation between wake theta-frequency power and NREM SWA in LPO group is statistically significant. (D) Representative hypnograms illustrating the experimental design for stimulation during SD. (Top) 2-h SD without stimulation (SD only). (Bottom) 2-h SD combined with photostimulation, shown as blue bars “stim.” SWA plotted for 4-s epochs is color coded according to the state of vigilance. y axis in μV2/0.25 Hz. (E) Effect of stimulation during wakefulness on EEG spectra during subsequent NREM sleep. The EEG power after SD + stim is calculated over the first 2 h of recovery sleep and represented as percent of “SD only” condition in the LPO and GFP animals. Bars at the bottom denote frequency bins in which the EEG power was significantly affected by stimulation (P < 0.05, t test); black, significant between GFP and LPO; gray, significant against 100% in LPO. No. of animals used in B and C: LPO, n = 7; non-LPO, n = 6; GFP, n = 6. No. of animals used in D and E: LPO, n = 6; GFP, n = 7.
Fig. 6.
Fig. 6.
Optical inhibition of GAD2LPO neurons does not alter sleep pressure accumulation during SD but increases SWA and SWE when delivered during spontaneous sleep-wake states. (A) Representative histology from an animal with Arch expression in LPO used for optical inhibition. (Top left) Schematics of optical inhibition experiments. (Top right) Schematic of the optic fiber tip locations in all animals with Arch expression. The center of each fiber tip is shown as a dot, and the stimulation coverage areas estimated based on a fiber diameter (400 µm) are shown as circles for individual animals. (Bottom left) DAPI image and corresponding atlas (55) with implant schematics. Dotted square corresponds to the right panels. (Bottom right) fluorescence image of the squared area in the left panel and the corresponding atlas (Bregma = 0.02). Dotted lines depict the lesion from the implanted optic fiber. (B and C) Average 2-h wake spectra during SD + stimulation relative to 2-h SD-only condition for frontal EEG (B) and occipital EEG (C) in Arch and GFP control animals (n = 6 and n = 4, respectively; mean values ± SEM). (D) Effect of stimulation during SD on EEG spectra during subsequent NREM sleep. The EEG power after SD + stimulation is calculated over the first 2 h of recovery sleep and represented as percentage of the SD-only condition. Bars at the bottom denote frequency bins in which the EEG power was significantly affected by stimulation (P < 0.05). (E) Probability of wake, NREM and REM sleep before, during and after 5-min photoinhibition (shown as a green bar and shaded area) shown separately for the GFP controls and Arch group. Note the right end of the green bars reflecting the light ramp down. Mean values ± SEM. (F) The effect of photoinhibition on the total amount of vigilance states during the light period, shown as the percentage change relative to sham stimulation day. ns above lines indicates no difference in unpaired t test. Stars and ns above plots indicate significance levels in one-sample t tests against 100%. *P < 0.05, **P < 0.01. Mean values ± SEM. (G) Average EEG power spectra during NREM sleep on the day with photoinhibition shown as percentage of baseline day. Mean values ± SEM. Bars below the curves depict frequency bins in which EEG power was significantly different between GFP and Arch animals (P < 0.05). (H) Cumulative EEG SWE in NREM sleep across 24 h shown separately for GFP and Arch animals during sham and stim conditions. Stars above plots indicate significance in multiple paired t tests. *P < 0.05, **P < 0.01, ***P < 0.01. Comparison on the slope of SWE in the light period between LPO and non-LPO is shown in SI Appendix, Fig. S9D.

References

    1. Allada R., Siegel J. M., Unearthing the phylogenetic roots of sleep. Curr. Biol. 18, R670–R679 (2008). - PMC - PubMed
    1. Ungurean G., van der Meij J., Rattenborg N. C., Lesku J. A., Evolution and plasticity of sleep. Curr. Opin. Physiol. 15, 111–119 (2020).
    1. Eban-Rothschild A., Appelbaum L., de Lecea L., Neuronal mechanisms for sleep/wake regulation and modulatory drive. Neuropsychopharmacology 43, 937–952 (2018). - PMC - PubMed
    1. Korotkova T., Ponomarenko A., To eat? To sleep? To run? Coordination of innate behaviors by lateral hypothalamus. Neuroforum 23, 45 (2017).
    1. Collins B., et al. , Circadian VIPergic neurons of the suprachiasmatic nuclei sculpt the sleep-wake cycle. Neuron 108, 486–499.e5 (2020). - PMC - PubMed

Publication types