. 2021 Dec 13;11(1):23861.
doi: 10.1038/s41598-021-03234-7.

Artefactual depiction of predator-prey trophic linkages in global soils

Affiliations

Artefactual depiction of predator-prey trophic linkages in global soils

Kris A G Wyckhuys et al. Sci Rep. .

Abstract

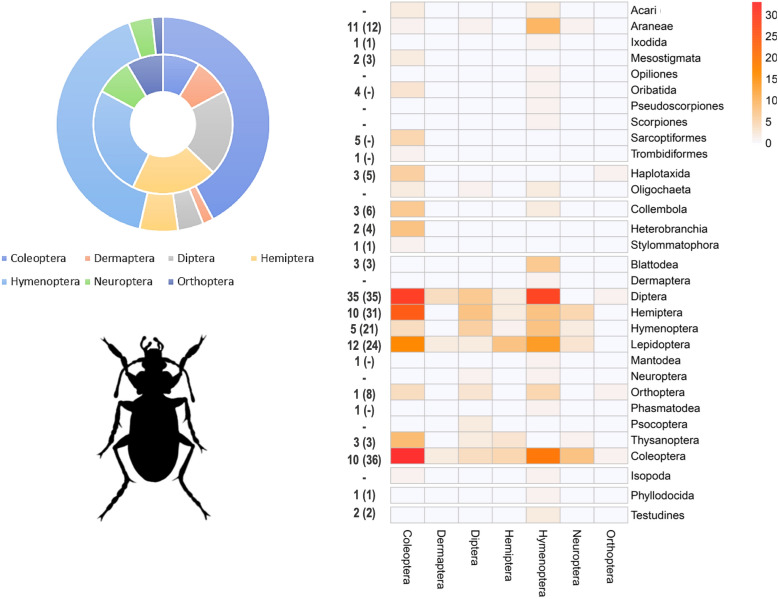
Soil invertebrates contribute to multiple ecosystem services, including pest control, nutrient cycling, and soil structural regulation, yet trophic interactions that determine their diversity and activity in soils remain critically understudied. Here, we systematically review literature (1966-2020) on feeding habits of soil arthropods and macrofauna and summarize empirically studied predator-prey linkages across ecosystem types, geographies and taxa. Out of 522 unique predators and 372 prey organisms (constituting 1947 predator-prey linkages), the vast majority (> 75%) are only covered in a single study. We report a mean of just 3.0 ± 4.7 documented linkages per organism, with pronounced taxonomic biases. In general, model organisms and crop pests (generally Insecta) are well-studied, while important soil-dwelling predators, fungivores and detritivores (e.g., Collembola, Chilopoda and Malacostraca) remain largely ignored. We argue that broader food-web based research approaches, considering multiple linkages per organism and targeting neglected taxa, are needed to inform science-driven management of soil communities and associated ecosystem services.


Conflict of interest statement

The authors declare no competing interests.

Figures

Figure 1
Figure 1
Geographical distribution and key features of scientific studies that either empirically demonstrated (upper panel) or inferred (lower panel) soil-borne trophic linkages. On either world map, red circle sizes are indicative of the number of studies per country. Below each map, bar charts show whether individual studies considered impacts on primary productivity (yes/no; A) or biological control (yes/no; B). Bar charts (C) and (D) cover the targeted habitat type (agriculture, natural, urban, unspecified) and the type of assay (field, laboratory, greenhouse). All bar charts depict the absolute number of publications, within a given sub-set of studies. Maps were created using ArcMap 10.6.1.
Figure 2
Figure 2
Chord diagram representing realized trophic linkages between consumer (predator; top) and resource (prey; bottom) items. Consumer-resource linkages are only visualized at the taxonomic hierarchy of class, and comprise numerous biota ranging from vertebrates (e.g., Aves, Mammalia, Amphibia), crustaceans (Malacostraca) to more common soil meso- and macrofauna. A total of 764 linkages are plotted, solely drawn from the empirical assessments of trophic linkages (n = 495 studies).
Figure 3
Figure 3
Order-level trophic linkages for Insecta consumer species. In the right panel, a heat map depicts the number of realized linkages between different consumer (column) and resource guilds (row). Numbers next to each row indicate the respective number of families and species (between brackets) within a given order of resource species. In the left panel, a donut chart shows the relative number of families (inner circle; total n = 35) and species (outer circle; total n = 310) within the 7 different orders of Insecta consumers.
Figure 4
Figure 4
Order-level trophic linkages for Arachnida consumer species. In the right panel, a heat map depicts the number of realized linkages between different consumer (column) and resource guilds (row). Numbers next to each row indicate the respective number of families and species (between brackets) within a given order of resource species. In the left panel, a donut chart shows the relative number of families (inner circle; total n = 50) and species (outer circle; total n = 97) within the 8 different orders and one sub-class of Arachnida consumers.
Figure 5
Figure 5
Extent of taxonomic mismatch between studies that either infer or empirically demonstrate trophic linkages. Axes reflect how 24 different classes of soil-dwelling animal biota proportionally feature with realized (Y axis) or inferred (X axis) linkages. For each taxon, the proportion of studies that infer its presence in either upper (i.e., predator) or lower (i.e., prey) trophic levels is plotted against the relative number of actual realized trophic linkages (i.e., the latter drawn from empirical assessments of consumer-resource interactions). Selected taxa are indicated: 1 Insecta; 2 Arachnida; 3 Entognatha; 4 Chilopoda; 5 Clitellata; 6 Malacostraca; with the majority of Enthognatha, Clitellata and Malacostraca being Collembola, earthworms and terrestrial Isopoda, respectively. The diagonal line mirrors equal extent of organismal coverage between both types of studies.

References

    1. Wall DH, Bardgett RD, Kelly E. Biodiversity in the dark. Nat. Geosci. 2010;3(5):297–298.
    1. Eisenhauer N, Bonn A, Guerra CA. Recognizing the quiet extinction of invertebrates. Nat. Commun. 2019;10(1):1–3. - PMC - PubMed
    1. Koch A, McBratney A, Adams M, Field D, Hill R, Crawford J, Minasny B, Lal R, Abbott L, O'Donnell A, Angers D. Soil security: Solving the global soil crisis. Global Pol. 2013;4(4):434–441.
    1. Wall DH, Nielsen UN, Six J. Soil biodiversity and human health. Nature. 2015;528(7580):69–76. - PubMed
    1. Guerra CA, Heintz-Buschart A, Sikorski J, Chatzinotas A, Guerrero-Ramírez N, Cesarz S, Beaumelle L, Rillig MC, Maestre FT, Delgado-Baquerizo M, Buscot F, et al. Blind spots in global soil biodiversity and ecosystem function research. Nat. Commun. 2020;11(1):1–13. - PMC - PubMed

Publication types