. 2021 Dec;3(12):1648-1661.
doi: 10.1038/s42255-021-00489-2. Epub 2021 Dec 13.

Peroxisomal β-oxidation acts as a sensor for intracellular fatty acids and regulates lipolysis

Affiliations

Peroxisomal β-oxidation acts as a sensor for intracellular fatty acids and regulates lipolysis

Lianggong Ding et al. Nat Metab. 2021 Dec.

Abstract

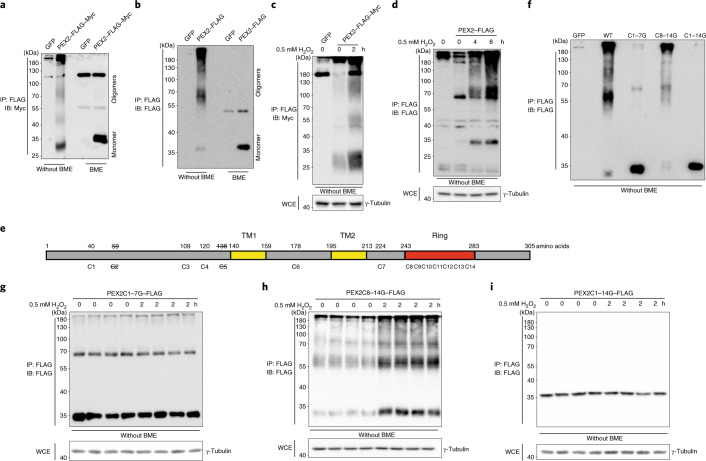
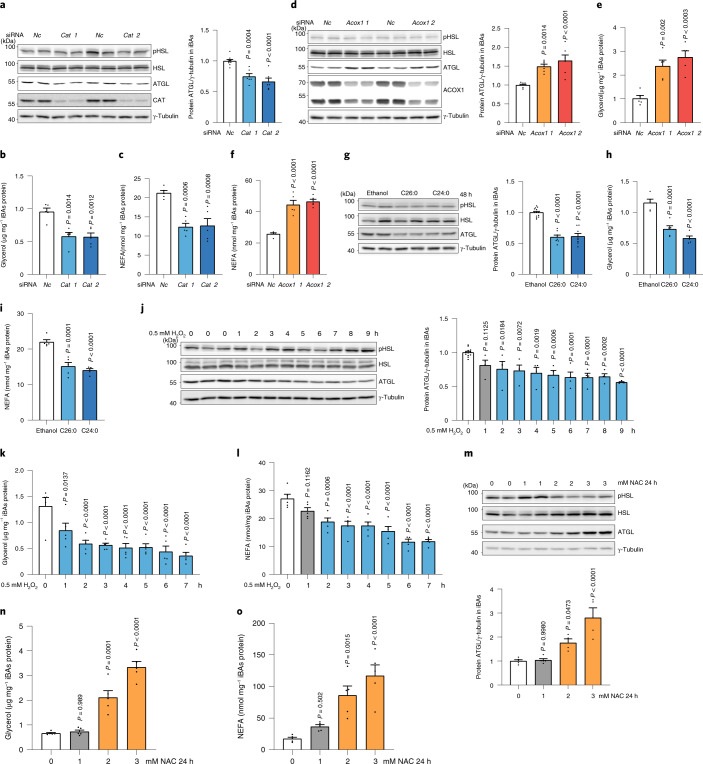
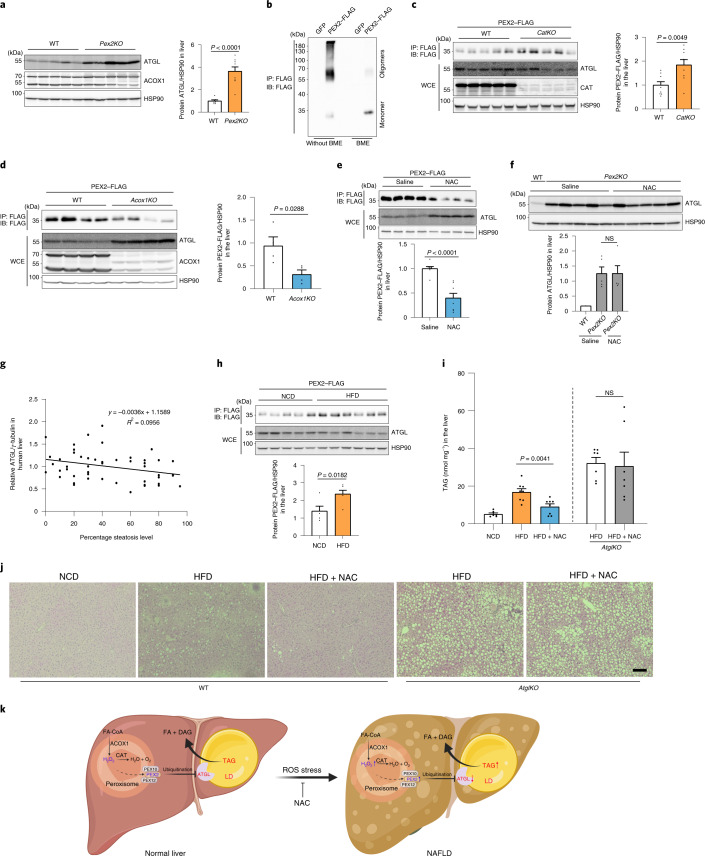
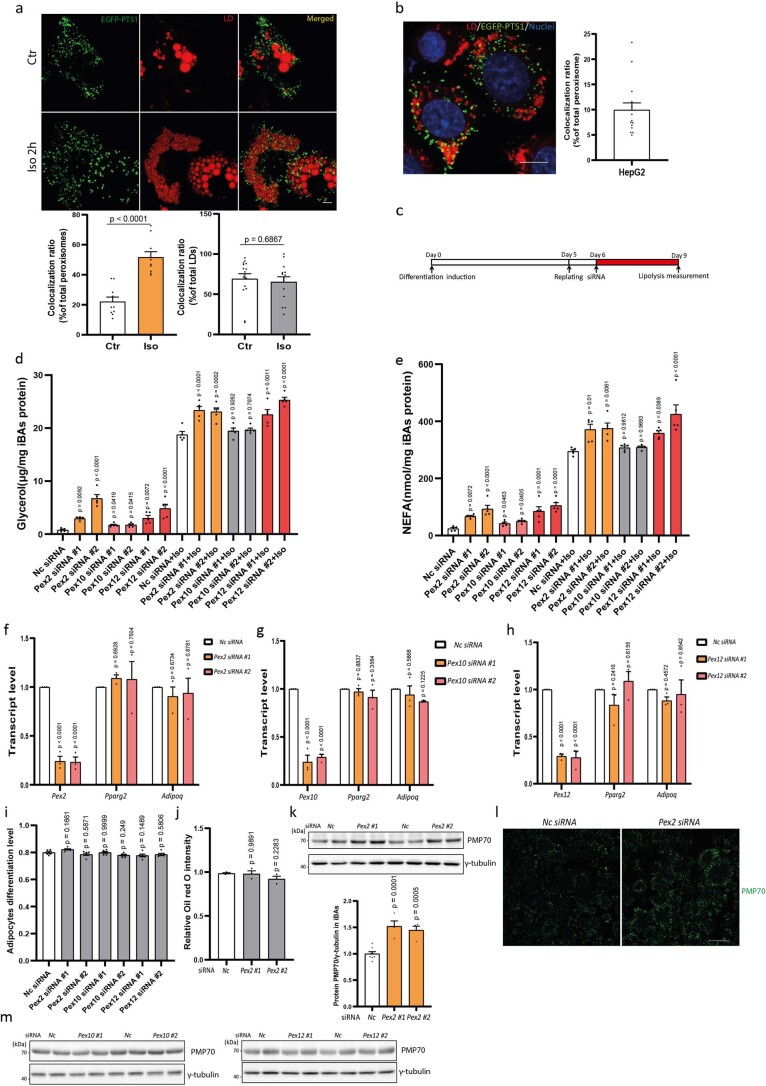
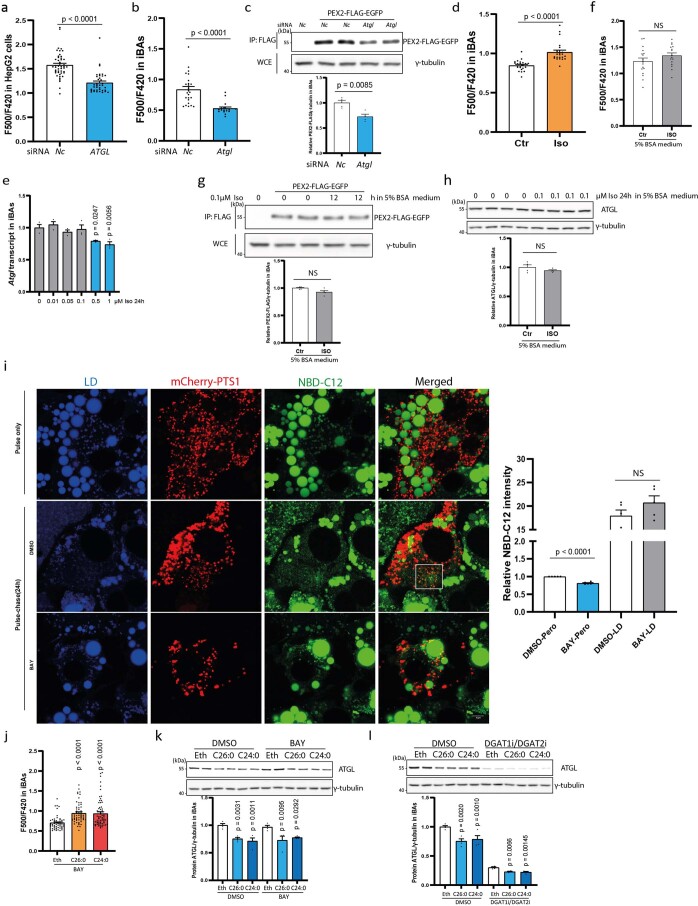
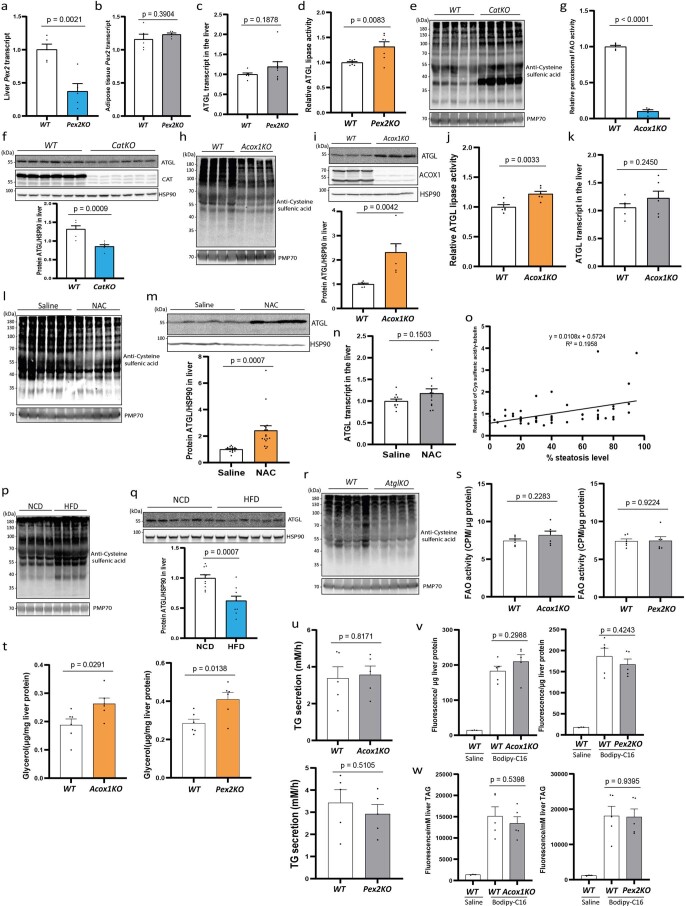
To liberate fatty acids (FAs) from intracellular stores, lipolysis is regulated by the activity of the lipases adipose triglyceride lipase (ATGL), hormone-sensitive lipase and monoacylglycerol lipase. Excessive FA release as a result of uncontrolled lipolysis results in lipotoxicity, which can in turn promote the progression of metabolic disorders. However, whether cells can directly sense FAs to maintain cellular lipid homeostasis is unknown. Here we report a sensing mechanism for cellular FAs based on peroxisomal degradation of FAs and coupled with reactive oxygen species (ROS) production, which in turn regulates FA release by modulating lipolysis. Changes in ROS levels are sensed by PEX2, which modulates ATGL levels through post-translational ubiquitination. We demonstrate the importance of this pathway for non-alcoholic fatty liver disease progression using genetic and pharmacological approaches to alter ROS levels in vivo, which can be utilized to increase hepatic ATGL levels and ameliorate hepatic steatosis. The discovery of this peroxisomal β-oxidation-mediated feedback mechanism, which is conserved in multiple organs, couples the functions of peroxisomes and lipid droplets and might serve as a new way to manipulate lipolysis to treat metabolic disorders.


Conflict of interest statement

The authors declare no competing interests.

Figures

Fig. 1
Fig. 1. PEX2 downregulation increases iBA lipolysis and ATGL protein levels in various cell types via reduced poly-ubiquitination.
a,b, Levels of glycerol and NEFAs in starvation medium released by iBAs in basal state (n = 4; F = 6.491 (a) and 6.884 (b)). c, IB of HSLSer660ph, HSL, ATGL, CGI-58, PLIN1 and γ-tubulin in iBAs 72 h after Pex2 knockdown (n = 6 in Pex2 and 12 in Nc siRNA, F = 27.6). d, Representative immunofluorescence (IF) result of ATGL in iBAs 72 h after Pex2 knockdown. ATGL in red, LDs in green and nuclei in blue. Scale bar, 20 μm. Experiments were repeated four times. e, IB of ATGL and γ-tubulin in HepG2 cells 48 h after PEX2 knockdown (n = 6 in Pex2 and 10 in Nc siRNA, F = 23.94). f,g, IB of endogenous ATGL or ectopically expressed ATGL–FLAG and γ-tubulin in HEK293T cells 48 h after PEX2 knockdown (n = 6 in Pex2 and 12 in Nc siRNA; F = 17.66 (f) and 20.9 (g)). Results are shown as the mean ± s.e.m. and analysed using ANOVA with Dunnett correction for multiple comparisons between control and other groups. Statistical differences are indicated by exact P values. Source data
Fig. 2
Fig. 2. PEX2 modulates ATGL protein levels via K48-linkage poly-ubiquitination.
a, Co-IP conducted in HEK293T whole cell extract (WCE) via FLAG antibody 48 h after expressing PEX2–FLAG. Co-IP was analysed by IB using the indicated antibodies. Experiments were repeated three times. b, Representative images of wild-type ATGL–EGFP, ATGLΔHD–EGFP and ATGL3KR–EGFP distribution in HEK293T cells treated with 400 μM oleic acid (OA). LDs were stained by LipidTOX Deep Red dye and nuclei were stained by 4,6-diamidino-2-phenylindole (DAPI) (blue). Scale bar, 10 μm. Experiments were repeated three times. c,d, IB of ectopically expressed ATGL3KR–EGFP and ATGLΔHD–EGFP in HEK293T cells 48 h after PEX2 siRNA transfection (n = 8 in PEX2 and 16 in Nc siRNA, F = 3.644 (c); n = 4 in PEX2 and 8 in Nc siRNA, F = 52.67 (d)). e, HEK293T cells were co-transfected by plasmids to express ATGL–FLAG and HA–Ub, followed by siRNA transfection. After 48 h, IP and IB were conducted to detect the ubiquitination pattern. Experiments were repeated three times. f, HEK293T cells were transfected by the ATGL–FLAG plasmid, followed by IP to enrich ATGL–FLAG for poly-ubiquitination type analysis via K48- or K63-linkage poly-ubiquitination antibodies. Experiments were repeated three times. g,h, HEK293T cells were transfected by ATGL–FLAG (g) and ATGLK92–FLAG (h) plasmids, followed by siRNA transfection. After 48 h, IP was conducted to enrich ATGL–FLAG or ATGLK92–FLAG for K48-linkage poly-ubiquitination pattern detection. Experiments were repeated three times. Results are shown as the mean ± s.e.m. and analysed using ANOVA with Dunnett correction for multiple comparisons between control and other groups. Source data
Fig. 3
Fig. 3. Peroxisomal β-oxidation-derived ROS regulate PEX2 protein levels.
a,b, HepG2 cells with PEX2–FLAG expression were transfected with CAT or ACOX1 siRNAs. After 48 h, IP and IB were conducted using the indicated antibodies (n = 4 in CAT or ACOX1 and 8 in Nc siRNA, F = 19.79 (a) and 29.46 (b)). c,d, HepG2 cells with PEX2–FLAG expression were treated with H2O2 or NAC and collected at the indicated time points. IP and IB were conducted using the indicated antibodies (n = 3, F = 35.28 (c); n = 4, F = 6.717 (d)). e,f, iBAs with PEX2–FLAG–EGFP expression were transfected with Cat or Acox1 siRNAs. After 72 h, IP and IB were conducted using the indicated antibodies (n = 5, F = 9.417 (e); n = 4, F = 19.9 (f)). g, iBAs with PEX2–FLAG–EGFP expression were treated with 0.5 mM H2O2 and collected at the indicated time points. IB was conducted to analyse protein levels using the indicated antibodies (n = 4 in H2O2 treatment and 10 in control, F = 10.12). h, iBAs with PEX2–FLAG–EGFP expression were treated with NAC at different doses for 24 h. IP and IB were conducted using the indicated antibodies (n = 5, F = 15.87). i, PEX2–FLAG was overexpressed in HEK293T cells by transient transfection. After 48 h, HEK293T cells were treated with 0.5 mM H2O2 and collected at the indicated time points. IB was conducted to check protein levels using the indicated antibodies (n = 5, F = 5.329). j, iBAs with PEX2–FLAG–EGFP expression were treated with 100 μM of hexacosanoic acid (C26:0) and lignoceric acid (C24:0) for 48 h. IP and IB were conducted using the indicated antibodies (n = 4, F = 19.54). Results are shown as the mean ± s.e.m. and analysed using ANOVA with Dunnett correction for multiple comparisons between control and other groups. Source data
Fig. 4
Fig. 4. ROS regulates PEX2 protein levels via disulfide bond-mediated stabilization.
a,b, HEK293T cells expressing PEX2–FLAG–Myc or iBAs expressing PEX2–FLAG were collected for IP to enrich PEX2 protein. PEX2 was eluted by Laemmli buffer with or without BME and analysed through IB via the indicated antibodies. Experiments were repeated four times. c,d, PEX2–FLAG–Myc-expressing HEK293T cells and PEX2–FLAG-expressing iBAs were treated with 0.5 mM H2O2 at different time points. IP and IB were conducted to check protein levels using the indicated antibodies at the non-reducing condition. Experiments were repeated three times. e, Human PEX2 scheme illustrating the position of 14 cysteines. Cysteines 1 to 7 are outside the RING domain, whereas cysteines 8 to 14 are inside the RING domain. PEX2 also contains two transmembrane motifs (TMs). Cysteines with a strikethrough do not exist in the murine PEX2. f, HEK293T cells were transiently transfected by plasmids to overexpress different PEX2 mutants. IP and IB were conducted at the non-reducing condition. Experiments were repeated three times. gi, PEX2 mutants were overexpressed in HEK293T cells. After 48 h, cells were collected after 0.5 mM H2O2 treatment for 2 h. PEX2 mutants were enriched through IP for IB using the indicated antibodies. Experiments were repeated four times. Source data
Fig. 5
Fig. 5. Peroxisomal β-oxidation-derived ROS regulate ATGL protein and lipolysis in iBAs.
ac, iBAs were transfected with Cat siRNA. After 72 h, IB, glycerol and NEFA measurement were conducted to check lipolytic proteins or lipolysis levels (n = 6 in Cat and 10 in Nc siRNA, F = 22 (a); n = 5, F = 13.74 (b) and 16.12 (c)). df, iBAs were transfected with Acox1 siRNA. After 72 h, IB, glycerol and NEFA measurements were conducted to check lipolytic proteins or lipolysis levels (n = 6 in Acox1 and 8 in Nc siRNA, F = 16.74 (d); n = 5, F = 16.6 (e) and 35.79 (f)). gi, iBAs were treated with 100 μM C26:0 and C24:0 for 48 h. IB, glycerol and NEFA measurements were conducted to check lipolytic proteins or lipolysis levels (n = 8 in VLCFAs treatment and 13 in control, F = 60.22 (g); n = 5, F = 34.4 (h) and 29.5 (i)). jl, iBAs were treated with 500 μM H2O2 at the indicated time points. IB, glycerol and NEFA measurements were conducted to check lipolytic proteins or lipolysis levels (n = 4 in H2O2 treatment and 12 in control, F = 7.451 (j); n = 5, F = 9.331 (k) and 15.92 (l)). mo, iBAs were treated with 1 mM, 2 mM and 3 mM NAC for 24 h. IB, glycerol and NEFA measurements were conducted to check lipolytic proteins or lipolysis levels (n = 4 in 2 mM and 3 mM NAC treatment and 5 in 0 mM and 1 mM NAC treatment, F = 17.13 (m); n = 5, F = 48.29 (n) and 16.28 (o)). Results are shown as the mean ± s.e.m. and analysed using ANOVA with Dunnett correction for multiple comparisons between control and other groups. Source data
Fig. 6
Fig. 6. ATGL levels are regulated by ROS in HepG2 cells and repressed by overloaded FAs.
a,b, HepG2 cells were transfected with CAT or ACOX1 siRNA. After 48 h, IB was conducted to analyse protein levels using the indicated antibodies (n = 6 in CAT and 12 in Nc siRNA, F = 30.1 (a); n = 5 in ACOX1 and 8 in Nc siRNA, F = 20.62 (b)). c,d, HepG2 cells were treated with H2O2 or NAC and collected at the indicated time points. IB was conducted to analyse protein levels using the indicated antibodies (n = 4 in H2O2 treatment and 9 in control, F = 9.689 (c); n = 5 in 6 mM and 7 mM NAC, 6 in 5 mM and 8 mM NAC and 9 in control, F = 47.12 (d)). e, iBAs with PEX2–FLAG–EGFP expression were treated with 0.1 μM Iso and collected at the indicated time points. IP and IB were conducted using the indicated antibodies (n = 4, F = 11.01). f, iBAs were transfected with Nc and Pex2 siRNA. After 48 h, cells were stimulated with 0.1 μM Iso for 24 h at the indicated doses. IB was conducted to check protein levels using the indicated antibodies (n = 4). gi, iBAs were treated with 100 μM of various FAs. After 48 h, cells were collected for IB analysis or lipolysis measurement was performed (n = 5, F = 14.35 (g), 16.51 (h) and 7.892 (i)). Results are shown as the mean ± s.e.m. and analysed using a two-sided Student’s t-test (f) or ANOVA with Dunnett correction for multiple comparisons between control and other groups (ae,gi). Source data
Fig. 7
Fig. 7. Functions of peroxisomal β-oxidation and ROS in regulating ATGL levels and TAG mobilization in the liver.
a, Two weeks after Pex2 knockout induction, livers were collected and hepatic proteins were analyzed by IB, as indicated (wild-type n = 7; Pex2KO n = 9). b, PEX2–FLAG was expressed for 2 weeks before liver collection and homogenization. IP and IB were conducted using the indicated antibodies. Experiments were repeated four times. c,d, PEX2–FLAG was expressed in the liver of CatKO or Acox1KO mice. IP and IB were conducted using the indicated antibodies (n = 9 (c); n = 4 (d)). e, PEX2–FLAG was expressed in the liver of wild-type mice. After 2 weeks, NAC was administered to the mice via intraperitoneal injection at a dose of 500 mg kg−1 body weight for 24 h. IP and IB were conducted using the indicated antibodies (n = 8). f, NAC was administered to the Pex2KO KO mice for 24 h. Livers were collected and hepatic proteins were analysed by IB (n = 5 for Pex2KO for both conditions). g, ATGL levels in human liver biopsies were analysed by IB and the relative ATGL levels are presented (50 human samples). P = 0.0372 using a Spearman test. h, Wild-type mice with PEX2–FLAG expression in the liver were challenged with HFD for 16 weeks. IP and IB were conducted using the indicated antibodies (n = 5). i, Wild-type and AtglKO mice were fed with NCD, HFD and HFD plus NAC (40 mM) in drinking water for 8 weeks. Liver lipids were extracted for TAG level determination (for wild-type mice, NCD n = 6, HFD n = 7, HFD + NAC n = 7; for AtglKO mice, n = 7). NCD, normal chow diet. j, Representative hematoxylin and eosin staining images of livers from wild-type or AtglKO mice fed on HFD and NAC-containing water for 8 weeks. Scale bar, 100 μm. Experiments were repeated three times. k, Working model illustrating the whole pathway in which peroxisomal β-oxidation generates H2O2 to stabilize PEX2 protein, resulting in increased ATGL degradation and decreased lipolysis in turn. Results are shown as the mean ± s.e.m. analysed using a two-sided Student’s t-test. Source data
Extended Data Fig. 1
Extended Data Fig. 1. PEX2/10/12 downregulation increases iBAs lipolysis without effects on differentiation levels.
(a) Quantification of peroxisomes in the proximity to LDs and LDs in proximity to peroxisomes in iBAs at basal state and stimulated state (peroxisome quantification, cell number = 10; LD quantification, cell number = 14 in control and 15 in Iso treatment). LD labelled by LipidTOX Deep Red dye (red) and peroxisomes labelled by EGFP-PTS1 (green). Scale bar, 5 μm. (b) Quantification of peroxisomes in the proximity to LDs in HepG2 cells (Cell number = 15). LD labelled by LipidTOX Deep Red dye (red) and peroxisomes labelled by EGFP-PTS1 (green). Scale bar, 10 μm. (c) Differentiation and screening strategy in iBAs. A pool of three different duplexes was utilized to knock down individual PEX target. (d-e) IBAs were transfected with siRNAs to knock down Pex2/10/12. After 72 h, lipolysis was determined as level of glycerol and NEFA released into starvation medium during 2 hours at basal state and 1 hour at stimulated state induced by 1 μM Iso (N = 5, F = 21.58 in basal state and 15.38 in stimulated state in d; F = 11.81 in basal state and 8.797 in stimulated state in e). (f-h) IBAs were transfected with siRNAs to knock down Pex2/10/12. After 72 h, Pex2/Pex10/Pex12, Pparg2 and Adipoq transcripts were quantified by qPCR (N = 3). (i) IBAs were transfected with siRNAs to knock down Pex2/10/12. After 72 h, levels of adipocyte differentiation were determined via high-content imaging (N = 6, F = 4.51). (j) IBAs were transfected with siRNAs to knock down Pex2/10/12. After 72 h, cells were stained by Oil Red O and the latter was extracted by isopropanol for quantification (N = 3, F = 1.816). (k-l) IBAs were transfected with siRNAs to knock down Pex2. After 72 h, peroxisome mass was analyzed by IB or IF via peroxisomal membrane protein PMP70 (N = 4 in Pex2 and 8 in Nc siRNA, F = 22.61). Scale bar, 40 μm. Repeated 3 times in l. (m) IBAs were transfected with siRNAs to knock down Pex10/12. After 72 h, peroxisome mass was analyzed by IB as indicated. Repeated 3 times. Results are shown as mean ± SEM and analyzed using Student’s two-sided t test (a) and an ANOVA test with Dunnett correction for multiple comparisons between control and other groups (d-k). Source data
Extended Data Fig. 2
Extended Data Fig. 2. PEX2/10/12 downregulation increases ATGL protein levels independently of transcription modulation.
(a-b) IB of endogenous HSLSer660ph, HSL, ATGL, CGI-58, PLIN1 and γ-tubulin in iBAs 72 h after knockdown of Pex10/12 (N = 6 in Pex10/12 and 12 in Nc siRNA, F = 36.91 in a and 42.4 in b). (c) Representative IF of ATGL in iBAs 72 h after knockdown of Pex10/12. ATGL in red, LDs in green and nuclei in blue. Scale bar, 20 μm. Repeated 4 times. (d) IBAs were transfected with siRNAs to knock down Pex2. After 72 h, ATGL lipase activity assay was conducted using the WCE (N = 4). (e) IBAs were transfected with siRNAs to knock down Pex2/10/12. After 72 h, qPCR was conducted to check Atgl transcript (N = 4 in Pex2/10/12 and 5 in Nc siRNA, F = 3.853). (f) IBAs were transfected with Pex5 and Pex19 siRNAs. After 72 h, IB was conducted to check protein levels by indicated antibodies. (g) Human PEX2 knockdown efficiency was validated by qPCR 48 h after HepG2 cells were transfected with PEX2 siRNAs (N = 3, F = 94.61). (h-i) HepG2 cells were transfected with PEX10/12 siRNAs for human PEX10 and PEX12 antibodies validation by IB (N = 4). (j) IB of ATGL and γ-tubulin in HepG2 cells 48 h after knockdown of PEX10/12 (N = 6 in PEX10/12 and 12 in Nc siRNA, F = 26.32). (k) HepG2 cells were transfected with PEX5 and PEX19 siRNAs. After 72 h, IB was conducted to check protein levels by indicated antibodies. (l) HepG2 cells were transfected with siRNAs to knock down PEX2/10/12. After 48 h, qPCR was conducted to quantify ATGL transcript (N = 3, F = 0.1052). (m) IB of ATGL and γ-tubulin in HEK293T cells 48 h after knockdown of PEX10/12 (N = 4 in PEX10/12 and 6 in Nc siRNA, F = 0.3977). (n) IB of ectopically expressed ATGL-FLAG and γ-tubulin in HEK293T cells 48 h after knockdown of PEX10/12 (N = 4 in PEX10/12 and 8 in Nc siRNA, F = 0.6143). (o) PEX2/10/12 knockdown efficiency was determined by qPCR 48 h after transfecting HEK293T cells by siRNAs (N = 3). (p) HEK293T cells were transfected with siRNAs to knock down PEX2. After 72 h, cells were fixed for LDs staining. LDs are marked in green and nuclei in blue. Scale bar, 20 μm. Repeated 4 times. Results are shown as mean ± SEM and analyzed using Student’s two-sided t test (d, h, i) and an ANOVA test with Dunnett correction for multiple comparisons between control and other groups (a, b, e, g, j-o). Source data
Extended Data Fig. 3
Extended Data Fig. 3. PEX2 and ATGL proteins interact physically.
(a) Co-IP conducted in HEK293T WCE via FLAG antibody 48 h after expressing PEX2-FLAG. Co-IP was analyzed by IB using indicated antibodies. Repeated 3 times. (b) Co-IP conducted in HEK293T WCE via FLAG antibody 48 h after expressing indicated constructs. Co-IP was analyzed by IB using indicated antibodies. Repeated 3 times. (c) Direct interaction of ATGL and PEX2 in PEX2-FLAG-EGFP expressing iBAs was checked via proximity ligation assay (PLA) at different conditions. Upper panel represents the PEX2 and ATGL interaction. Lower panel is the nuclei (blue) merged with interaction intensity between PEX2 and ATGL. Repeated 3 times. (d) Positions of lysine residues and hydrophobic domain (HD) in human ATGL protein. Three lysine residues with strikethrough are not conserved in murine ATGL. Source data
Extended Data Fig. 4
Extended Data Fig. 4. PEX2 ubiquitinates ATGL via K48-linkage poly-ubiquitination to promote its degradation in HEK293T cells.
(a) ATGL lysine-only mutants were overexpressed in HEK293T cells. After 36 h, cells were treated by 10 μM MG132 for 8 h. IB was conducted to analyze protein levels after blocking proteasome dependent degradation. Repeated 2 times. (b) ATGL lysine-only mutants were overexpressed in HEK293T cells, followed by PEX2 siRNA transfection. After 48 h, IB was conducted to determine protein levels. Repeated 2 times. (c) HEK293T cells were transfected by ATGLK0-FLAG or ATGLK92-FLAG plasmids, followed by siRNA transfection for 48 h. IB was conducted to analyze protein levels of ATGLK0-FLAG and ATGLK92-FLAG (ATGLK0-FLAG, N = 4 in PEX2 and 8 in Nc siRNA, F = 0.9678; ATGLK92-FLAG, N = 5 in PEX2 and 10 in Nc siRNA, F = 15.26). (d) ATGL ubiquitination was analyzed via IP and IB after stimulating ATGL-FLAG expressing iBAs with Iso. Repeated 3 times. (e) IBAs were fractionated to collect different fractions for protein analysis using indicated antibodies. Repeated 3 times. (f) ATGL-FLAG expressing iBAs were fractionated to collect LDs for IP and IB by indicated antibody. The K48-linkage poly-ubiquitination level of LD associated ATGL was analyzed from iBAs at both basal state and activated state induced by 1 μM Iso. Repeated 3 times. (g) ATGL-FLAG expressing iBAs were fractionated to collect cytosol fraction for IP and IB by indicated antibody. Repeated 3 times. (h) HEK293T cells were transfected by ADRP-EGFP plasmid, followed by PEX2 siRNA transfection. After 48 h, IP and IB were conducted by indicated antibody to check K48-linkage poly-ubiquitination level. Repeated 3 times. Results are shown as mean ± SEM and analyzed using an ANOVA test with Dunnett correction for multiple comparisons between control and other groups. Source data
Extended Data Fig. 5
Extended Data Fig. 5. ROS regulates PEX2 protein levels.
(a) Colocalization analysis of HyPer3-PTS1 with peroxisome marker (PMP70) and LDs in iBAs. Scale bar, 10 μm. Repeated 3 times. (b) Peroxisomal H2O2 levels were measured in HepG2 cells 48 h after CAT and ACOX1 siRNA transfection via HyPer3-PTS1 (Cell number = 20, F = 27.56). (c) Peroxisomes were extracted from HepG2 cells after ACOX1 protein depletion to measure peroxisomal fatty acid oxidation activity (N = 4). (d) Peroxisomal H2O2 levels were measured in HepG2 cells 24 h after NAC treatment or 30 min upon H2O2 addition via HyPer3-PTS1 (Cell number = 23, F = 121.4). (e-f) HepG2 cells were treated with 1 mM H2O2 and harvested at indicated time points. IP and IB were conducted with indicated antibodies. Repeated 3 times. (g) Peroxisomal H2O2 levels were measured in iBAs cells after Cat and Acox1 siRNAs transfection via HyPer3-PTS1 (Cell number = 18 in Acox1 and 29 in Cat&Nc siRNA, F = 78.36). (h) Peroxisomes were extracted from iBAs after ACOX1 protein depletion to measure peroxisomal fatty acid oxidation activity (N = 4). (i-j) Peroxisomal H2O2 levels were measured in iBAs via HyPer3-PTS1 sensor after 0.5 mM H2O2, 100 μM C26:0, 100 μM C24:0 and 3 mM NAC treatment (i, cell number = 15 in H2O2 treatment and 23 in control; j, cell number = 24, F = 93). (k) HEK293T cells were transfected with plasmids to overexpress PEX2-FLAG, PEX10-HA and PEX12-HA. After 48 h, cells were treated by 0.5 mM H2O2 and harvested at indicated time points for IB via indicated antibodies. Repeated 3 times. (l-m) IBAs were treated with 0.5 mM H2O2 at indicated time points. Peroxisome mass was analyzed by IB or IF via PMP70. Scale bar, 40 μm. Repeated 3 times. (n) HEK293T cells were transfected with PEX2-FLAG plasmid. After 48 h, cells were treated by 0.5 mM H2O2 in the presence of 100 μg/ml CHX to check PEX2 degradation rate via IB. Repeated 3 times. Results are shown as mean ± SEM and analyzed using Student’s two-sided t test (c, h, i) and ANOVA test with Dunnett correction for multiple comparisons between control and other groups (b, d, g, j). Source data
Extended Data Fig. 6
Extended Data Fig. 6. ROS promotes PEX2 stability via disulfide bonds.
(a) IBAs expressing PEX2-FLAG-EGFP were collected for IP and IB by indicated antibodies. Repeated 3 times. (b) Human PEX2 was overexpressed in HEK293T cells. After treatment by 10 μM MG132 for 6 h, IP and IB were conducted to analyze PEX2 oligomerization pattern by indicated antibodies. Repeated 3 times. (c) Single cysteine to glycine mutants of human PEX2 were overexpressed in HEK293T cells. IP and IB were conducted to analyze their oligomerization patterns by indicated antibodies. Repeated 2 times. (d) Single cysteine to glycine mutants of human PEX2 were overexpressed in HEK293T cells. Cells were treated with 0.5 mM H2O2 for 2 h. IP and IB were conducted to analyze PEX2-FLAG-Myc protein by indicated antibodies. Repeated 2 times. (e-f) Wild type PEX2 or PEX2 mutants (siRNA resistant) were overexpressed in HEK293T cells or co-expressed with ATGL-FLAG, followed by siRNAs transfection. IP and IB were conducted using the indicated antibodies. Repeated 3 times. (g) PEX2 and PEX2C1-7G mutant were overexpressed in HEK293T cells, followed by 0.5 mM H2O2 treatment for 2 h. IP and IB were conducted to check K48-linkage poly-ubiquitination level. Repeated 3 times. (h-i) IBAs were transfected with Cop1 siRNAs or treated by 0.5 mM H2O2 and harvested at the indicated time points. IB was conducted using the indicated antibodies (h, N = 4 in Cop1 and 10 in Nc siRNA, F = 2.544; i, N = 3 in H2O2 treatment and 9 in control, F = 0.9765). Results are shown as mean ± SEM and analyzed using an ANOVA test with Dunnett correction for multiple comparisons between control and other groups. Source data
Extended Data Fig. 7
Extended Data Fig. 7. Peroxisomal β-oxidation and ROS levels regulate ATGL levels and lipolysis.
(a) 72 h after knocking down Cat and Acox1 in iBAs, ATGL lipase activity assays were conducted using the WCE (N = 4, F = 70.21). (b) IBAs were treated with 0.5 mM H2O2 for 9 h or 2 mM NAC for 24 h. ATGL lipase activity assays were conducted using the WCE (N = 4, F = 43.33). (c-g) IBAs were transfected with Nc and Pex2 siRNAs. Under this background, cells were treated with Cat siRNA, Acox1 siRNA, 100 μM C26:0 and C24:0, 0.5 mM H2O2 or 2 mM NAC, as indicated. IB was conducted to check protein levels by indicated antibodies (f, N = 3 in H2O2 treatment and 6 in control; N = 4 in c, d, e, g; F = 13.29 in Nc and 0.08457 in Pex2 siRNA in c; F = 119.5 in Nc and 0.06723 in Pex2 siRNA in d; F = 16.26 in Nc and 0.214 in Pex2 siRNA in e). (h) PEX2-FLAG and ATGL-FLAG were co-transfected in HEK293T cells. After 48 h, cells were treated by 0.5 mM H2O2 and harvested at indicated time points. IB was conducted by indicated antibodies. Repeated 3 times. (i) Wild type PEX2 and PEX2C1-7G (siRNA resistant) were expressed in HEK293T cell under the background of endogenous PEX2 depletion. After 48 h, cells were treated by 0.5 mM H2O2 and harvested at indicated time points. IB was conducted by indicated antibodies. Repeated 3 times. (j) IBAs were transfected with Cpt1b and Cpt2 siRNAs to inhibit mitochondrial fatty acid oxidation. After 72 h, IB was conducted to check protein levels by indicated antibodies (N = 4 in Cpt1b&Cpt2 and 8 in Nc siRNA, F = 0.125). (k) IBAs were treated with mitochondrial fatty acid oxidation inhibitor etomoxir (ETO) at indicated time points. IB was conducted to check protein levels by indicated antibodies (N = 3 in ETO treatment and 9 in control, F = 1.016). (l) HepG2 cells were transfected with CPT1A and CPT2 siRNAs to inhibit mitochondrial fatty acid oxidation. After 72 h, IB was conducted to check protein levels by indicated antibodies (N = 4 in CPT1A&CPT2 and 8 in Nc siRNA, F = 0.3906). (m) HepG2 cells were treated with mitochondrial fatty acid oxidation inhibitor ETO at indicated time points. IB was conducted to check protein levels by indicated antibodies (N = 3 in ETO treatment and 9 in control, F = 0.3629). (n) IBAs were treated with mitochondria targeted antioxidant MitoQ at indicated doses for 24 h. IB was conducted to check protein levels by indicated antibodies (N = 4, F = 0.7356). Results are shown as mean ± SEM and analyzed using Student’s two-sided t test (g) and ANOVA method with Dunnett correction for multiple comparisons between control and other groups (a-f, j-n). Source data
Extended Data Fig. 8
Extended Data Fig. 8. Lipolysis provides substrates for peroxisomal β-oxidation.
(a-b) Peroxisomal H2O2 levels in HepG2 cells and differentiated iBAs were quantified by HyPer3-PTS1 after ATGL depletion by siRNA (a, cell number = 37 in ATGL and 47 in Nc siRNA; b, cell number = 18 in Atgl and 25 in Nc siRNA). (c) IBAs with PEX2-FLAG-EGFP expression were treated with Atgl siRNA and harvested 72 hours after transfection. IP and IB were conducted using the indicated antibodies (N = 4). (d) Peroxisomal H2O2 levels in differentiated iBAs were quantified by HyPer3-PTS1 6 hours after Iso treatment (cell number = 22). (e) IBAs were stimulated with Iso for 24 h at indicated doses. Atgl transcript was quantified by qPCR (N = 4, F = 7.57). (f) Peroxisomal H2O2 levels in differentiated iBAs were quantified by HyPer3-PTS1 6 hours after Iso treatment in the presence of 5% BSA (cell number = 16 in Iso treatment and 17 in control). (g) IBAs with PEX2-FLAG-EGFP expression were treated with 0.1 μM Iso in the presence of 5% BSA and harvested at the indicated time points. IP and IB were conducted using the indicated antibodies (N = 4). (h) IBAs were treated with 0.1 μM Iso in the presence of 5% BSA and harvested at indicated time points. IB were conducted using the indicated antibodies (N = 4). (i) Pulse-chase experiments to monitor NBD-C12 (green) trafficking from LD to peroxisome in iBAs. IBAs transfected with mCherry-PTS1 were pulsed with 10 μM NBD-C12 for 24 h, followed by lipolysis inhibitor treatment (BAY) after washing. 24 h later, cells were fixed for imaging or collected for fractionation and fluorescence measurement (N = 5). LDs were labelled by LipidTOX Deep Red dye. Scale bar, 5μm. Repeated 3 times. (j-l) IBAs were treated by 100 μM C26:0 and C24:0 for 48 h in the presence of lipolysis inhibitor (BAY) or DGAT1/2 inhibitors. Peroxisomal ROS levels were measured (cell number = 58, F = 15.71) or IB was conducted to check protein levels by indicated antibodies (N = 4; F = 15.59 in DMSO and 7.561 in BAY treatment of k; F = 16.68 in DMSO and 9.005 in DGAT1/2i treatment of l). Results are shown as mean ± SEM and analyzed using Student’s two-sided t test (a-d, f-i) or an ANOVA test with Dunnett correction for multiple comparisons between control and other groups (e, j-l). Source data
Extended Data Fig. 9
Extended Data Fig. 9. Functions of peroxisomal β-oxidation and ROS in regulating ATGL levels in liver.
(a-b) Pex2 transcript in the liver and adipose tissue of liver-specific Pex2 knockout mice (Pex2KO) was quantified by qPCR (N = 5). (c) Atgl transcript in Pex2 knockout liver was quantified by qPCR (WT N = 7; Pex2KO N = 9). (d) ATGL lipase activity was measured using the liver lysate from Pex2KO mice (N = 7). (e) Hepatic peroxisomes were extracted from the liver-specific Cat knockout mice to determine cysteine sulfenic acid modification levels of peroxisomal proteins. Repeated 3 times. (f) ROSA26-LSL-spCas9 mice were injected with a pool of AAV to express Cat gRNA in the liver. After 2 weeks, ATGL protein levels were analyzed by indicated antibodies (N = 6). (g) Acoxfl/fl mice were injected with AAV-TBG-Cre virus to ablate hepatic Acox1 (Acox1KO). After 2 weeks, peroxisomal β-oxidation was measured using peroxisomes from livers (N = 5). (h) Hepatic peroxisomes were extracted from the liver specific Acox1 knockout mice to determine cysteine sulfenic acid modification levels of peroxisomal proteins. Repeated 3 times. (i) After harvesting liver from Acox1KO mice, hepatic ATGL levels were checked by IB with indicated antibodies (N = 6). (j) ATGL lipase activity was measured using the liver lysate from Acox1KO mice (N = 6). (k) Atgl transcript in Acox1 knockout liver was quantified by qPCR (N = 6). (l) Peroxisomes were extracted from the livers of mice following acute NAC administration to determine cysteine sulfenic acid modification levels of peroxisomal proteins. Repeated 3 times. (m) NAC was administered acutely by intraperitoneal injection into wild type mice at dosage of 500 mg/kg BW. Hepatic ATGL levels were checked by IB with indicated antibodies (Saline N = 15; NAC N = 17). (n) Quantification of Atgl transcript in the livers of mice following acute NAC administration (Saline N = 11; NAC N = 13). (o) Cysteine sulfenic acid modification in human liver biopsies was analyzed by IB and relative levels of cysteine sulfenic acid modification are presented (50 human samples with different steatosis levels). P = 0.0005 by Spearman test for correlation analysis. (p) Hepatic peroxisomes were extracted from the 14 weeks HFD challenged mice to determine cysteine sulfenic acid modification levels of peroxisomal proteins. Repeated 3 times. (q) After challenging mice with HFD for 16 weeks, hepatic ATGL protein levels were analyzed by indicated antibodies (NCD N = 10; HFD N = 9). (r) Atglfl/fl mice were injected with AAV-TBG-Cre virus to knock out Atgl in liver. After 2 weeks, hepatic peroxisomes were extracted from these mice to determine cysteine sulfenic acid modification levels of peroxisomal proteins. Repeated 3 times. (s) Fatty acid oxidation was measured in liver homogenate from Acox1KO and Pex2KO mice using 14C-labelled palmitate as substrate (N = 6). (t) Ex vivo lipolysis was determined via the measurement of glycerol released from liver pieces dissected from Acox1KO and Pex2KO mice (N = 6). (u) Rates of TG secretion from the livers of Acox1KO and Pex2KO mice were determined by plasma triglyceride accumulation within 4 hours after tail vein injection of tyloxapol (N = 5). (v) Fatty acid uptake rate in the livers of Acox1KO and Pex2KO mice was determined via fluorescence measurement in the liver extracts 30 min after tail vein injection of Bodipy-palmitate at the dose of 10 μg/mouse (N = 5). (w) Fatty acid esterification rate in the livers of Acox1KO and Pex2KO mice was determined via fluorescence measurement in the liver lipid droplet fraction 1 h after tail vein injection of Bodipy-palmitate at the dose of 10 μg/mouse (N = 5). Results are shown as mean ± SEM and analyzed using a Student’s two-sided t test. Source data
Extended Data Fig. 10
Extended Data Fig. 10. Functions of peroxisomal β-oxidation and ROS in regulating TAG mobilization in liver.
(a) ROSA26-LSL-spCas9 mice were injected with a pool of AAV to express Cat gRNA in the liver. After 2 weeks on NCD or 8 weeks on HFD, hepatic lipids were extracted for TAG content determination (NCD N = 5 in both genotypes; HFD N = 7 in both genotypes). (b) Representative H&E staining images of livers from liver specific Cat knockout mice fed on NCD or HFD for 8 weeks. Scale bar, 100μm. Repeated 3 times. (c) Acox1fl/fl mice were injected with AAV-TBG-Cre virus to knock out Acox1 in the liver. After 2 weeks on NCD or 8 weeks on HFD, hepatic lipids were extracted for TAG content determination (NCD N = 6 in both genotypes; HFD WT N = 8 and Acox1KO N = 9). (d) Representative H&E staining images of livers from liver specific Acox1 knockout mice fed on NCD or HFD for 8 weeks. Scale bar, 100μm. Repeated 3 times. (e-h) Lipophagy/autophagy in the livers was analyzed via IB using surrogate autophagy markers, as indicated. Repeated 3 times. Results are shown as mean ± SEM and analyzed using a Student’s two-sided t test. Source data

References

    1. Lodhi IJ, Semenkovich CF. Peroxisomes: a nexus for lipid metabolism and cellular signaling. Cell Metab. 2014;19:380–392. - PMC - PubMed
    1. Oaxaca-Castillo D, et al. Biochemical characterization of two functional human liver acyl-CoA oxidase isoforms 1a and 1b encoded by a single gene. Biochem. Biophys. Res. Commun. 2007;360:314–319. - PMC - PubMed
    1. Violante S, et al. Peroxisomes can oxidize medium- and long-chain fatty acids through a pathway involving ABCD3 and HSD17B4. FASEB J. 2019;33:4355–4364. - PMC - PubMed
    1. Wanders RJA. Metabolic functions of peroxisomes in health and disease. Biochimie. 2014;98:36–44. - PubMed
    1. Waterham HR, Ferdinandusse S, Wanders RJA. Human disorders of peroxisome metabolism and biogenesis. Biochim. Biophys. Acta Mol. Cell Res. 2016;1863:922–933. - PubMed

Publication types

MeSH terms