. 2021 Dec;3(12):1621-1632.
doi: 10.1038/s42255-021-00498-1. Epub 2021 Dec 13.

NADH inhibition of SIRT1 links energy state to transcription during time-restricted feeding

Affiliations

NADH inhibition of SIRT1 links energy state to transcription during time-restricted feeding

Daniel C Levine et al. Nat Metab. 2021 Dec.

Abstract

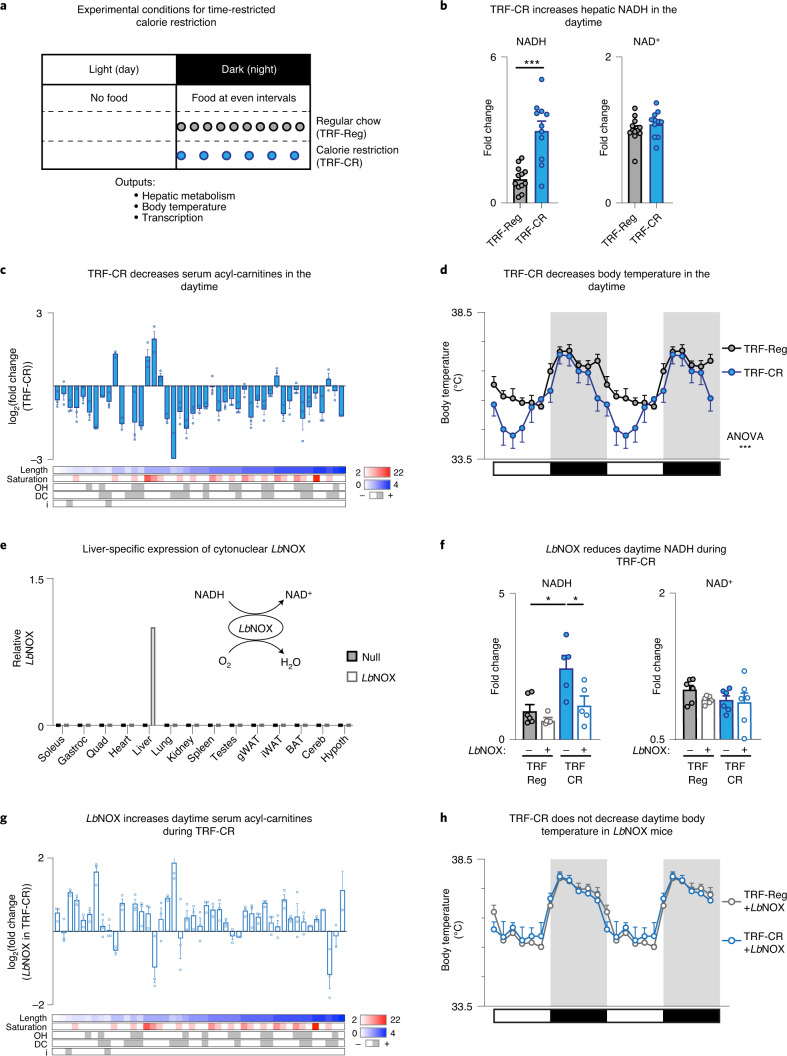
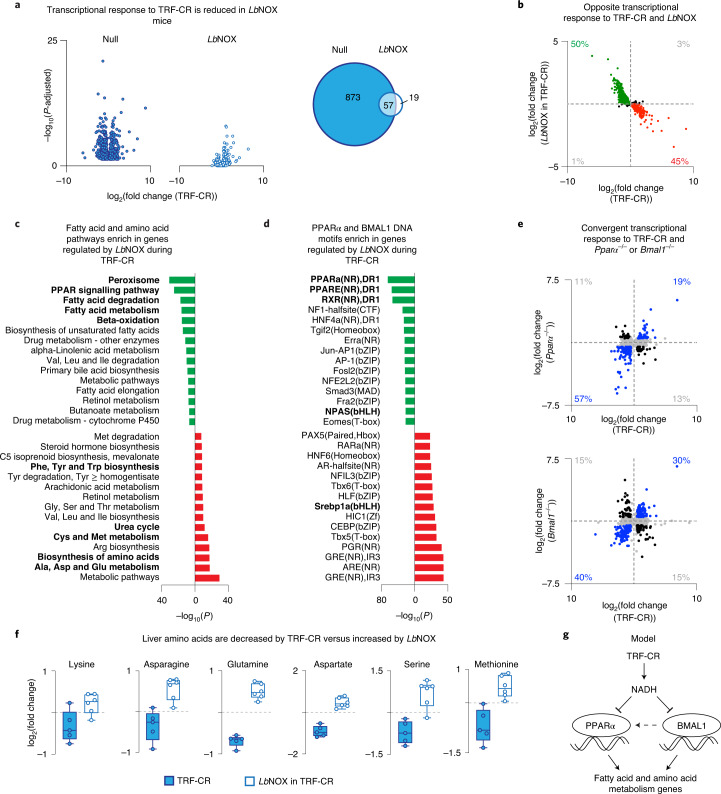
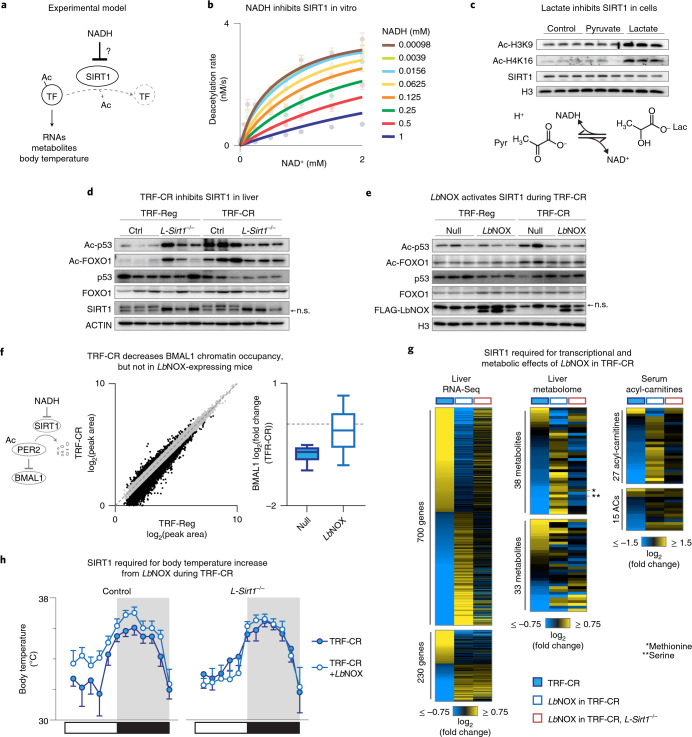
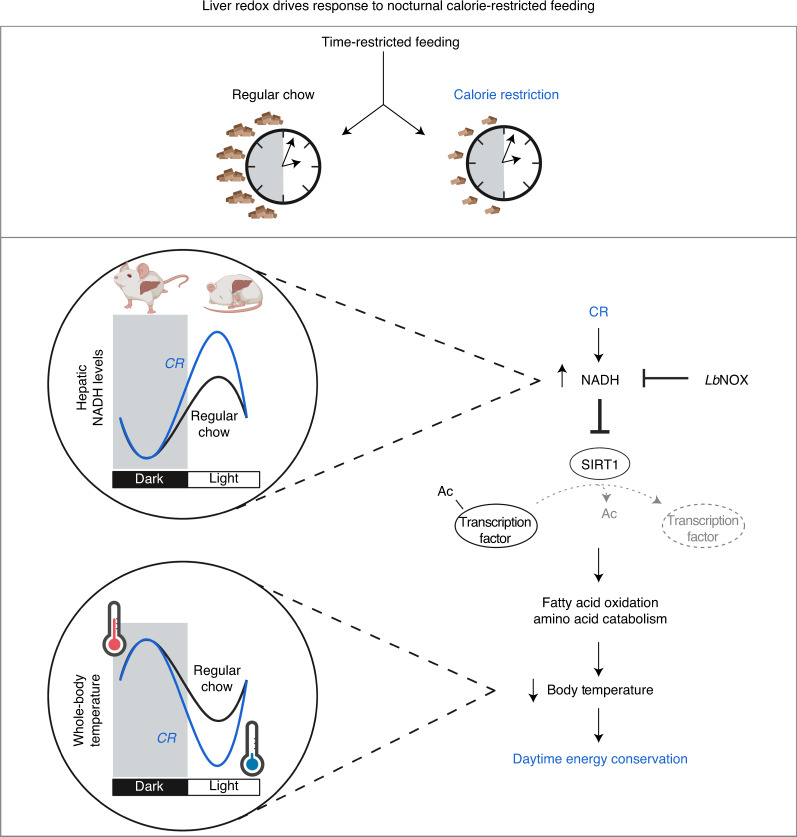
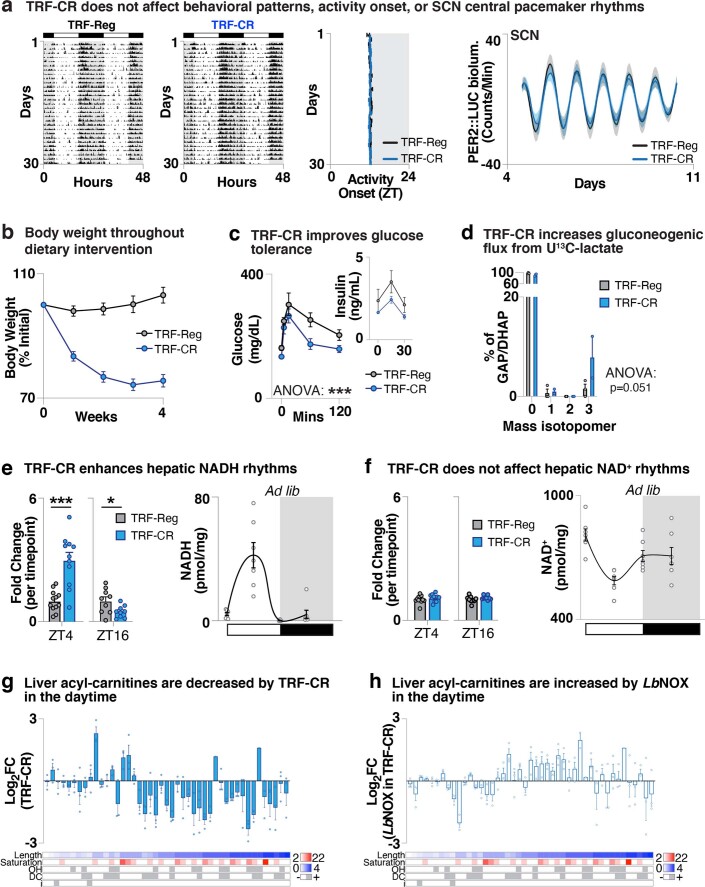
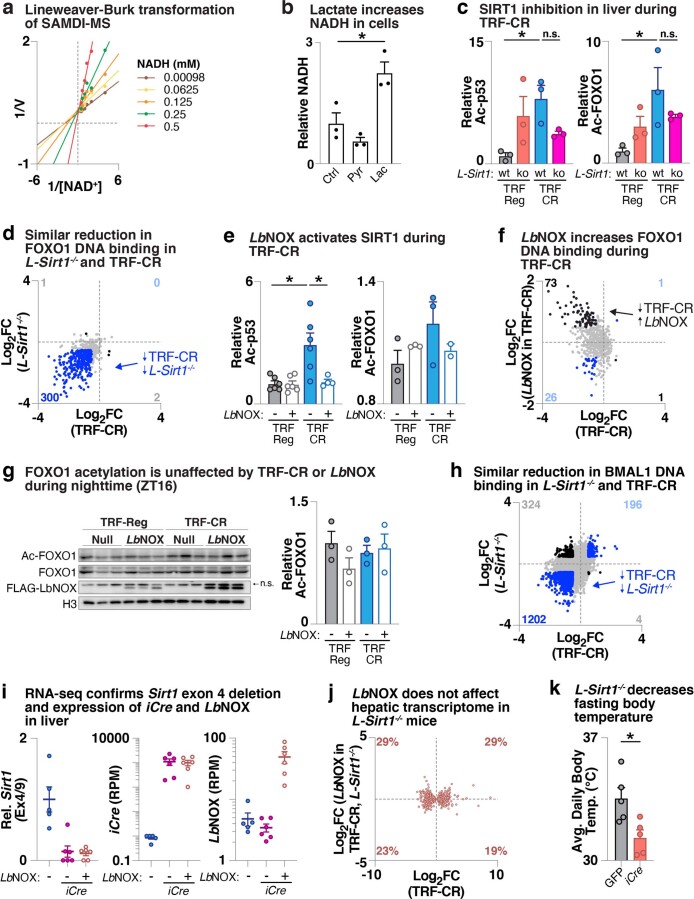
In mammals, circadian rhythms are entrained to the light cycle and drive daily oscillations in levels of NAD+, a cosubstrate of the class III histone deacetylase sirtuin 1 (SIRT1) that associates with clock transcription factors. Although NAD+ also participates in redox reactions, the extent to which NAD(H) couples nutrient state with circadian transcriptional cycles remains unknown. Here we show that nocturnal animals subjected to time-restricted feeding of a calorie-restricted diet (TRF-CR) only during night-time display reduced body temperature and elevated hepatic NADH during daytime. Genetic uncoupling of nutrient state from NADH redox state through transduction of the water-forming NADH oxidase from Lactobacillus brevis (LbNOX) increases daytime body temperature and blood and liver acyl-carnitines. LbNOX expression in TRF-CR mice induces oxidative gene networks controlled by brain and muscle Arnt-like protein 1 (BMAL1) and peroxisome proliferator-activated receptor alpha (PPARα) and suppresses amino acid catabolic pathways. Enzymatic analyses reveal that NADH inhibits SIRT1 in vitro, corresponding with reduced deacetylation of SIRT1 substrates during TRF-CR in vivo. Remarkably, Sirt1 liver nullizygous animals subjected to TRF-CR display persistent hypothermia even when NADH is oxidized by LbNOX. Our findings reveal that the hepatic NADH cycle links nutrient state to whole-body energetics through the rhythmic regulation of SIRT1.


Conflict of interest statement

The authors declare the following competing financial interest(s): M.M. is founder and chairman of SAMDI Tech Inc., which uses SAMDI-MS to perform high-throughput screening and assay chemistry to clients in the pharmaceutical industry. All other authors declare no competing financial interests.

Figures

Fig. 1
Fig. 1. Elevated NADH drives the daytime dip in body temperature during time-restricted calorie restriction.
a, Model for the TRF-CR diet using an automated feeder system in 4–6-month-old male C57BL/6J mice. Control mice received a 300 mg pellet of regular chow every 1.2 h throughout the dark period (TRF-Reg), whereas TRF-CR mice received a 300 mg pellet of a carbohydrate-depleted, nutrient-controlled chow every 2 h throughout the dark period, resulting in a 40% reduction in calories. b, Relative concentration of NADH and NAD+ by HPLC in liver of TRF-Reg (n = 12) and TRF-CR (n = 11) mice during the daytime (ZT4). c, log2(fold change) in daytime serum acyl-carnitine levels during TRF-CR compared with TRF-Reg mice (n = 3). d, Body temperature rhythms monitored non-invasively using subcutaneous probes in TRF-Reg (n = 12) and TRF-CR (n = 9) mice over 24 h (double plotted for clarity). e, Model depicting NADH-consuming reaction of LbNOX. Representative tissue-specific expression profile of cytonuclear LbNOX in null- and LbNOX-transduced mice relative to LbNOX-transduced liver. f, Relative concentration of NADH and NAD+ in liver of null- and LbNOX-transduced TRF-Reg (n = 6) or TRF-CR (n = 5 for NADH, n = 6 for NAD+) mice during the daytime. g, log2(fold change) in daytime serum acyl-carnitine levels in TRF-CR mice transduced with cytonuclear LbNOX compared with TRF-CR mice transduced with null virus (n = 3). h, Body temperature rhythms in LbNOX-expressing TRF-Reg (n = 12) or TRF-CR (n = 9) mice over 24 h (double plotted for clarity). Data are presented as mean ± s.e.m. Statistics were performed with unpaired, two-tailed Student’s t test unless otherwise noted in the figure. *P < 0.05, ***P < 0.001. ANOVA, analysis of variance; Cereb, cerebellum; DC, dicarboxylate; Gastroc, gastrocnemius muscle; gWAT, gonadal white adipose tissue; Hypoth, hypothalamus; i, isomer; iWAT, inguinal white adipose tissue; OH, hydroxy; Quad, quadriceps muscle.
Fig. 2
Fig. 2. Daytime NADH elevation regulates genome-wide transcription of fatty acid and amino acid metabolism genes during TRF-CR.
a, RNA-Seq in liver in the morning (ZT4) demonstrating the effect of TRF-CR in null-transduced (left) (n = 6) and LbNOX-transduced (middle) (n = 6 for TRF-Reg, n = 5 for TRF-CR) 4–6-month-old male C57BL/6J mice for genes differentially expressed (DESeq2 FDR-adjusted P < 0.05) by TRF-CR in null-transduced mice (930 genes). Venn diagram (right) displays overlap in differentially expressed genes by TRF-CR in null- and LbNOX-transduced mice. b, Quadrant plot comparing transcriptional responses between TRF-CR (x axis) and LbNOX in TRF-CR (y axis). Each point indicates a gene that is differentially expressed by TRF-CR in null-transduced mice (930 genes). Colouring indicates genes within quadrant 2 (green) and quadrant 4 (red), and the percentages within each quadrant are shown. c,d, For the genes within quadrants 2 and 4 from b, the top 15 (c) Kyoto Encyclopedia of Genes and Genomes (KEGG) terms enriched (P < 0.05) following gene ontology analysis and (d) JASPAR motifs enriched (P < 0.05) following HOMER DNA motif enrichment analysis are shown. e, Quadrant plots comparing the transcriptional response to TRF-CR in null-transduced mice (x axis) with that of genetic ablation of either Pparα (top) or Bmal1 (bottom) (y axis) in animals fed ad libitum. Each point indicates a gene that is differentially expressed by TRF-CR in null-transduced animals. Genes that have an absolute log2(fold change) > 0.5 for both comparisons are coloured blue or black, and the percentage of genes was determined by quadrant (n = 3). f, LC–MS metabolomics profiling of amino acids in liver during the daytime (ZT4). The log2(fold change) from TRF-CR (blue) (n = 5) and LbNOX in TRF-CR (white) (n = 6) is shown for select differential amino acids (two-tailed, unpaired Student’s t test with Benjamini and Hochberg adjustment for multiple measures FDR P < 0.05; see Supplementary Table 2 for full list of amino acids). Box and whisker plots depict the following: line, median; box limits, first and third quartiles; whiskers, 10th and 90th percentiles. g, Model depicting the interrelationship of NADH during TRF-CR to the activity of PPARα and BMAL1 and the transcription of downstream oxidative gene networks.
Fig. 3
Fig. 3. NADH inhibits SIRT1 in the morning during TRF-CR to regulate metabolism and body temperature.
a, Model to examine the role of SIRT1 in the NADH-dependent effects on RNAs, metabolites and body temperature during TRF-CR. b, Deacetylation rate for SIRT1 with increasing concentrations of NAD+ and NADH assayed by SAMDI-MS (n = 4). c, Model of pyruvate/lactate equilibrium shows that supplementation with pyruvate and lactate reduces and elevates NADH, respectively. Western blotting for SIRT1 targets, Ac-H3K9 and Ac-H4K16, in immortalized mouse embryonic fibroblasts treated with pyruvate or lactate to modulate NADH (n = 3). d,e, Western blotting for SIRT1 targets, Ac-p53 and Ac-FOXO1, in TRF-Reg or TRF-CR liver of 4–6-month-old male (d) control or liver-specific Sirt1/ mice or (e) null- or LbNOX-transduced mice. n.s., non-specific. Uncropped western blot scans labelled with molecular weight markers are presented in the Source Data files. f, BMAL1 ChIP-Seq in liver of TRF-Reg or TRF-CR mice. Peaks demonstrating an absolute log2(fold change) > 0.5 are coloured black. Box–whisker plots of BMAL1 ChIP-Seq demonstrating the effect of TRF-CR in null- (n = 6) and LbNOX-transduced (n = 3) liver on BMAL1 peaks identified in controls and with an absolute log2(fold change) > 0.5 in controls. Box and whisker plots depict the following: line, median; box limits, first and third quartiles; whiskers, 10th and 90th percentiles. g, Heatmap depicting log2(fold change) in gene expression (left), liver metabolite concentrations (middle) and serum acyl-carnitine levels (right) in indicated conditions/genotypes at ZT4. Heatmaps are subdivided into the genes, metabolites and acyl-carnitines that are regulated by LbNOX during TRF-CR through mechanisms requiring SIRT1 and sorted by effect of TRF-CR (RNA-Seq, n = 6; metabolomes, n = 5–6; acyl-carnitines n = 3). h, Body temperature rhythms over 24 h from subcutaneous probes implanted in null- (n = 6 for control, n = 5 for L-Sirt1/) or LbNOX-expressing (n = 5) control and liver-specific Sirt1/ mice on TRF-CR. Data are presented as mean values ± s.e.m. Source data
Fig. 4
Fig. 4. LbNOX redox state in liver drives energy conservation during nocturnal CR feeding.
TRF-CR generates rhythmic bouts of daytime torpor through increased levels of NADH in liver, inhibition of SIRT1 and downregulation of oxidative gene networks controlling acyl-carnitines and core body temperature. Reducing levels of NADH in the morning through the transduction of LbNOX in TRF-CR mice increases lipid oxidation through the activation of SIRT1, resulting in elevated daytime body temperature rhythms. These findings identify NAD(H) redox state as a link between TRF-CR and whole-body metabolism.
Extended Data Fig. 1
Extended Data Fig. 1. Circadian and metabolic profiling in TRF-CR mice.
a, (left) Representative wheel-running behaviour and (middle) quantification of average daily onset of activity for TRF-Reg (n = 5) and TRF-CR (n = 5) mice throughout the duration of the 4-wk intervention (double plotted for clarity). (right) Background-corrected PER2::LUCIFERASE readings from excised suprachiasmatic nucleus (SCN) of TRF-Reg (n = 6) and TRF-CR (n = 6) mice. The grey shading indicates mean values ± SEM. Experiments were performed in 4–6 mo old male C57BL6/J mice. b, Body weight of TRF-Reg (n = 15) and TRF-CR (n = 15) mice over the duration of the 4-wk study. c, Blood glucose and serum insulin during oral glucose tolerance testing performed during the daytime (at ZT4) in TRF-Reg (n = 6) and TRF-CR (n = 6) mice. d, GAP/DHAP mass isotopomer distribution determined by mass spectrometry of liver from TRF-Reg (n = 3) and TRF-CR (n = 2) mice 30 min following i.p. administration of a 10:1 mix of U13C-lactate:U13C-pyruvate (1 g/kg). e-f, (left) Relative concentration of (e) NADH and (f) NAD+ by HPLC in liver of TRF-CR compared to TRF-Reg mice during the day (ZT4) (n = 12 for TRF-Reg, n = 11 for TRF-CR,) and at night (ZT16) (n = 9 for each diet) for each time point. (right) Concentration of (e) NADH and (f) NAD+ in ad lib fed wild-type mouse liver by HPLC every 6 hrs for 24 hrs (n = 7). g-h, Log2-FC in daytime liver acyl-carnitine levels in (g) TRF-CR compared to TRF-Reg mice and (h) LbNOX- compared to null-overexpressing TRF-CR mice (n = 3). Data are presented as mean values ± SEM. Statistics were performed with unpaired, two-tailed student’s t test except as otherwise noted in the figure. *p < 0.5, ***p < 0.01.
Extended Data Fig. 2
Extended Data Fig. 2. Daytime NADH elevation regulates genome-wide transcription of fatty acid metabolism genes through BMAL1 during TRF-CR.
a, (left) RNA-seq reads per 10 million sequenced reads (RPM) that align to LbNOX in LbNOX- vs null-transduced TRF-Reg (n = 6 per genotype) and TRF-CR (n = 6 for null; n = 5 for LbNOX) liver. (right) Representative in situ immunohistochemistry against FLAG-LbNOX in liver of null- and LbNOX-transduced mice. Experiments were performed in 4–6 mo old male C57BL6/J mice unless otherwise noted. b, Heatmap depicting log2-FC in gene expression from TRF-CR and LbNOX in TRF-CR for genes within gluconeogenic and glycolytic gene ontology groups. c, Unbiased principal components analysis during the day (ZT4) or night (ZT16) of null- and LbNOX-expressing TRF-Reg or TRF-CR mice for genes that are differentially-expressed by TRF-CR in null mice at respective time points (DESeq2 p-adj<0.05) (n as in panel a). d, Log2-transformed FC in expression of select fatty acid metabolism genes during TRF-CR (blue) (n = 6), following LbNOX-overexpression during TRF-CR (white) (n = 5), and in Bmal1 knockout liver (purple) (n = 3). e, 24-hour fasted body temperatures in 4–6 mo old female liver-specific Bmal1fx/fx mice before and after retro-orbital administration of AAV8–TBG-iCre (n = 6) (left: ANOVA, p < 0.01; right: *p < 0.05 in paired, two-way student’s t test). f, Log2-transformed FC in expression of genes within the methionine pathway for conditions (n as in panel d). g, (top) Summary of methionine pathway and (bottom) metabolomics of effect of TRF-CR and LbNOX in TRF-CR on end-products of methionine metabolism in liver and serum performed during the daytime (ZT4) (n = 3). Data are presented as mean values ± SEM.
Extended Data Fig. 3
Extended Data Fig. 3. NADH inhibition of SIRT1 activity.
a, Lineweaver-Burk transformation of data from SAMDI-MS. b, Relative NADH quantified by HPLC following supplementation with pyruvate or lactate compared to controls (n = 3). c, Densitometric quantification of western blots from liver of 4–6 mo old male mice in indicated genotypes at ZT4 for p53-(K379)Ac (left) and FOXO1-(K242, K245, K262)Ac (right) relative to control TRF-Reg (from Fig. 3d) (n = 3). d, FOXO1 ChIP-seq from liver collected during the daytime comparing effect of FOXO1 binding in TRF-CR (x-axis) with the effect of hepatic SIRT1 ablation (L-Sirt1/) (y-axis). Each point indicates a FOXO1 peak in control liver. Peaks that have absolute log2(fold change) >0.5 for both comparisons are colored blue or black and counted by quadrant (n = 2). e, Densitometric quantification of western blots as in (c) relative to null-transduced TRF-Reg mice (from Fig. 3e) (Ac-p53: n = 4 for TRF-CR, LbNOX. n = 6 for all other conditions; Ac-FOXO1: n = 2 for TRF-CR, LbNOX. n = 3 for all other conditions). f, FOXO1 ChIP-seq from liver during the daytime comparing effect of TRF-CR (x-axis) (n = 3) with effect of (f) LbNOX in TRF-CR mice (y-axis) (n = 2) with coloring and counting as in panel d. (n = 2–3). g, Western blotting for Ac-FOXO1 during the nighttime (ZT16) in null- and LbNOX-transduced mice on TRF-Reg and TRF-CR (n.s. non-specific) and densitometric quantification (n = 3). h, BMAL1 ChIP-seq from liver during the daytime comparing the effect of TRF-CR and L-Sirt1/ as in panel d (n = 3). Uncropped Western blot scans labelled with molecular weight markers are presented in the Source Data Files. i, RNA-seq reads mapping to the exon of Sirt1 that is flanked by LoxP sites (Ex4) relative to exon 9 (Ex9) of Sirt1, and RNA-seq reads per 10 million sequenced reads (RPM) that align to iCre and LbNOX in null- or LbNOX-transduced TRF-CR mice co-transduced with iCre (n = 6). Null-expressing mice on TRF-CR (blue) (n = 5) are shown as reference. j, Quadrant plot comparing transcriptional responses to TRF-CR in null-transduced mice (x-axis) (n = 6) and LbNOX-expression in TRF-CR, L-Sirt1/ mice (y-axis) (n = 6). Each point indicates a gene that is DE by TRF-CR in null-transduced mice (930 genes). Percentages of genes within each quadrant are shown. k, Average 48-hour fasting body temperature in 4–6 mo old female liver-specific Sirt1/ mice (n = 5). Data are presented as mean values ± SEM. Statistics were performed with unpaired, two-tailed student’s t test except as otherwise noted in the figure. *p < 0.05. Source data

Comment in

References

    1. Bass J, Lazar MA. Circadian time signatures of fitness and disease. Science. 2016;354:994–999. - PubMed
    1. Koike N, et al. Transcriptional architecture and chromatin landscape of the core circadian clock in mammals. Science. 2012;338:349–354. - PMC - PubMed
    1. Zhang R, Lahens NF, Ballance HI, Hughes ME, Hogebesch JB. A circadian gene expression atlas in mammals: implications for biology and medicine. Proc. Natl Acad. Sci. USA. 2014;111:16219–16224. - PMC - PubMed
    1. Lin S-J, et al. Calorie restriction extends Saccharomyces cerevisiae lifespan by increasing respiration. Nature. 2002;418:344–348. - PubMed
    1. Weindruch R, Walford RL, Fligiel S, Guthrie D. The retardation of aging in mice by dietary restriction: longevity, cancer, immunity and lifetime energy intake. J. Nutr. 1986;116:641–654. - PubMed

Publication types