. 2022 Feb;23(1):75-94.
doi: 10.1007/s10162-021-00820-4. Epub 2021 Dec 13.

Cortical Processing of Binaural Cues as Shown by EEG Responses to Random-Chord Stereograms

Affiliations

Cortical Processing of Binaural Cues as Shown by EEG Responses to Random-Chord Stereograms

Henri Pöntynen et al. J Assoc Res Otolaryngol. 2022 Feb.

Abstract

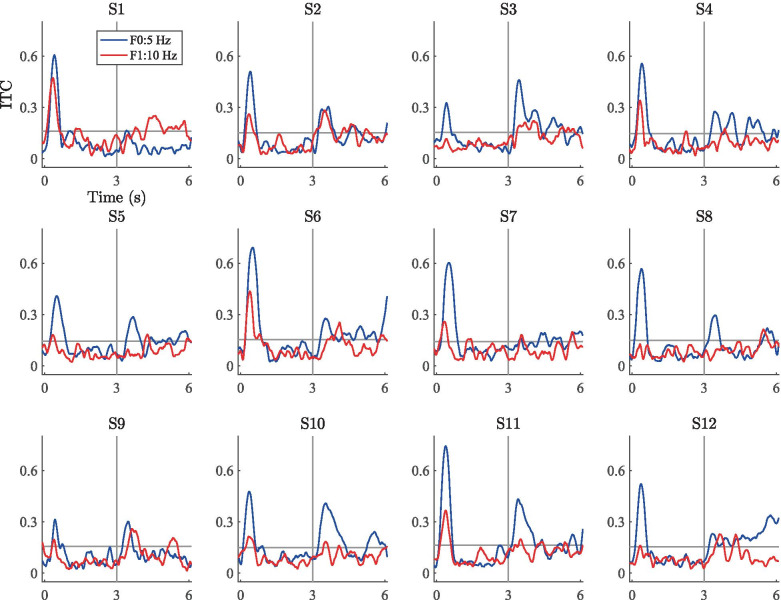
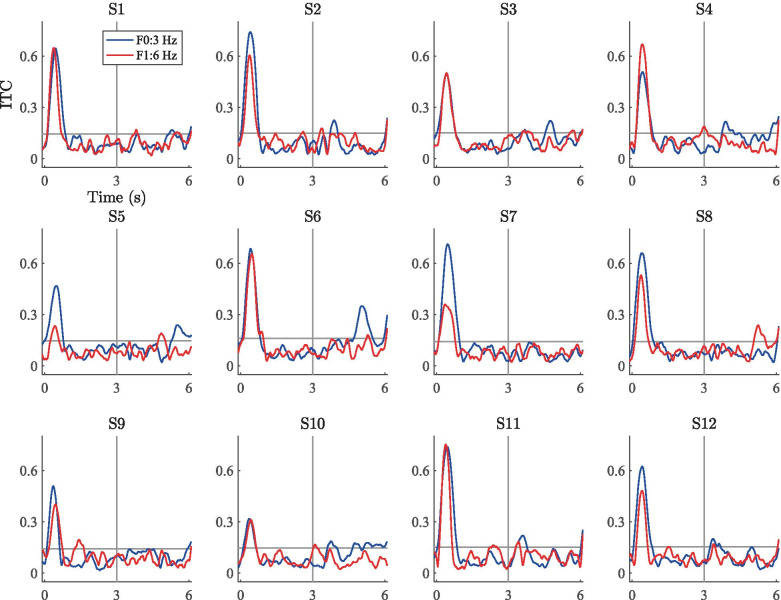
Spatial hearing facilitates the perceptual organization of complex soundscapes into accurate mental representations of sound sources in the environment. Yet, the role of binaural cues in auditory scene analysis (ASA) has received relatively little attention in recent neuroscientific studies employing novel, spectro-temporally complex stimuli. This may be because a stimulation paradigm that provides binaurally derived grouping cues of sufficient spectro-temporal complexity has not yet been established for neuroscientific ASA experiments. Random-chord stereograms (RCS) are a class of auditory stimuli that exploit spectro-temporal variations in the interaural envelope correlation of noise-like sounds with interaurally coherent fine structure; they evoke salient auditory percepts that emerge only under binaural listening. Here, our aim was to assess the usability of the RCS paradigm for indexing binaural processing in the human brain. To this end, we recorded EEG responses to RCS stimuli from 12 normal-hearing subjects. The stimuli consisted of an initial 3-s noise segment with interaurally uncorrelated envelopes, followed by another 3-s segment, where envelope correlation was modulated periodically according to the RCS paradigm. Modulations were applied either across the entire stimulus bandwidth (wideband stimuli) or in temporally shifting frequency bands (ripple stimulus). Event-related potentials and inter-trial phase coherence analyses of the EEG responses showed that the introduction of the 3- or 5-Hz wideband modulations produced a prominent change-onset complex and ongoing synchronized responses to the RCS modulations. In contrast, the ripple stimulus elicited a change-onset response but no response to ongoing RCS modulation. Frequency-domain analyses revealed increased spectral power at the fundamental frequency and the first harmonic of wideband RCS modulations. RCS stimulation yields robust EEG measures of binaurally driven auditory reorganization and has potential to provide a flexible stimulation paradigm suitable for isolating binaural effects in ASA experiments.

Keywords: Auditory scene analysis; Binaural hearing; Electroencephalography; Interaural envelope correlation; Random-chord stereogram.


Figures

Fig. 1
Fig. 1
Stimulation paradigm for RCS stimuli. Each ear is presented with a noise-like sound with spectro-temporal patterns encoded into the envelope correlation of the left and right channels. The embedded patterns are perceivable only in binaural listening
Fig. 2
Fig. 2
Schematic illustration of the structure of a single RCS stimulus channel. A random time–frequency-domain binary map determines which frequency bands are gated at each 10-ms time bin. White and black matrix pixels denote time–frequency elements where the corresponding narrow-band envelope has a value of one or zero, respectively. Envelopes are generated and applied independently to each sinusoidal frequency in the tone cluster
Fig. 3
Fig. 3
Correlation matrices for the RCS stimuli used in the EEG recordings. Gray pixels denote time–frequency elements that are gated independently in the left and right channels. Conversely, white pixels denote time–frequency elements that are gated coherently across the left and right channels. All three stimuli consisted of an initial 3-s unmodulated segment and a subsequent 3-s segment with RCS modulations. For wideband stimuli, RCS modulations were applied to all time–frequency elements at rates of 3 or 5 Hz. In the ripple stimulus, the correlation matrix consisted of shifting regions of correlated and uncorrelated frequency bands resulting in a spectro-temporal ripple pattern in the binaural envelope correlation
Fig. 4
Fig. 4
Topographical view of the electrode montage used in the recordings. During the recordings, FCz (gray) was used as the reference electrode and AFz (black) as the ground electrode. The yellow electrodes denote the fronto-central cluster chosen for data analysis. The teal-colored electrodes were used to form the pseudo-mastoid reference used in offline processing
Fig. 5
Fig. 5
Grand-average ERPs (1610, 1627 and 1552 repetitions) from 12 subjects measured across the electrodes in the fronto-central cluster (see Fig.4). Shaded regions denote the standard deviation of the ERPs across subjects. The vertical line at 3 s denotes the onset of the RCS modulations. The blue and red horizontal lines denote the time periods (segments 1 and 2) of the ERPs extracted for spectral analysis (see Sec. Frequency-Domain Results for details)
Fig. 6
Fig. 6
Left panel: Grand-average change-onset responses. Data as in Fig. 5, but baseline corrected according to a 100-ms time period prior to the onset of the RCS modulations (i.e., 2.9 - 3.0 s). Right panel: Mean peak-to-peak amplitudes of the change-onset responses. Error bars denote the standard error across 12 subjects
Fig. 7
Fig. 7
Average power spectra measured across the fronto-central electrodes for unmodulated steady-state stimulus segments (segment 1, 1-3 s post stimulus onset, blue traces) and RCS-modulated steady-state segments (segment 2, 4 - 6 s post stimulus onset, red traces). Amplitudes are normalized to a common peak value. The shaded regions denote the standard error measured across the 12 subjects. The vertical gray lines denote the fundamental frequency (F0) and the two lowest harmonics (F1 and F2) of the RCS modulation frequency for each stimulus. The 3-Hz wideband stimulus evoked the largest activity at F0 and F1 of the RCS modulations (i.e., 3 and 6 Hz). The spectral power at the corresponding harmonics for the 5-Hz stimulus was lower than in the 3-Hz case, but higher than in the unmodulated segments. The lowest amplitudes were measured for the 3-Hz ripple stimulus
Fig. 8
Fig. 8
Scatter plots of the subject-wise gains in power spectral density between segment 1 (1-3 s) and segment 2 (4-6 s) of the subject ERPs. F0 and F1 denote the fundamental frequency and first harmonic of the RCS modulations, respectively. Data points correspond to the PSD measurements from individual subjects. The red square corresponds to the median F0 and F1 coordinates of the data points. In the case of the 3-Hz wideband stimulus, all points are within the upper-right quadrant of the plot, indicating that PSD was higher for all subjects in segment 2 than in segment 1 for both F0 and F1; The magnitude of the F0 and F1 gains vary across subjects. Similarly, for the 5-Hz wideband stimulus, most data points lie in the upper-right quadrant, indicating a PSD increase at both frequencies for most subjects. Further, the magnitudes for the 5-Hz stimulus are lower (data points closer to origin) than in the case of the 3-Hz stimulus. For the 3-Hz ripple stimulus, the points are more widely spread across the quadrants, and the cluster median (red square) is near the origin, suggesting no systematic effects
Fig. 9
Fig. 9
Mean ITC responses computed across the fronto-central electrode cluster for the three stimuli. The color scale clips at 0.4
Fig. 10
Fig. 10
Mean ITC values at the fundamental frequency (F0) and first harmonic (F1) of the RCS patterns measured across the unmodulated segment 1 (here, 1-2 s, denoted by blue bars) and RCS modulated segment 2 (here, 4-5 s, denoted by red bars) of the three stimulus types. Error bars denote the standard error measured across 12 subjects
Fig. 11
Fig. 11
Scatter plots of the subject-wise changes in mean ITC between segment 1 (1-2 s) and segment 2 (4-5 s) of the subject responses. F0 and F1 denote the fundamental frequency and first harmonic, respectively, of the RCS modulations. Data points correspond to the mean ITC measurements from individual subjects. The red square corresponds to the median F0 and F1 coordinates of the data points. In the case of the 3-Hz wideband stimulus, most data points are in the upper-right quadrant of the plot, indicating that ITC increased systematically in segment 2 relative to segment 1. Similarly, for the 5-Hz wideband stimulus, most data points lie in the upper-right quadrant, indicating an increase in ITC at both frequencies for most subjects, but gains in ITC magnitudes are lower than in the case of the 3-Hz stimulus. For the 3-Hz ripple stimulus, the points are more widely spread across the quadrants and clustered near the origin, suggesting variable responses across subjects and a lack of general-level effects on ITC
Fig. 12
Fig. 12
ITC time series for the 3-Hz wideband stimulus. The blue and red traces correspond to the fundamental frequency and the first harmonic, respectively. The horizontal gray line denotes the subject-specific threshold value for statistical significance according to Eq. (4). The vertical line denotes the onset of the RCS modulation
Fig. 13
Fig. 13
ITC time series for the 5-Hz wideband stimulus. Data presented as in Fig. 12
Fig. 14
Fig. 14
ITC time series for the 3-Hz ripple stimulus. Data presented as in Fig. 12

References

    1. Alain C. Breaking the wave: effects of attention and learning on concurrent sound perception. Hear Res. 2007;229(1–2):225–236. - PubMed
    1. Alain C, Izenberg A. Effects of attentional load on auditory scene analysis. J Cogn Neurosci. 2003;15(7):1063–1073. - PubMed
    1. Alain C, McDonald KL. Age-related differences in neuromagnetic brain activity underlying concurrent sound perception. J Neurosci. 2007;27(6):1308–1314. - PMC - PubMed
    1. Alain C, Arnott SR, Picton TW. Bottom-up and top-down influences on auditory scene analysis: Evidence from event-related brain potentials. J Exp Psychol Hum Percept Perform. 2001;27(5):1072. - PubMed
    1. Alain C, Schuler BM, McDonald KL. Neural activity associated with distinguishing concurrent auditory objects. J Acoust Soc Am. 2002;111(2):990–995. - PubMed

Publication types

LinkOut - more resources